Triage Alerts and Create Cases
Assess an alert, pivot through supporting evidence, and preserve a defensible disposition in a case.
Triage questions
Before acknowledging, dismissing, or escalating an alert, determine what happened, which systems and identities were involved, which raw fields support the conclusion, whether related activity exists, and what evidence is missing.
Detailed triage procedure
Alert Triage and Case Creation
To begin reviewing security alerts, go to the Alerts tab in the SOC web interface. This is where all triggered alerts are displayed, helping you identify suspicious or potentially malicious activity in your environment.
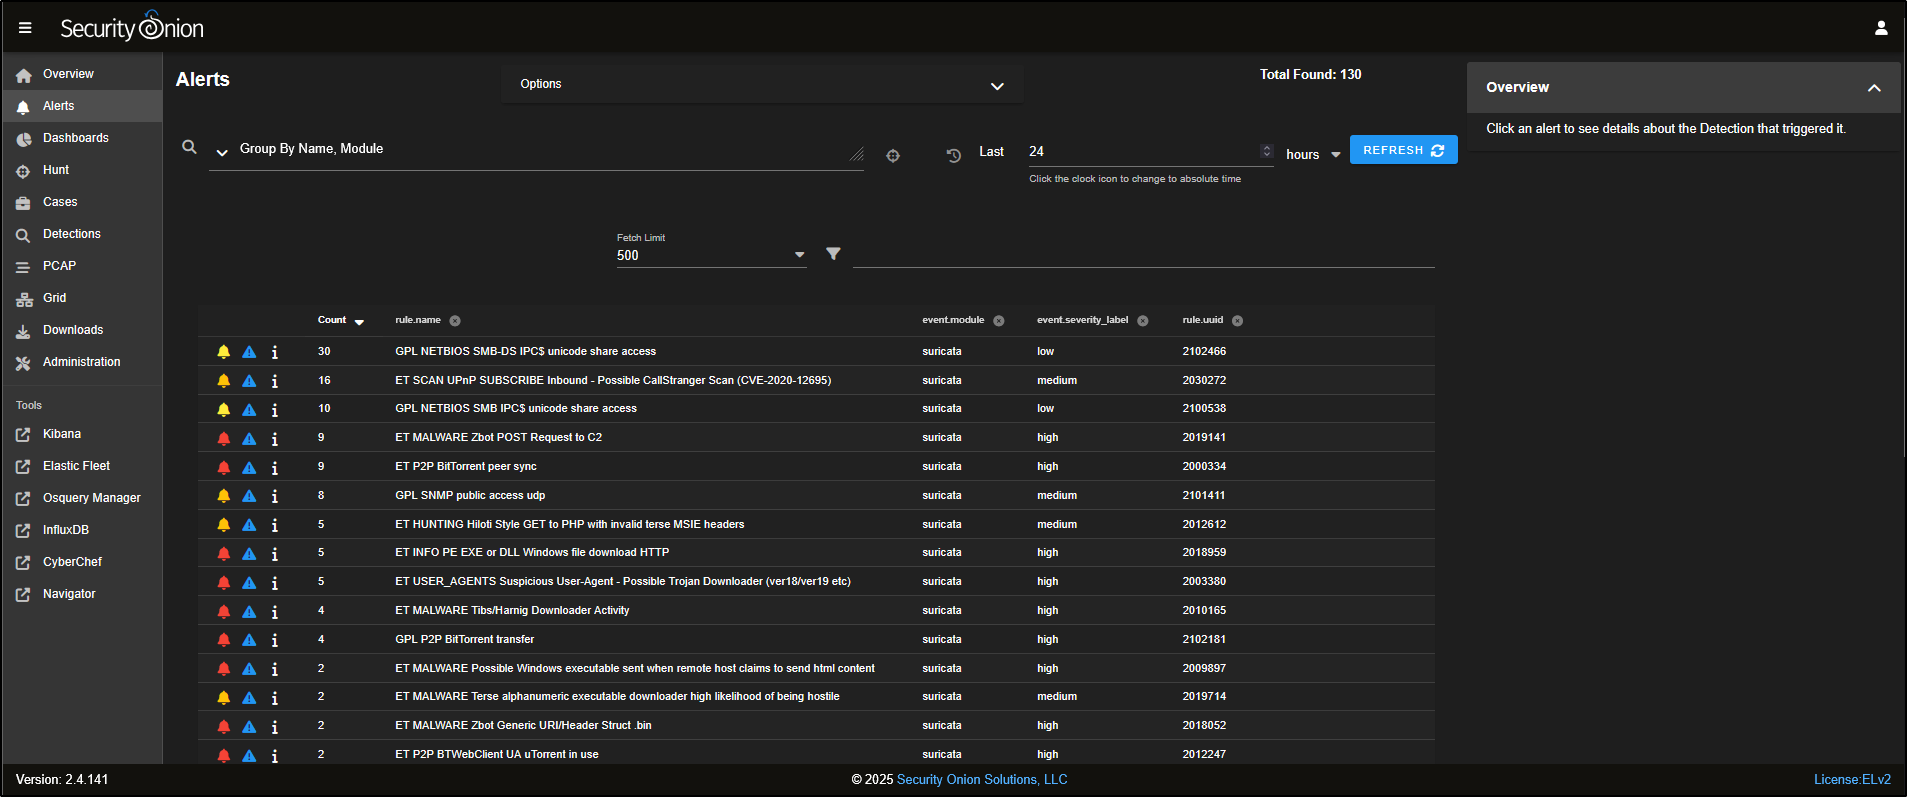
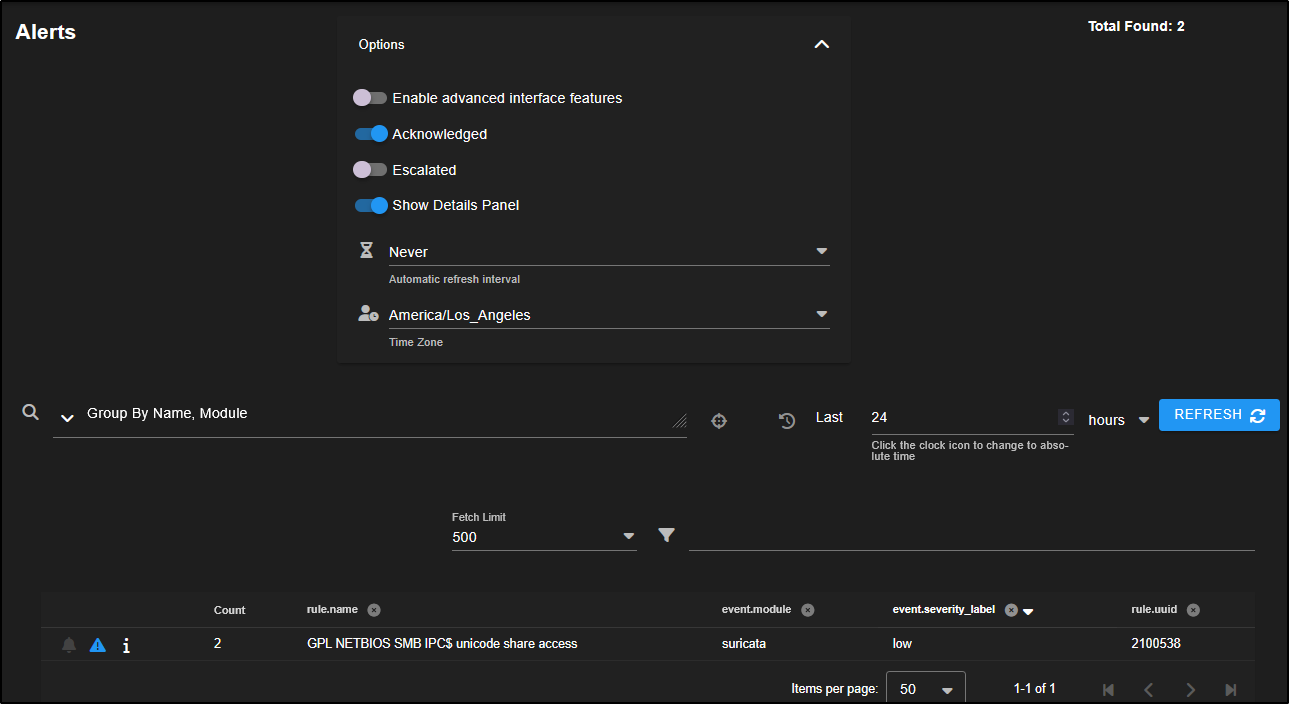
At the top of the Alerts page, there is an Options drop-down menu that lets you customise how alerts are displayed:
- Enable advanced interface features makes the alert view work more like the Hunt interface.
- Acknowledged shows alerts you have marked as false positives.
- Escalated shows alerts that have been turned into cases for further investigation.
- You can also set an auto-refresh interval to check for new alerts regularly.
- The time zone setting adjusts how timestamps appear. Logs are stored in UTC, but the web console converts them to your local time zone for easier viewing.
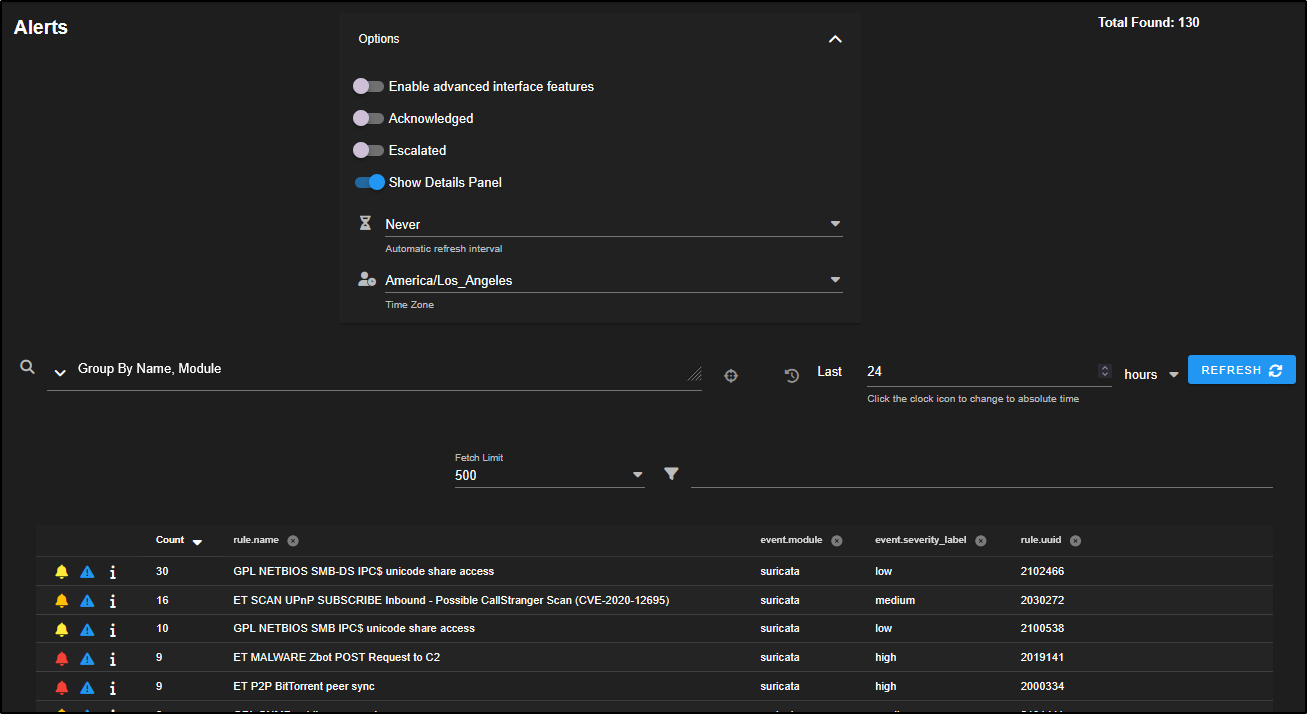
Total Found shows the number of alerts triggered during the selected time period. It counts every alert, not just the number of different rules that were matched.
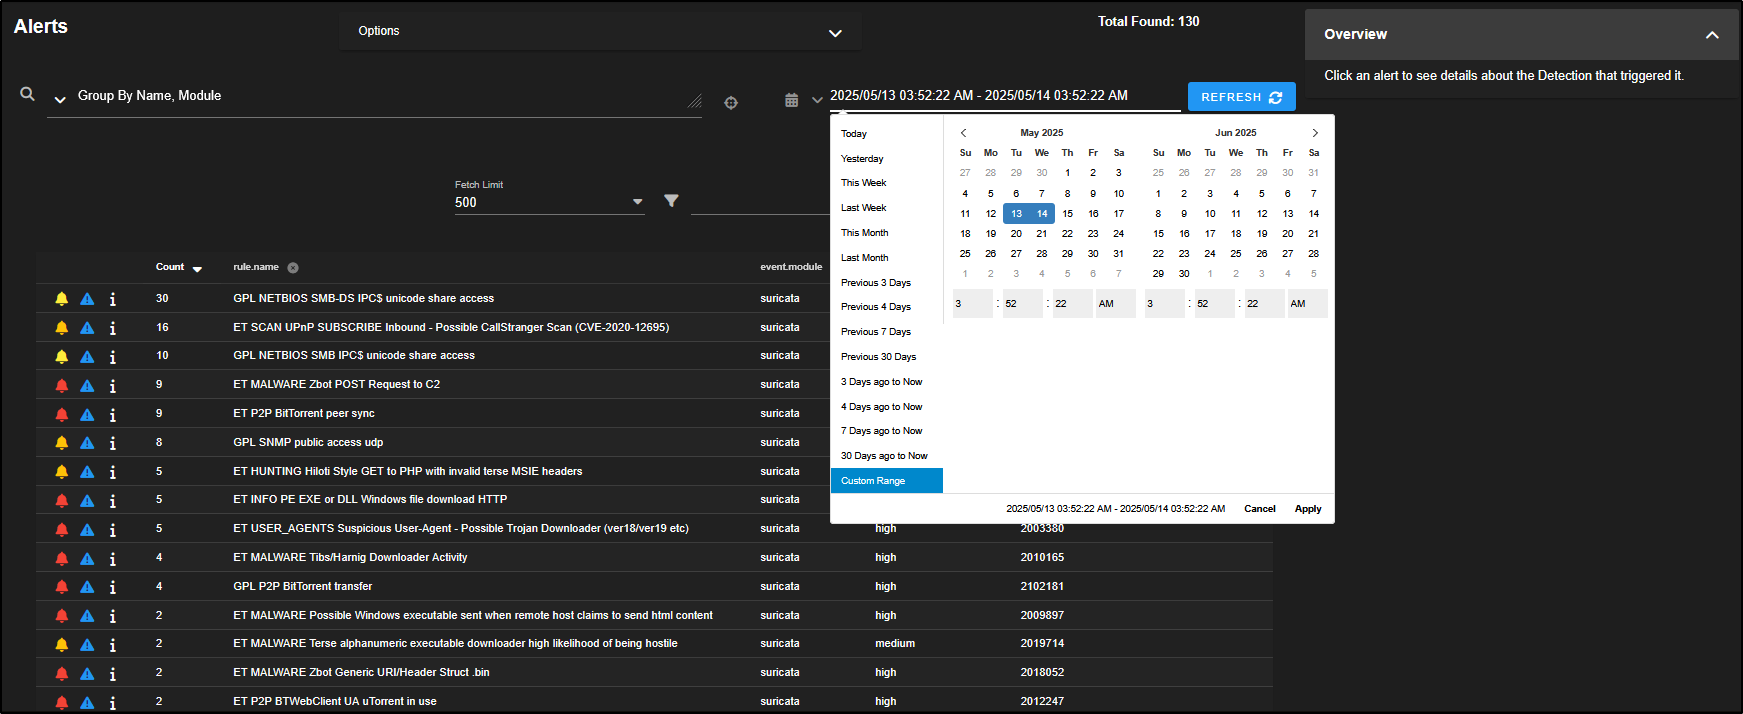
By default, the Time Selector is set to relative time, so we are looking at alerts from the past 24 hours. If needed, you can switch to a specific date and time by clicking the clock icon, but for now we will stick with the relative view.
In the upper left corner, there is a query drop-down menu. By default, alerts are grouped by the rule name and the module that generated them typically from tools like Suricata, Strelka, or Sigma-based detections.
Each rule also has a severity level, which is defined in the rule itself. You can adjust this if it does not suit your environment.
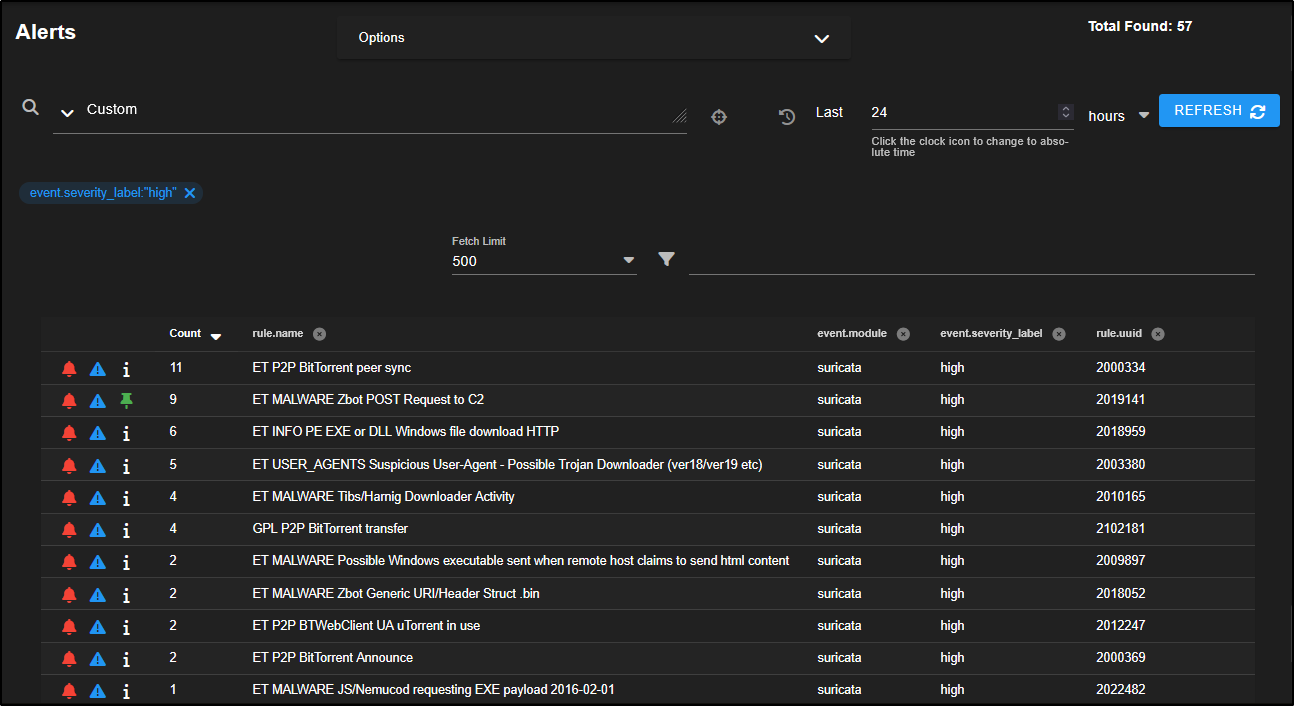
To focus on high severity alerts, simply click on high, then choose Include to filter your results.
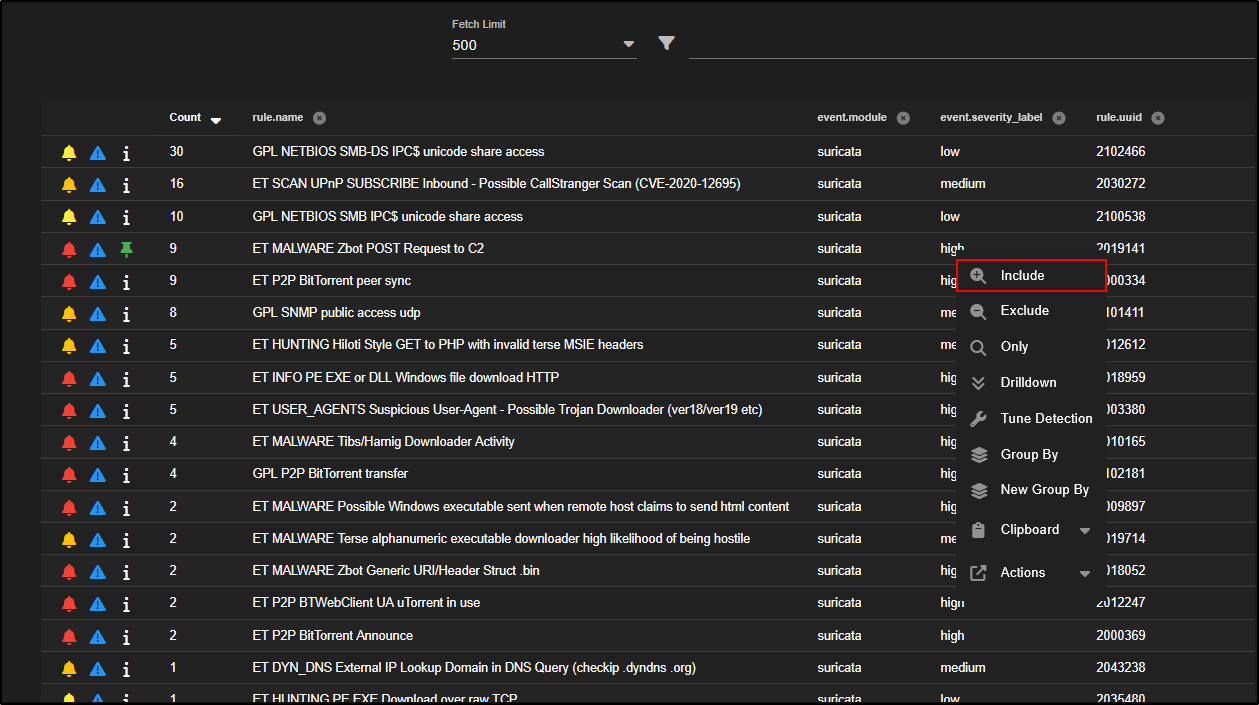
This adds the severity filter to your search query, shown as a blue tag labelled event.severity_label:"high".
You can also sort the alerts by severity level by clicking on the event.severity_level column heading.
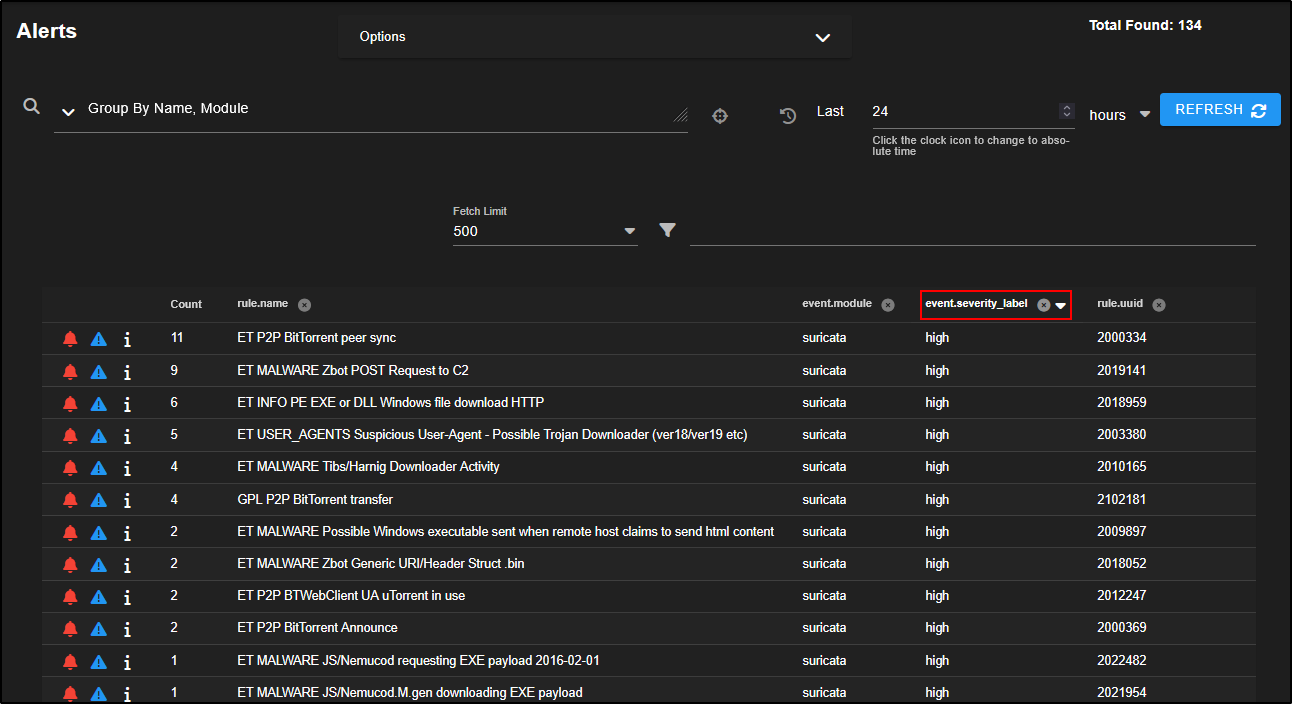
The Count column shows how many times a particular alert has been triggered.
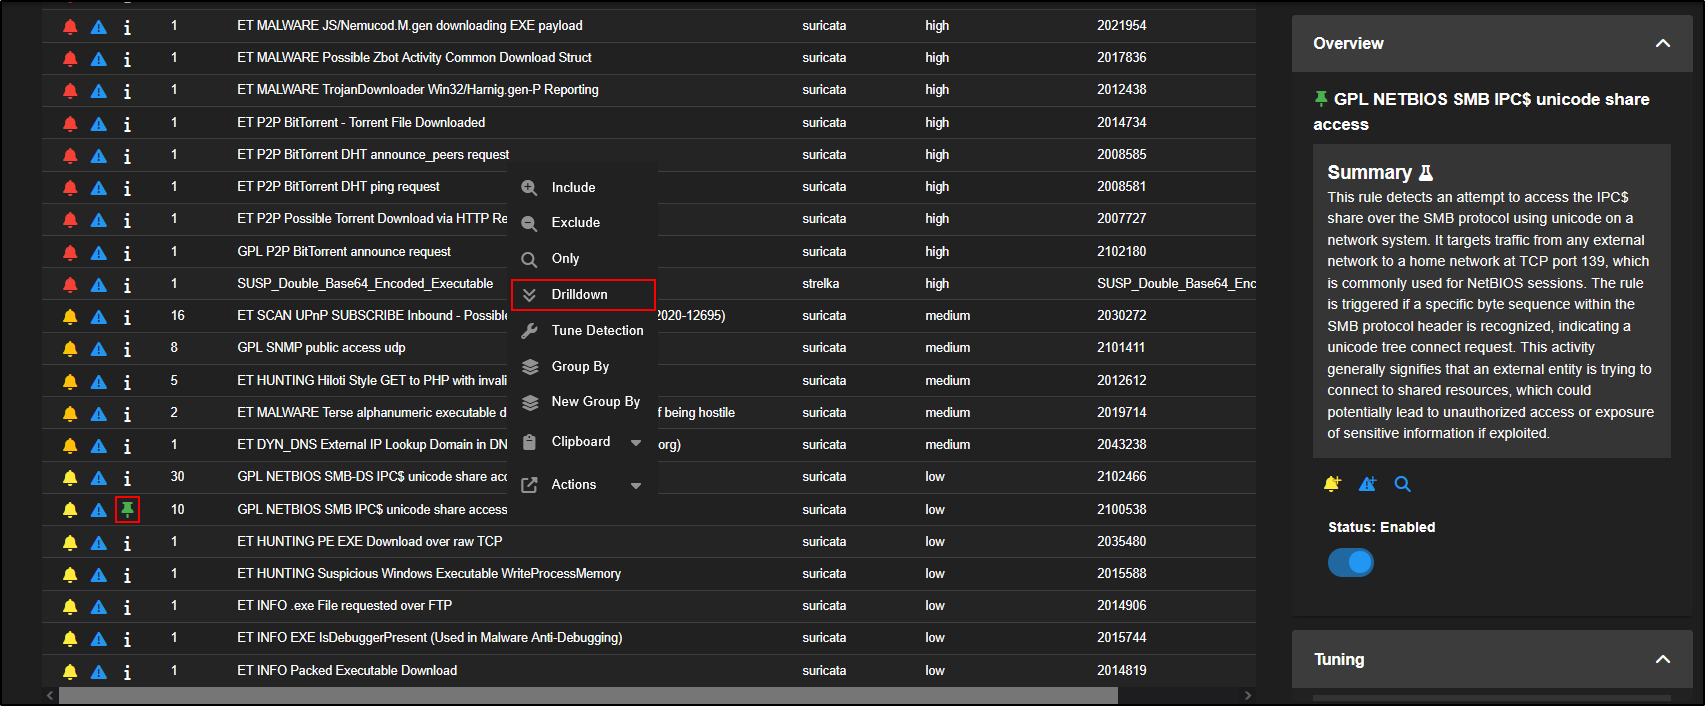
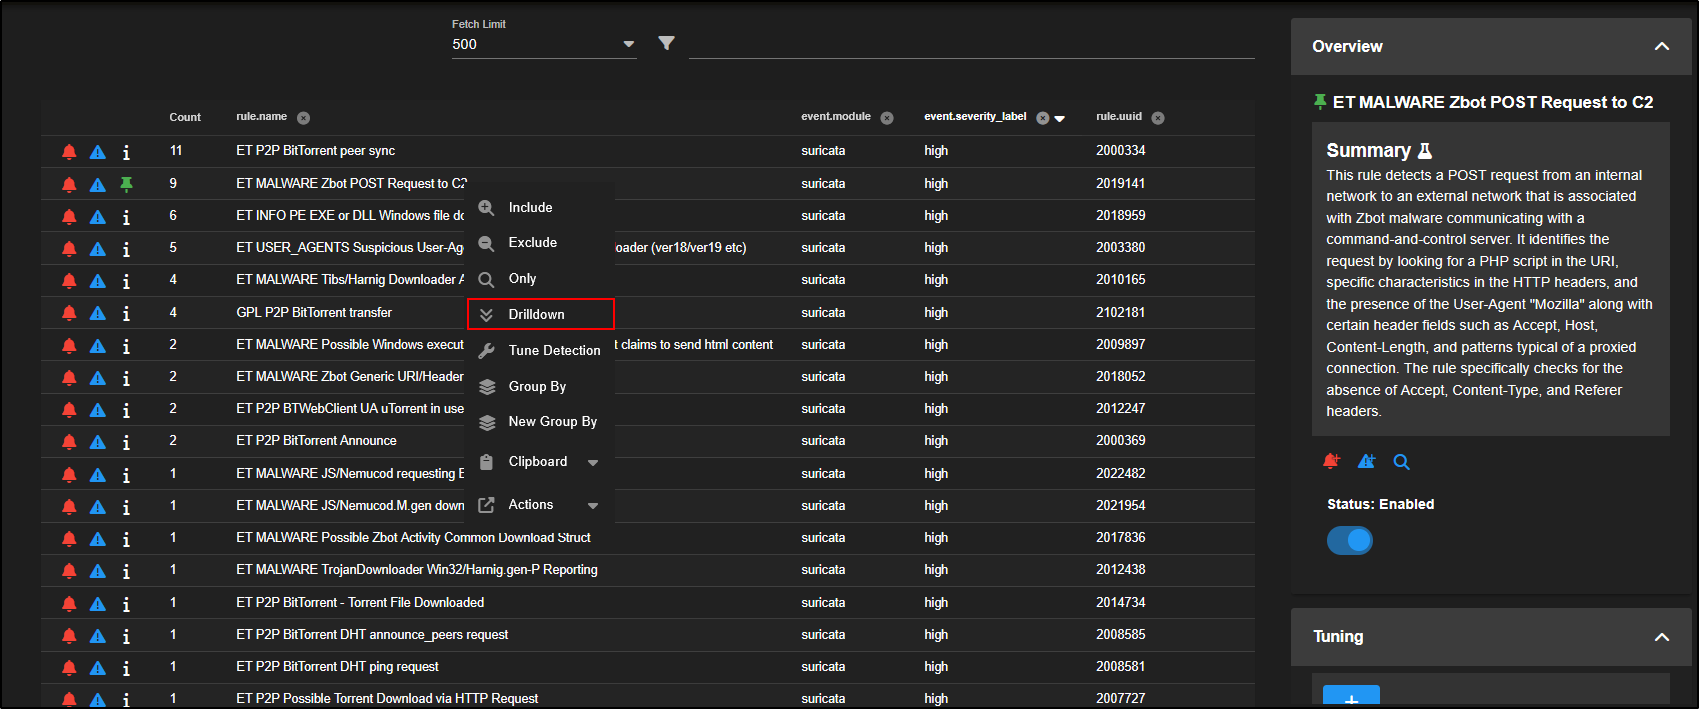
By default, alerts are grouped by rule name. If you want to see the individual alert events, click on the Count number or the rule name, then choose Drilldown.
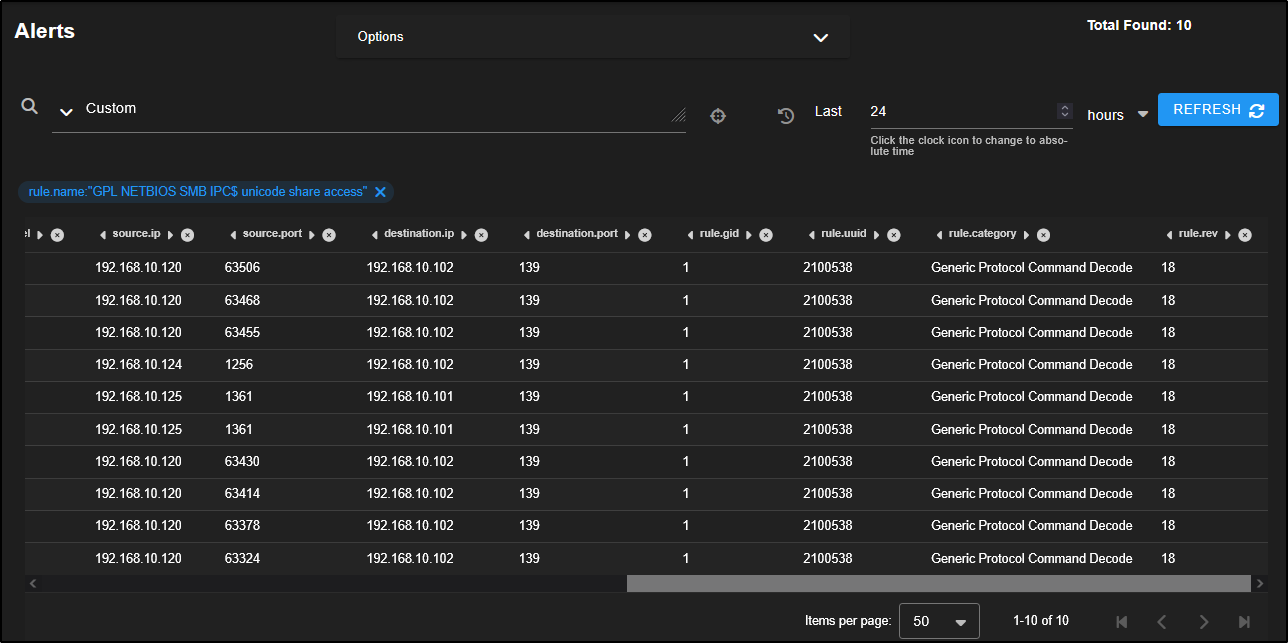
For example, click on GPL NETBIOS SMB IPC$ unicode share access and select Drilldown.
Note: Clicking the info icon next to the rule will turn it into a green pin and display a summary of what the rule is designed to detect in the side panel.
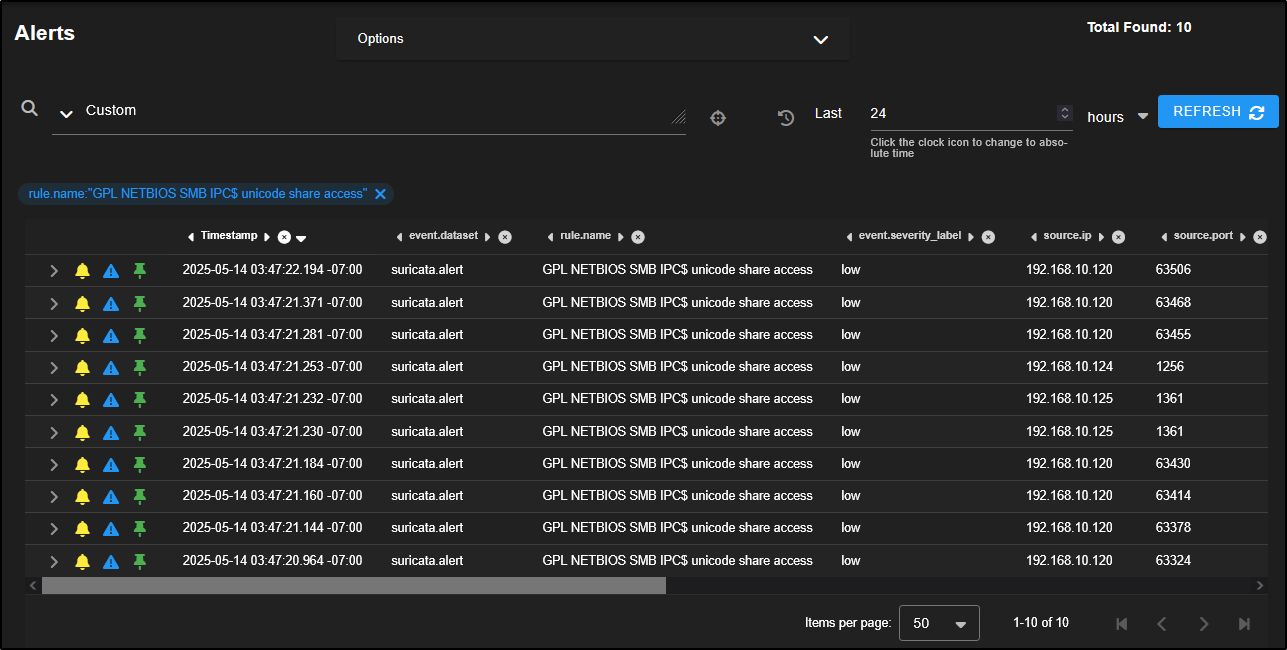
This reveals 10 individual alerts triggered by three different source IPs connecting over SMB to two different destination IPs.
When you see activity like this, it’s worth investigating further to determine whether the traffic is legitimate or potentially malicious.
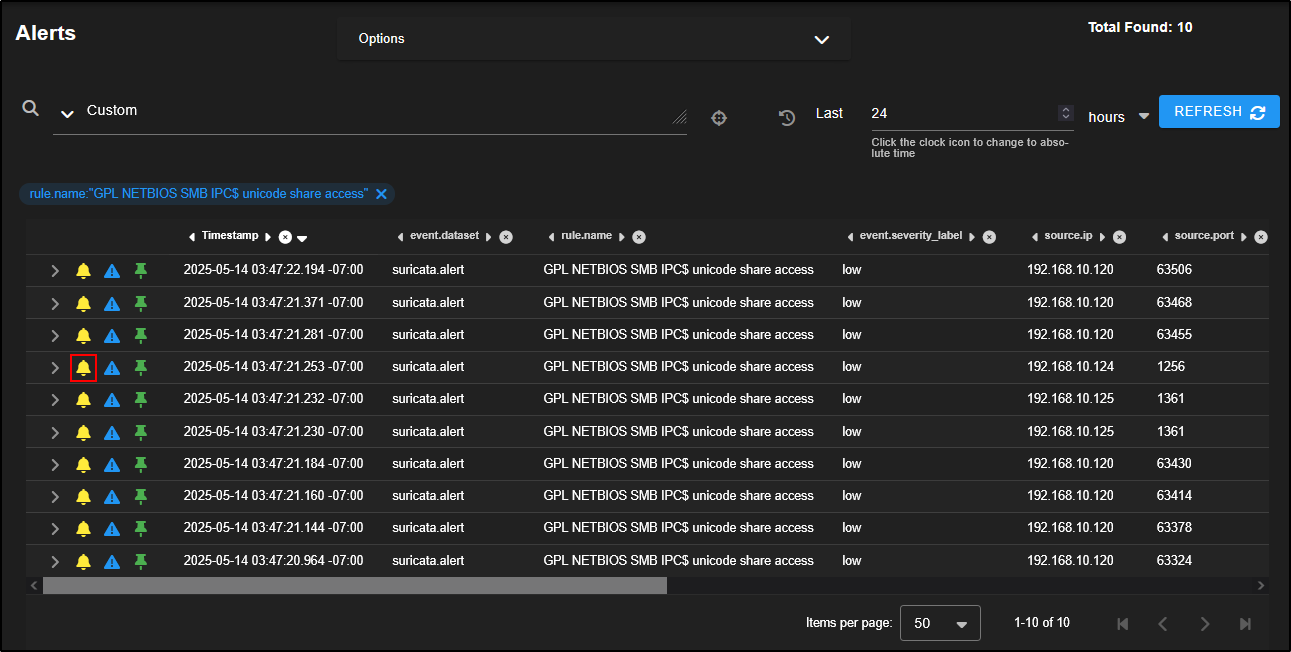
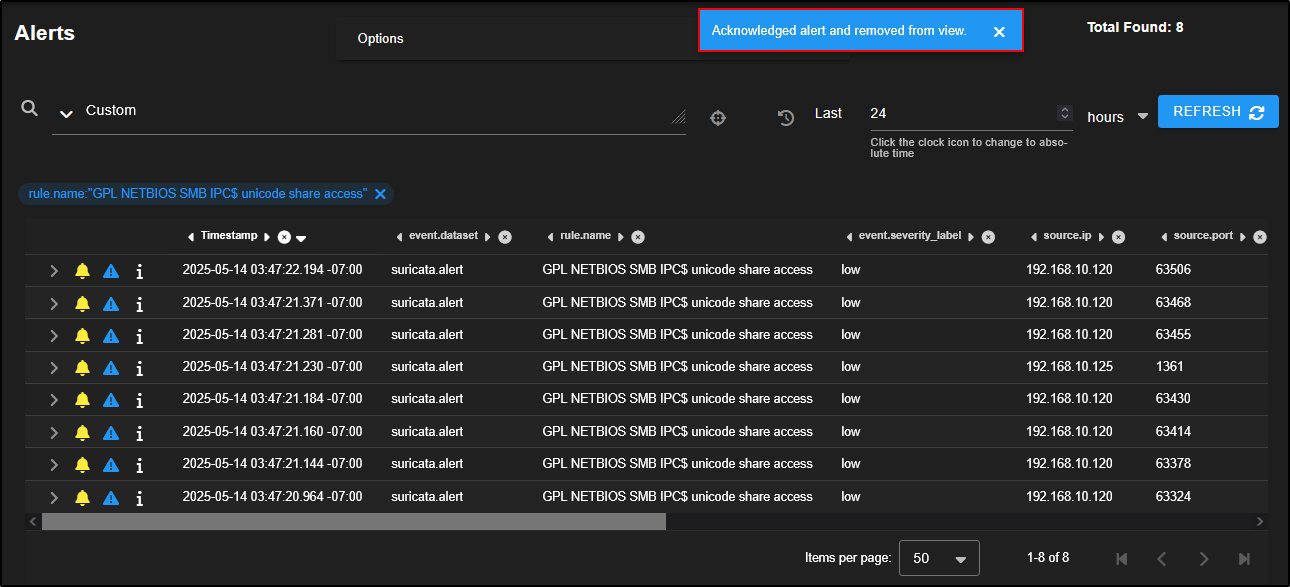
If the traffic is known to be safe (i.e. a false positive), you can make a note of it for future alert tuning, and then acknowledge the alerts by clicking the bell icon.
This will remove the alerts from the main queue but they are not deleted, just marked as reviewed.
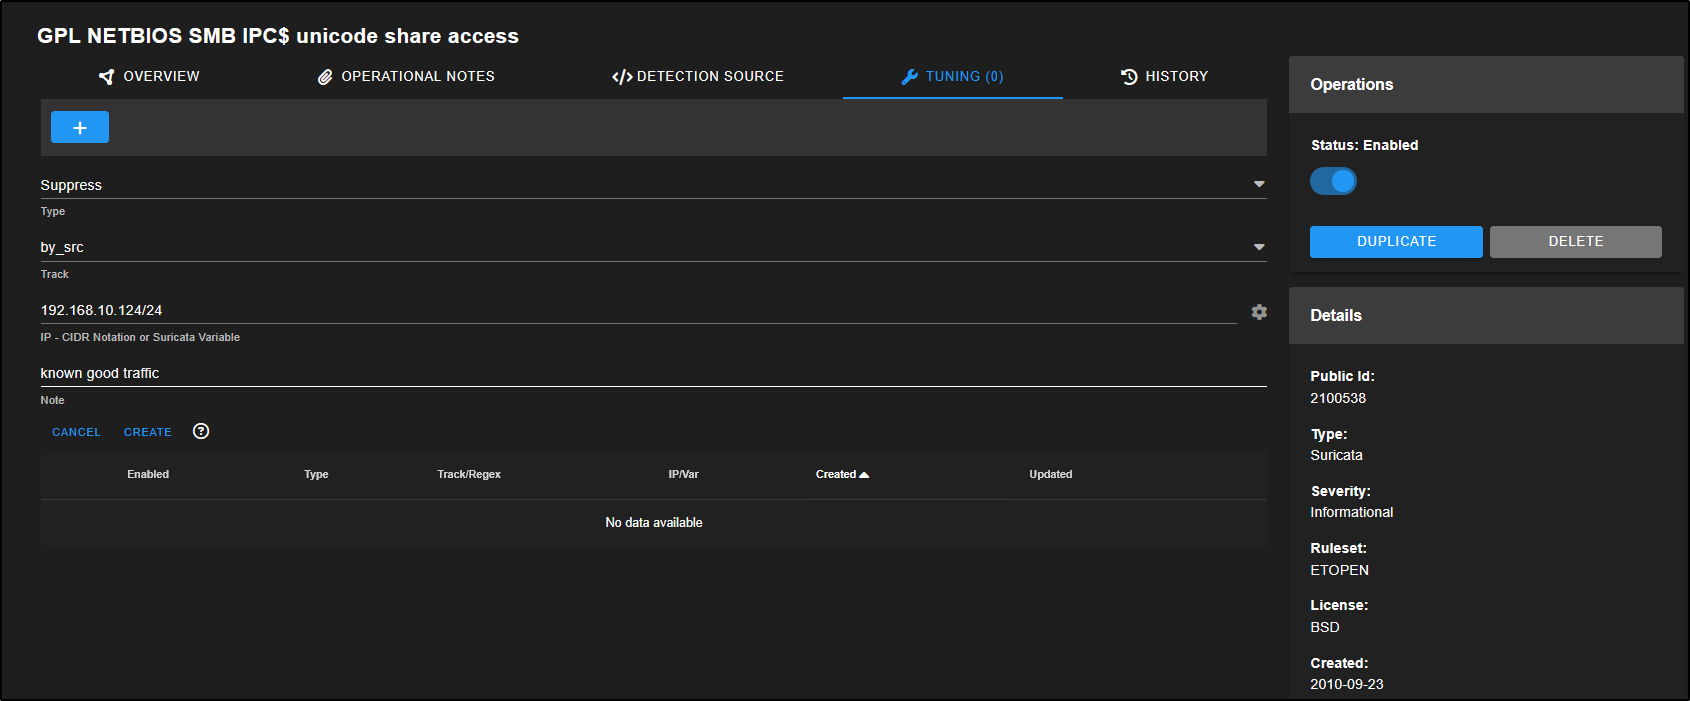
You can also fine-tune how the rule behaves by clicking on the rule name and selecting Tune Detection from the menu.
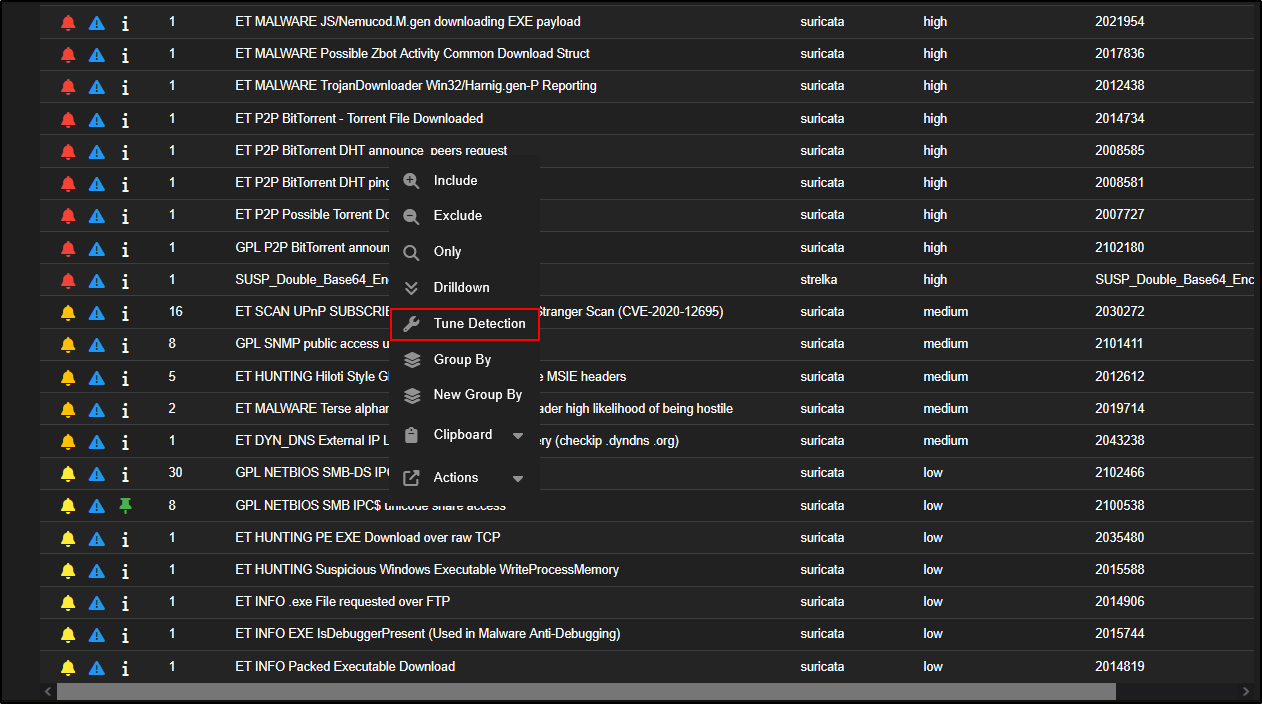
This opens the Tune Detection page, where you can either enable or disable the rule, or adjust it to better fit your environment.
For example, to suppress alerts from a trusted source:
- Click the + icon
- Set Type to Suppress
- Set Track to by_src
- Enter the IP in CIDR format:
192.168.10.124/24 - Add a note like known good traffic
This helps reduce noise from alerts you’ve already verified as safe.
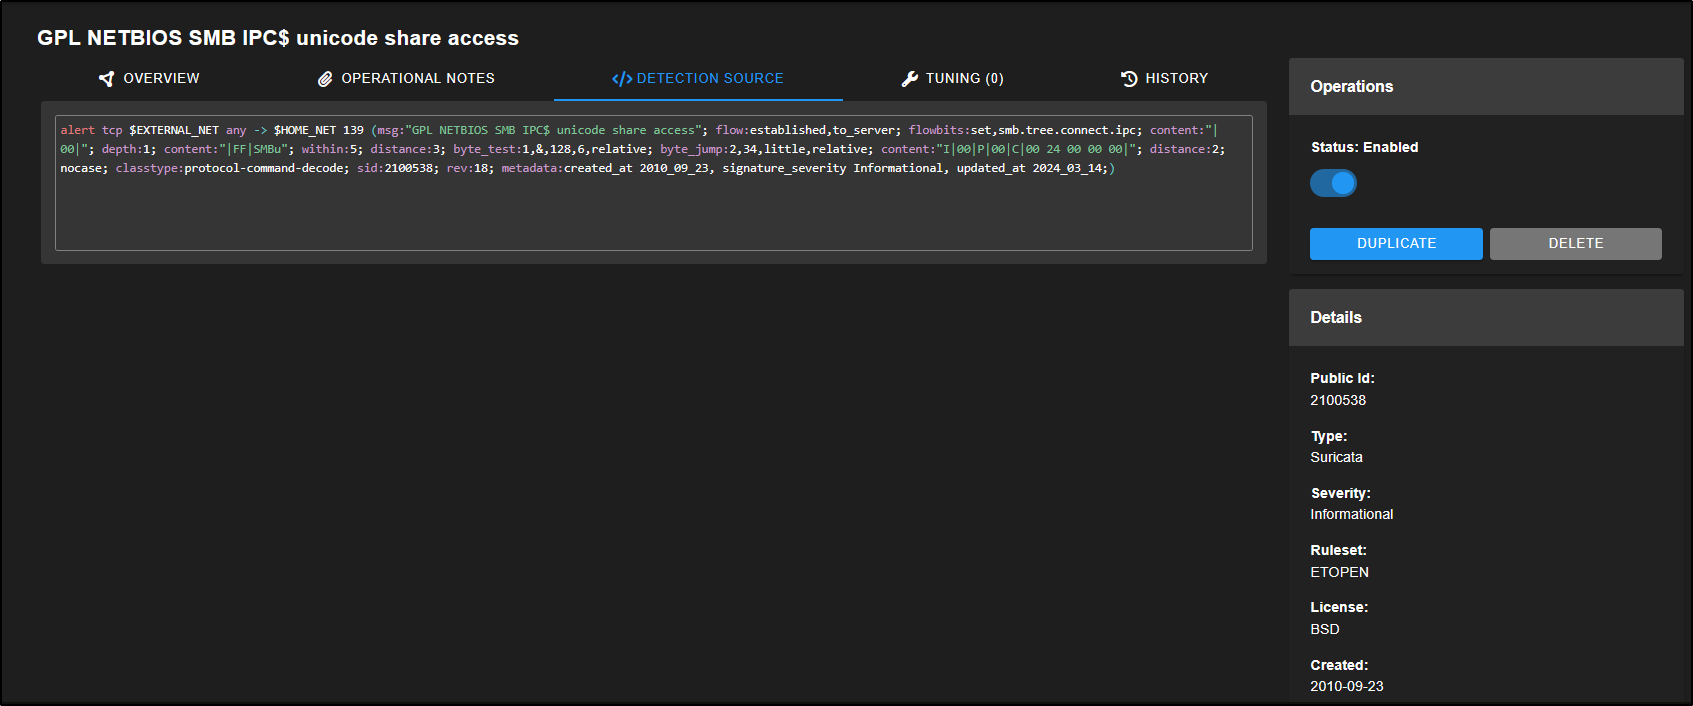
You can also edit the rule directly by going to the Detection Source section. This gives you access to the full rule definition, allowing for more advanced customisation if needed.
To view alerts you’ve previously acknowledged, return to the Alerts tab, click on Options, then select Acknowledged. This will display alerts you have marked as reviewed or false positives.
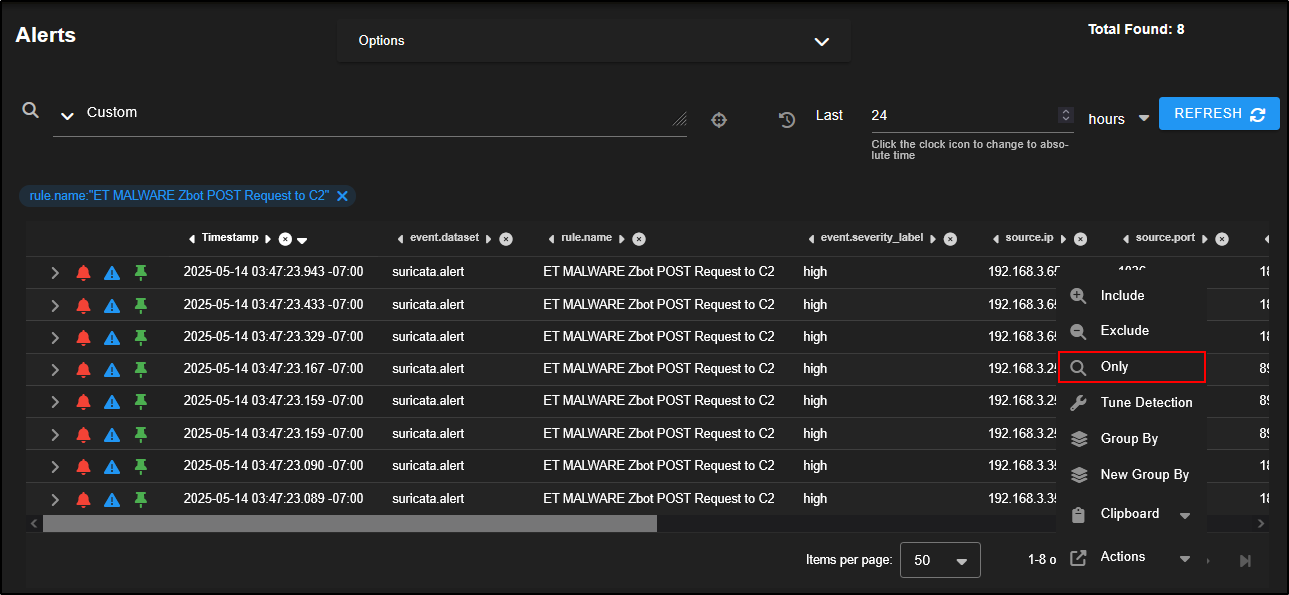
Now let’s focus on alerts that are more likely to indicate real threats. For example, drill down into the rule ET MALWARE Zbot POST Request to C2 to investigate activity that may involve communication with a command-and-control server.
This reveals nine alerts involving three separate source IPs making connections to three different destination IPs over port 80 which is a common port for HTTP traffic. This pattern could suggest coordinated or suspicious activity worth further investigation.
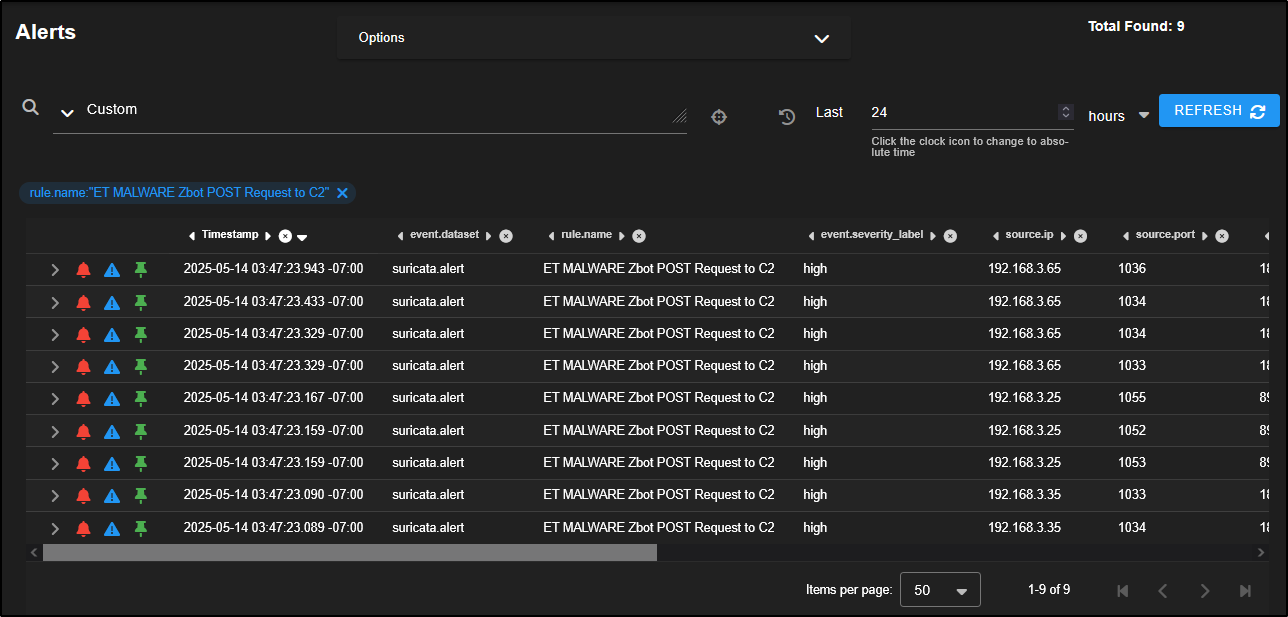
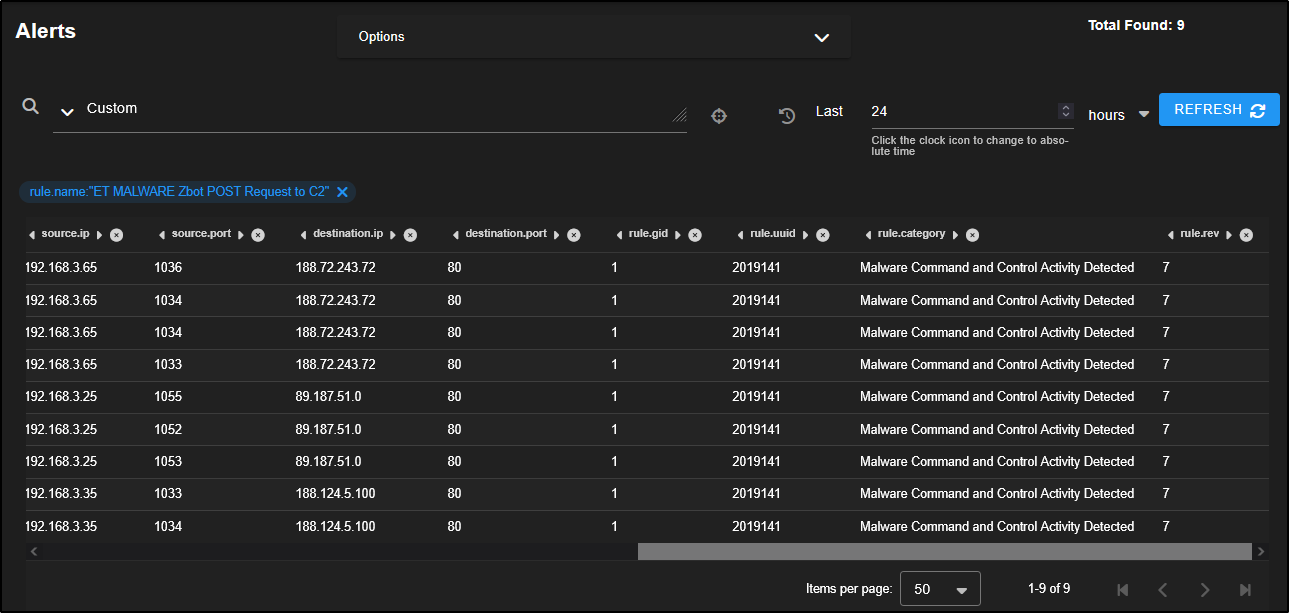
You can click to expand an individual alert for a closer look.
If you scroll down to the Suricata rule section (rule.rule), you will see that this alert is triggered by HTTP traffic flowing from your internal network to an external server. The rule is checking for specific HTTP headers within an established connection which is a common indicator of command-and-control activity or data exfiltration.
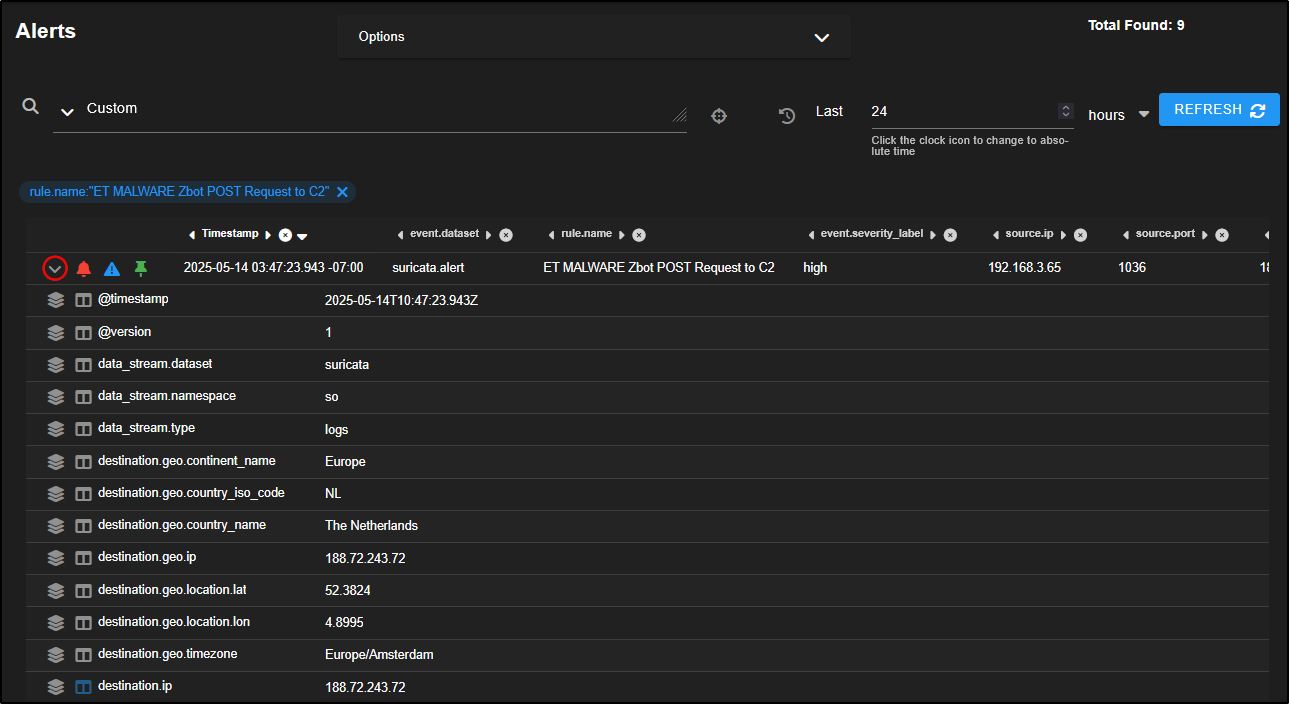
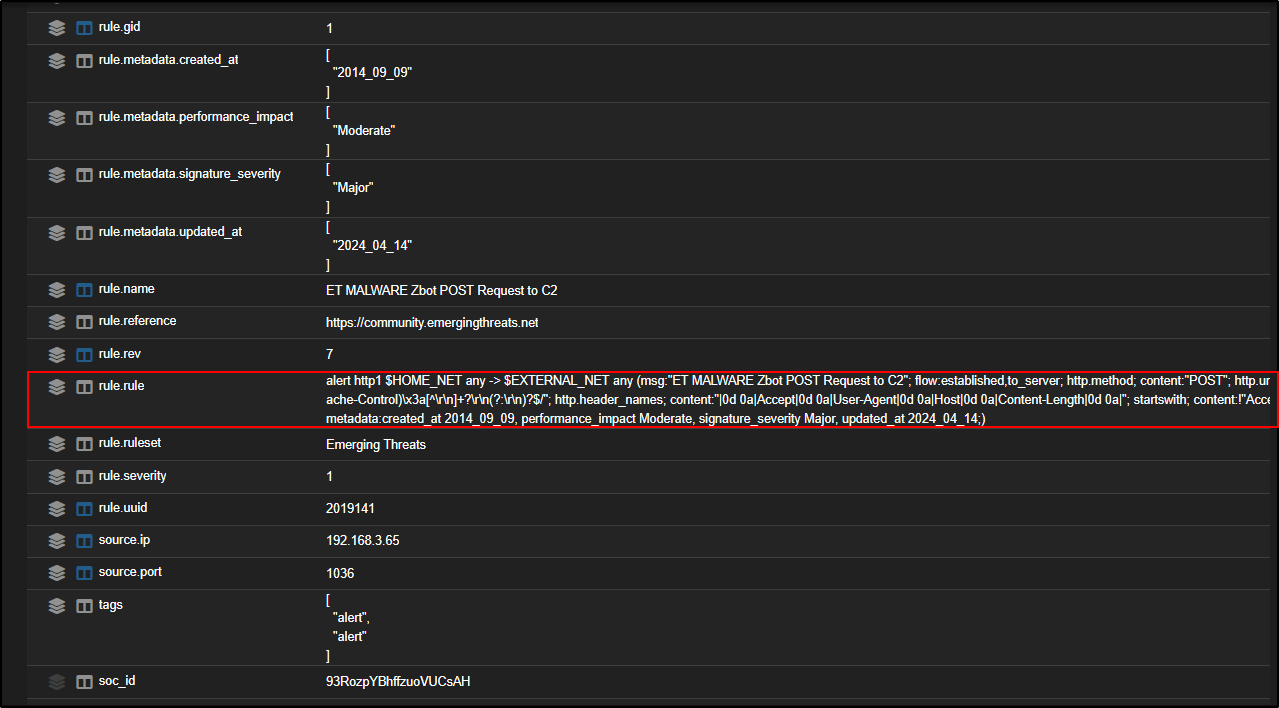
If you scroll up to the network.data.decoded section, you will see the client is making a POST request to a PHP page, using MSIE 6.0 as the User-Agent which is an outdated browser version often associated with malicious traffic.
The destination host is ishi-bati.com, which appears suspicious and may warrant further investigation.
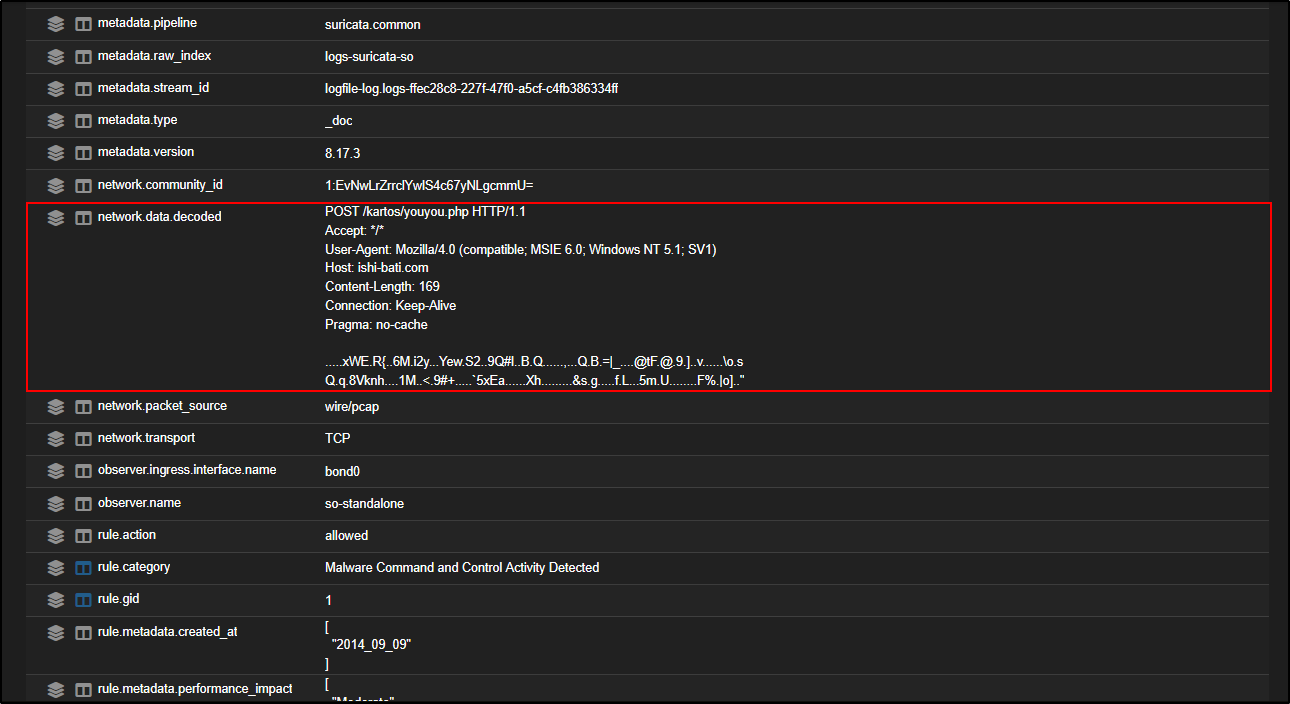
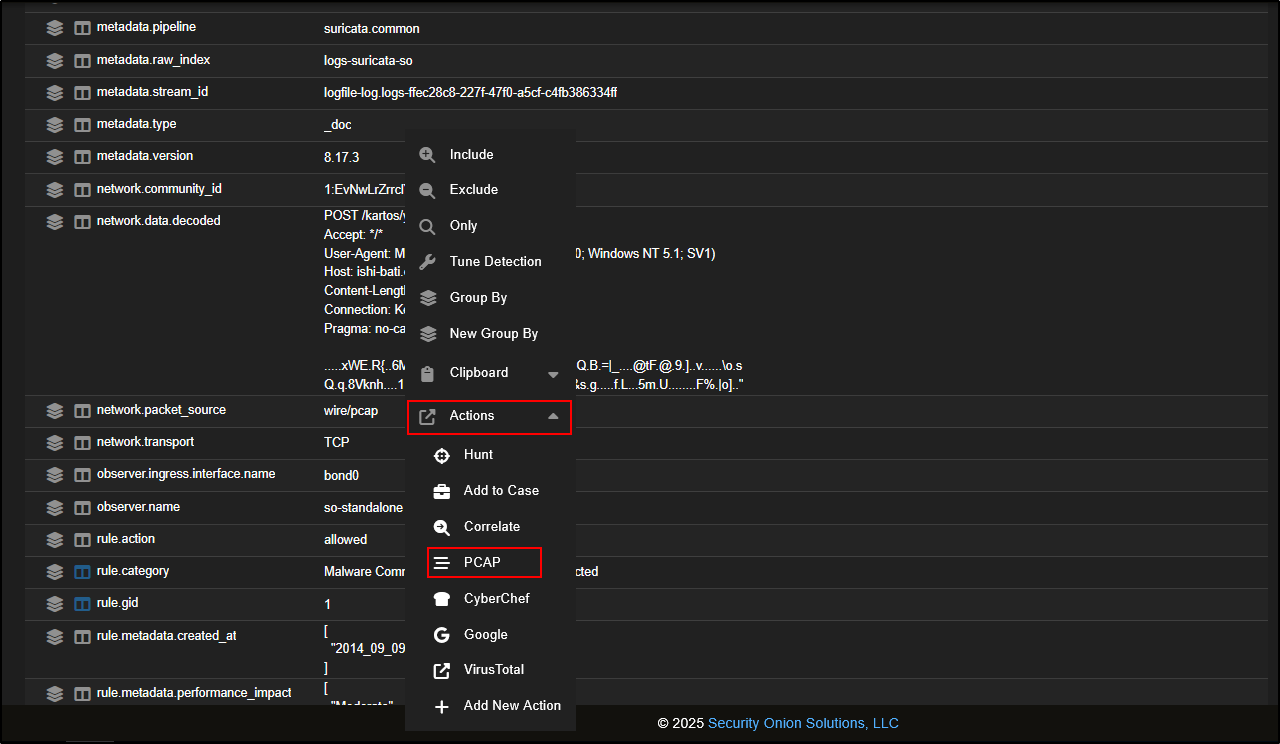
To get more context on the alert, you can pivot into a packet capture (PCAP) from any relevant field.
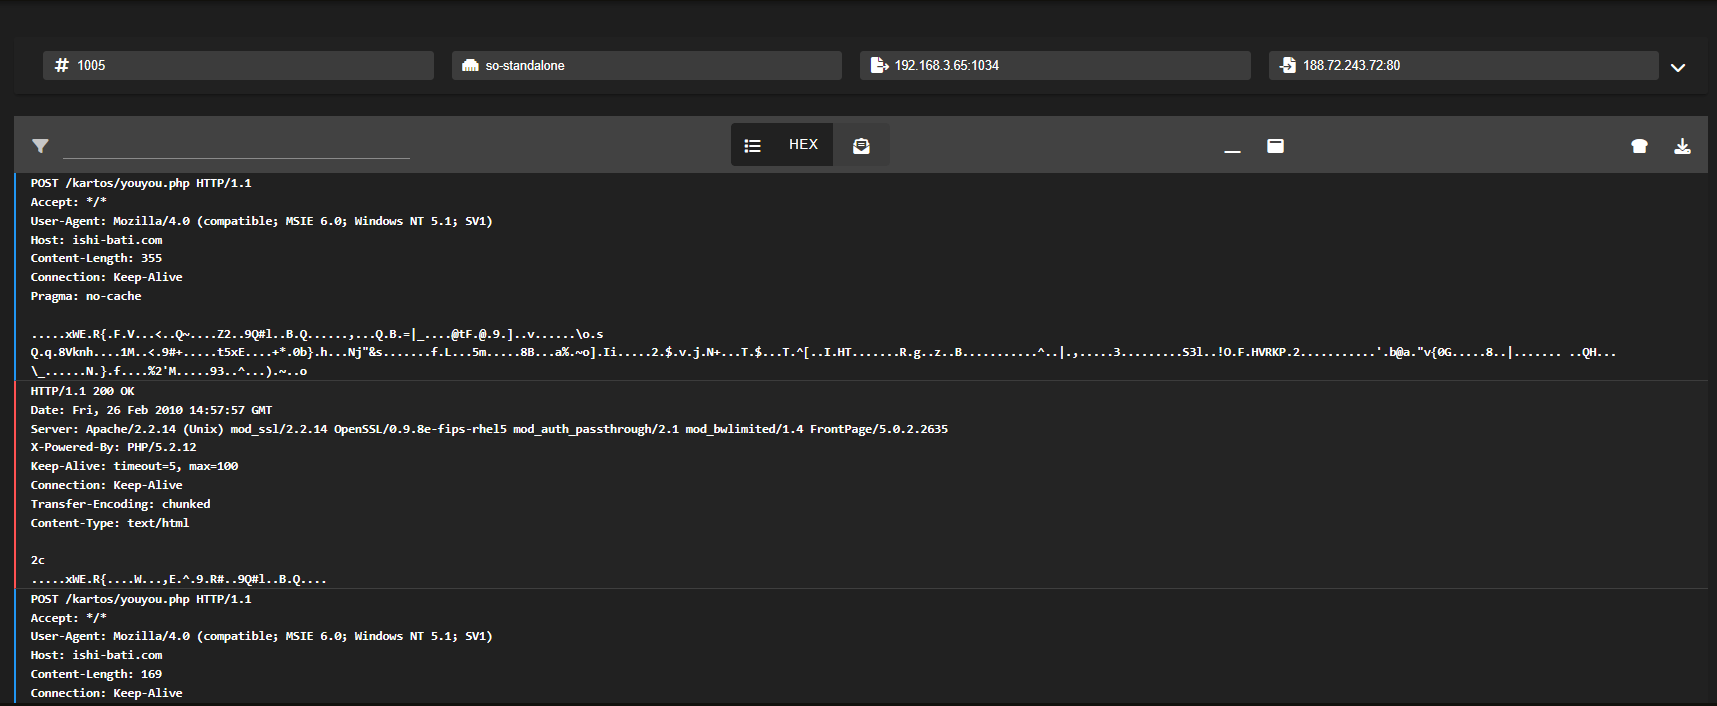
For example, click on network.data.decoded, then go to Actions → PCAP. This will open the full packet capture related to the alert, letting you analyse the actual network traffic involved.
Reviewing the PCAP, we can see a clear connection between the internal host and an external web server, with what appears to be encoded data being exchanged.
This kind of traffic is unusual and could indicate command-and-control (C2) communication. This definitely looks like something that needs more investigation.
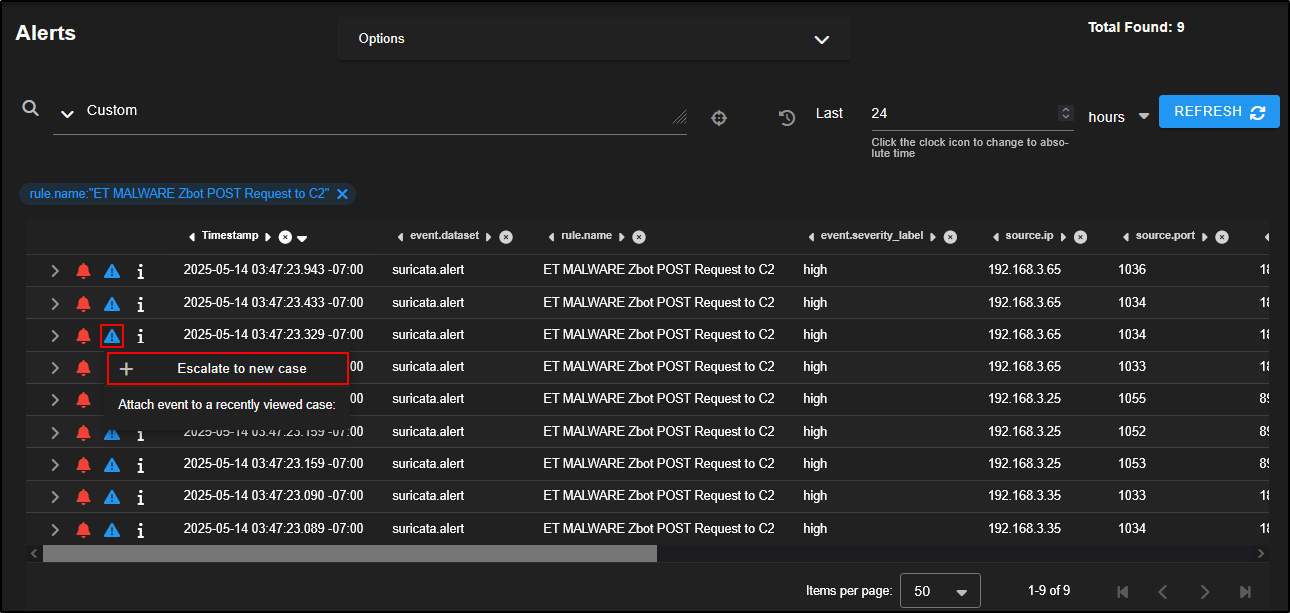
Head back to the Alerts tab, locate the alert, select it, and then click the triangle icon to escalate it to a new case. This begins formal tracking of your investigation within the SOC’s case management system.
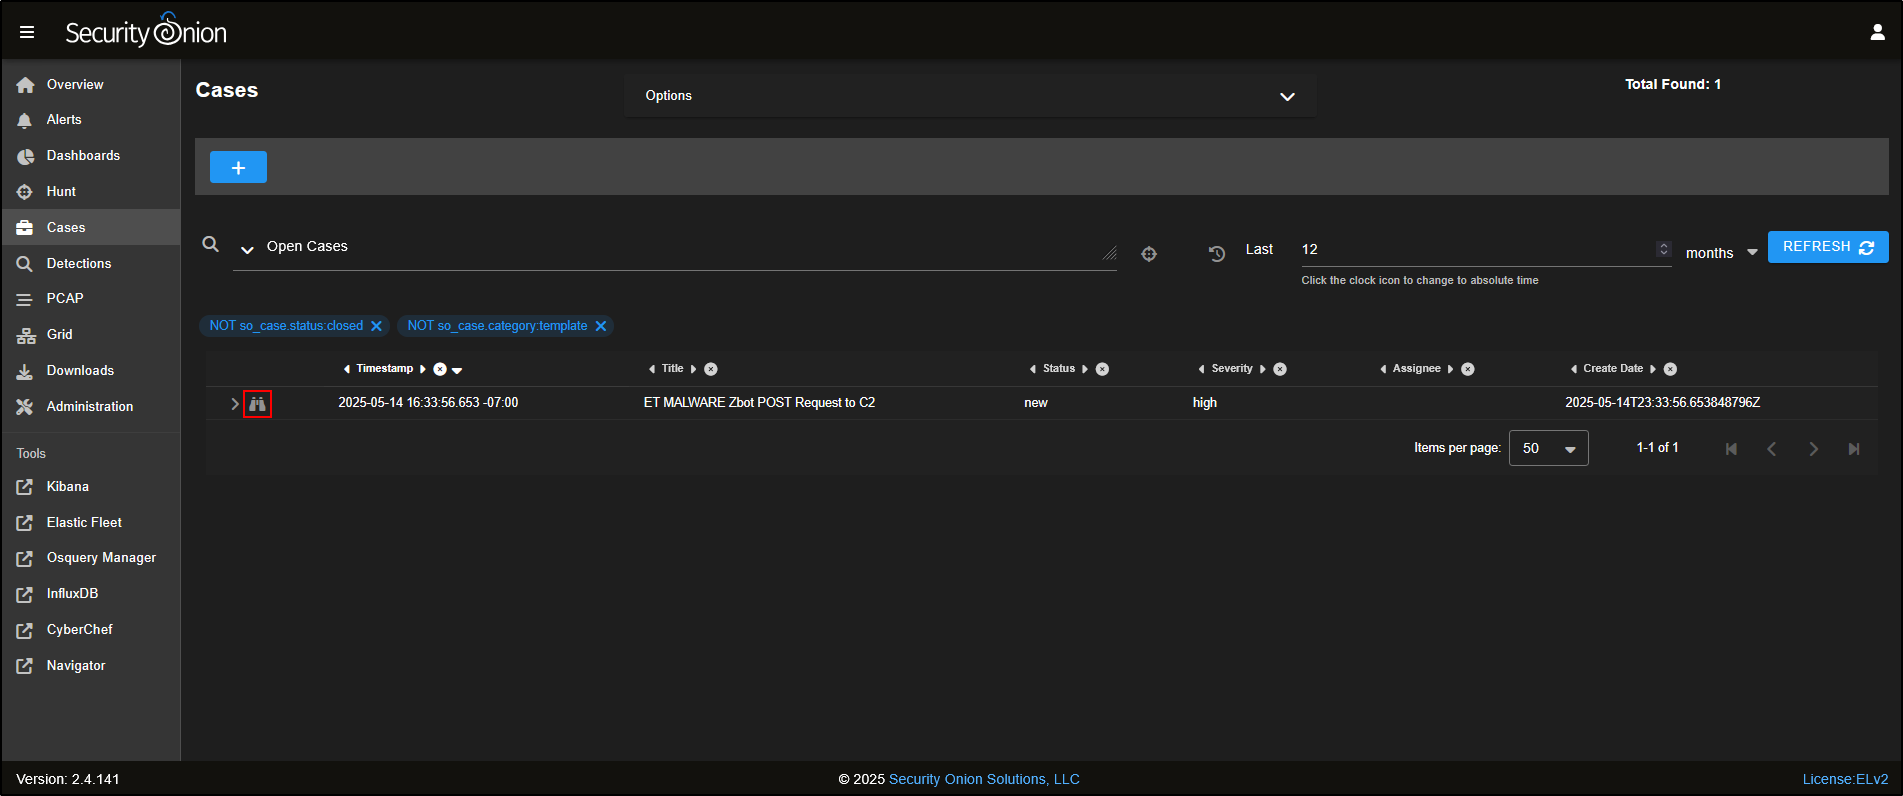
Go to the Cases tab in the SOC web interface. You will see a new case has been created, named after the alert you escalated.
This case acts as a central place to track your investigation, record notes, and link to other evidence found during your threat hunting.
Click the binoculars icon to open the case and view its details.
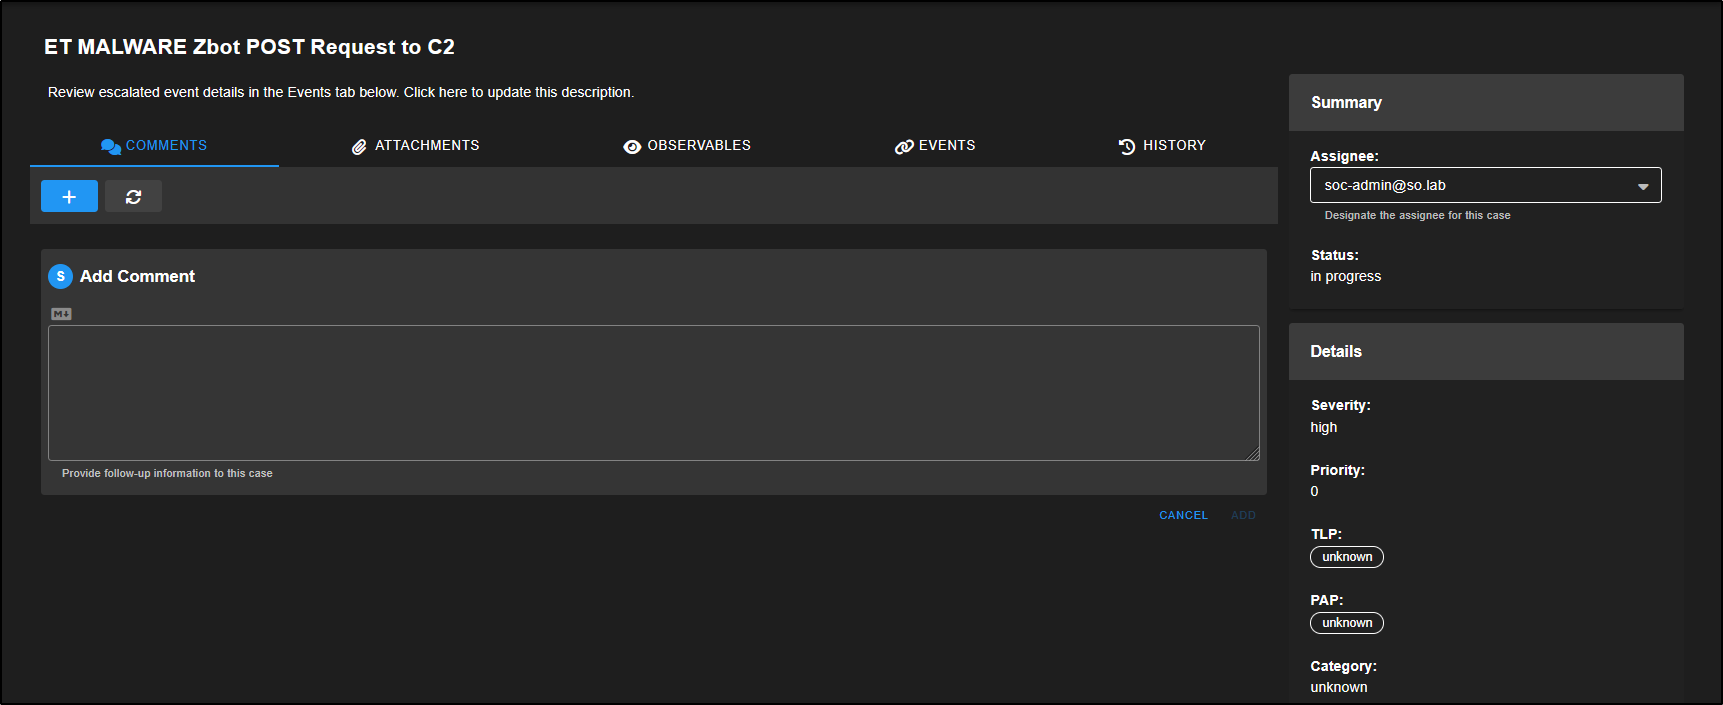
On the right-hand side of the case view, you will find metadata fields to help manage the investigation.
If you are working in a team, use the Assignee drop-down to allocate the case to a specific analyst. Change the Status from New to In Progress to reflect that the investigation has started.
You can also set the case’s Severity and Priority, apply a TLP (Traffic Light Protocol) or PAP (Permissible Action Protocol) level for information sharing, and use Category and Tags to group related cases or highlight key findings.
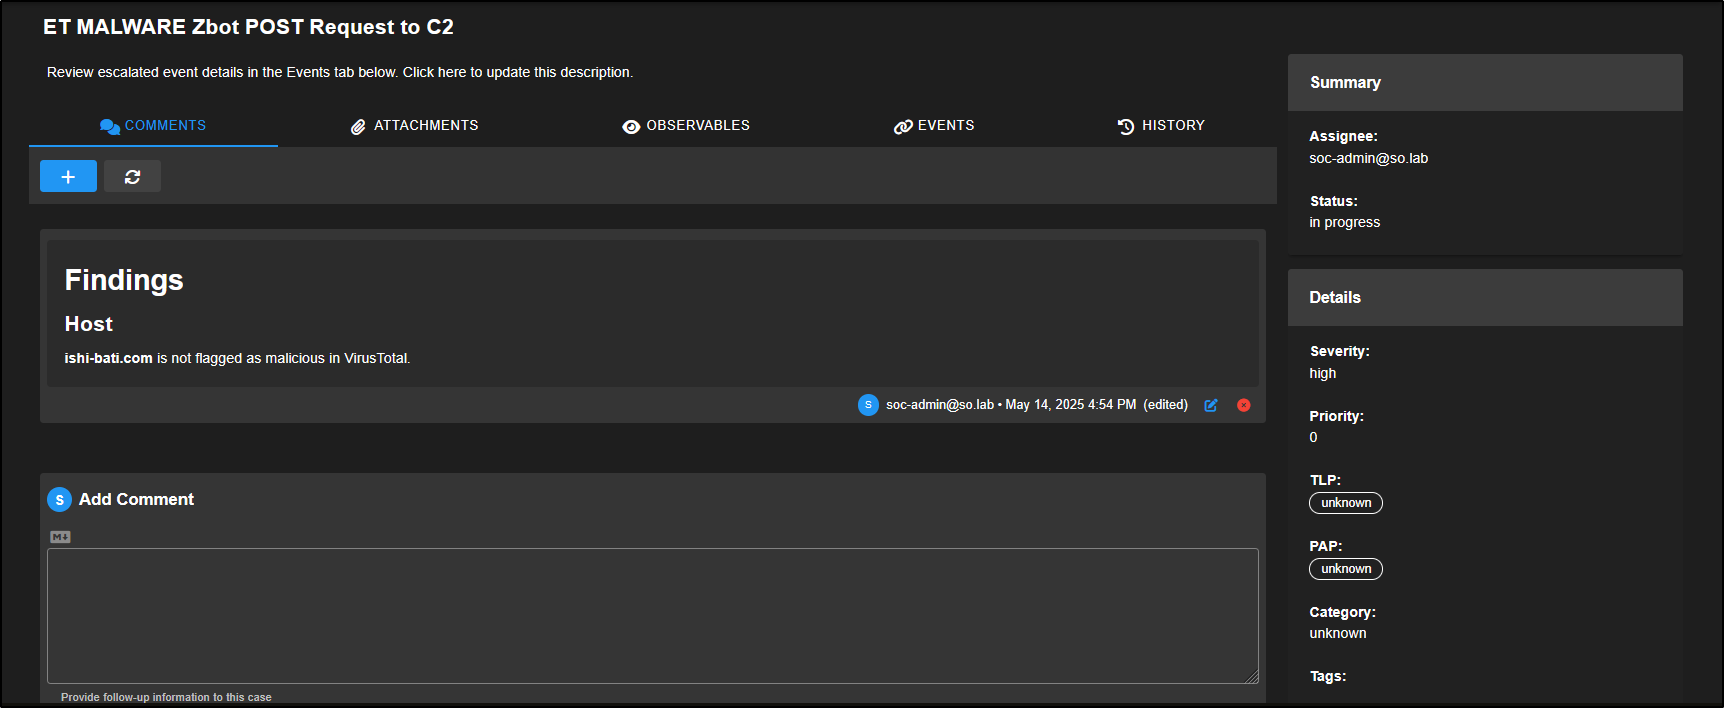
At the top of the case window, you will see several tabs. The Comments tab lets you add notes using Markdown formatting. Each comment is automatically tagged with the author’s username and a timestamp.
For example, you might add the following note:
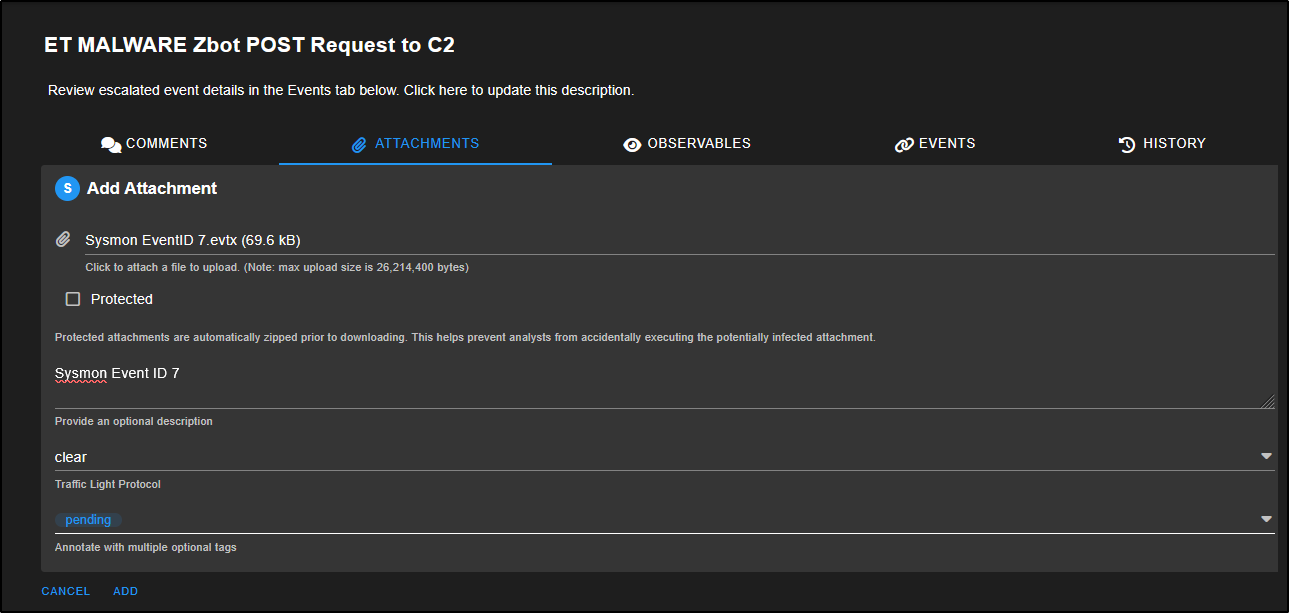
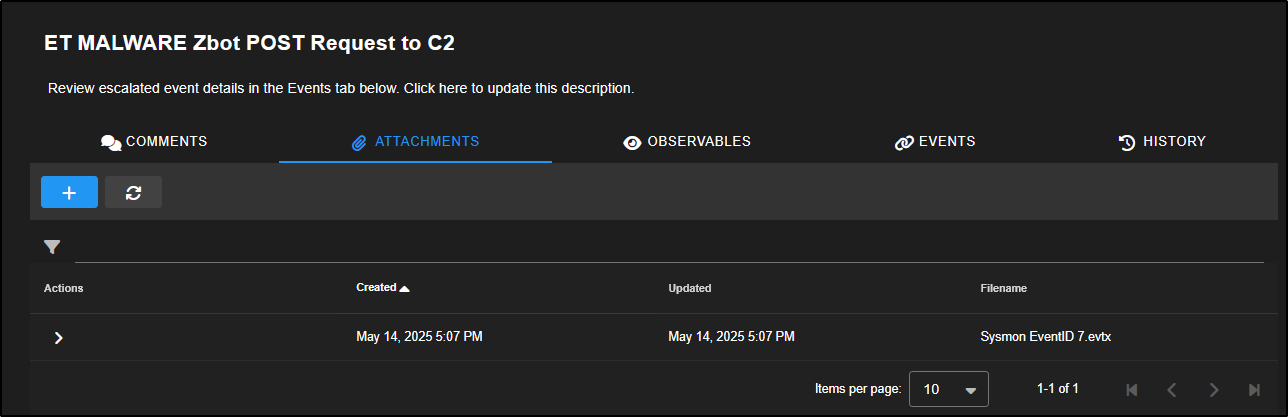
The Attachments tab lets you upload files or artefacts related to the investigation. For instance, you can attach relevant Sysmon logs, Windows Event Logs (EVTX files), or any other evidence that supports your analysis of the alert.
Observables are specific indicators such as IP addresses, hashes, or domains that you identify during an investigation.
In Security Onion, some observables like source and destination IPs are automatically extracted from alerts and added to the case for easier tracking and correlation.
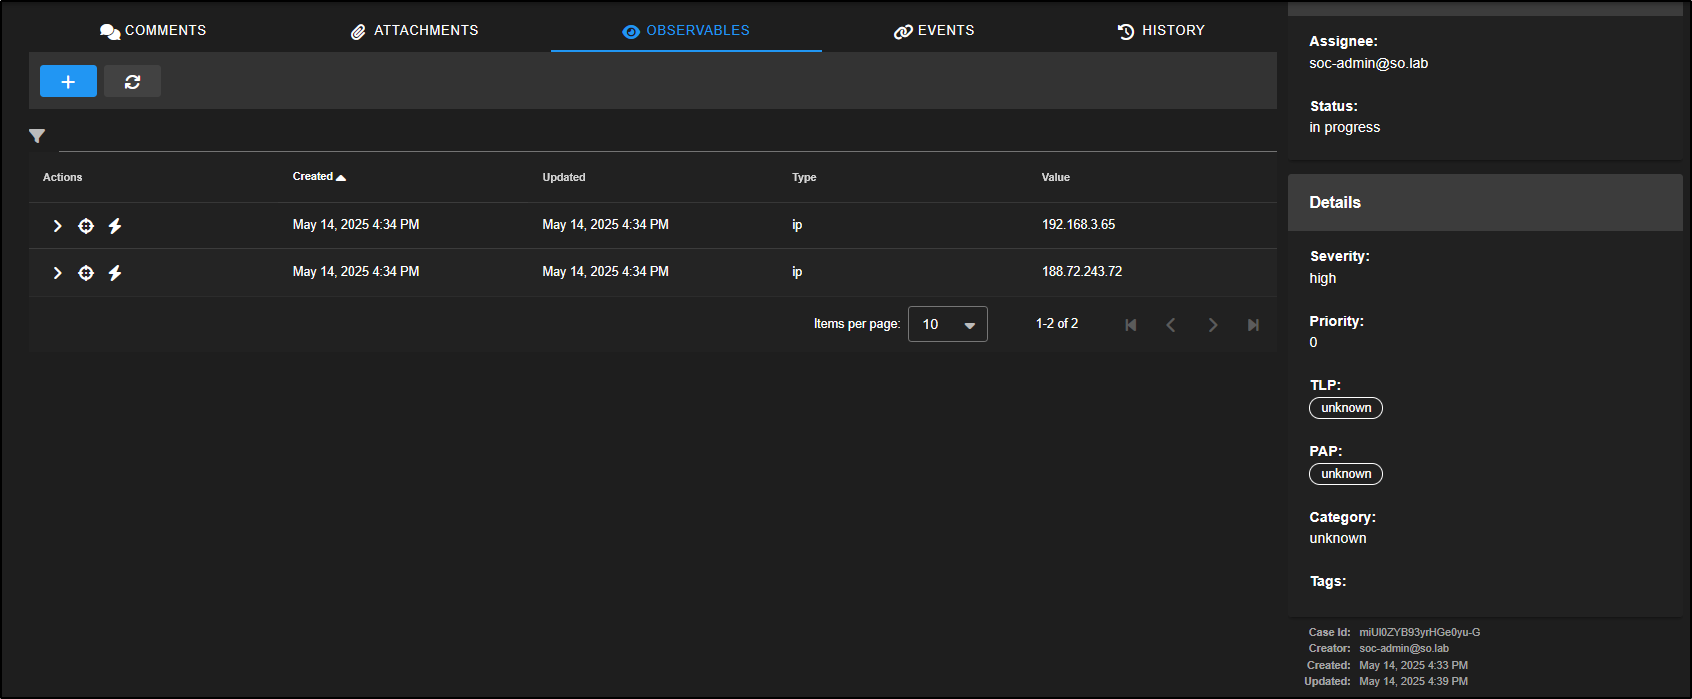
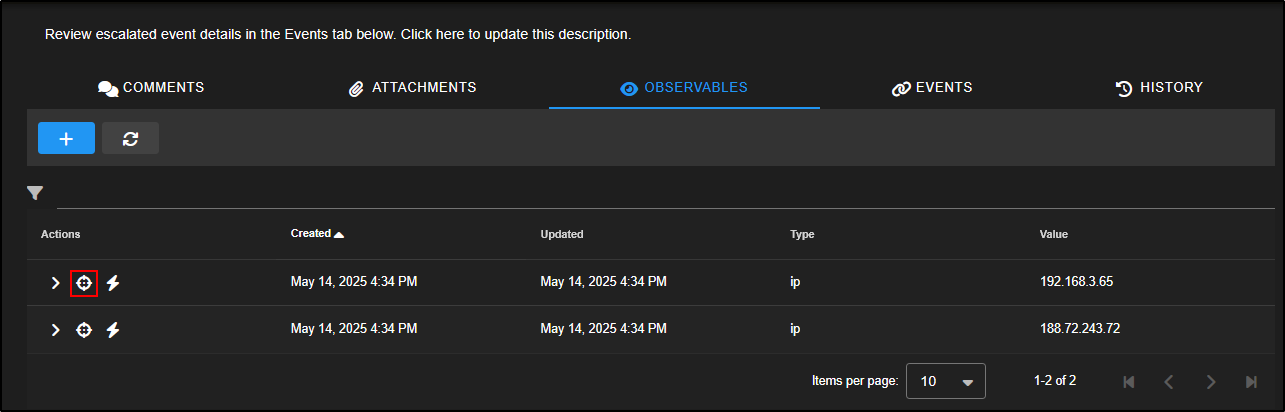
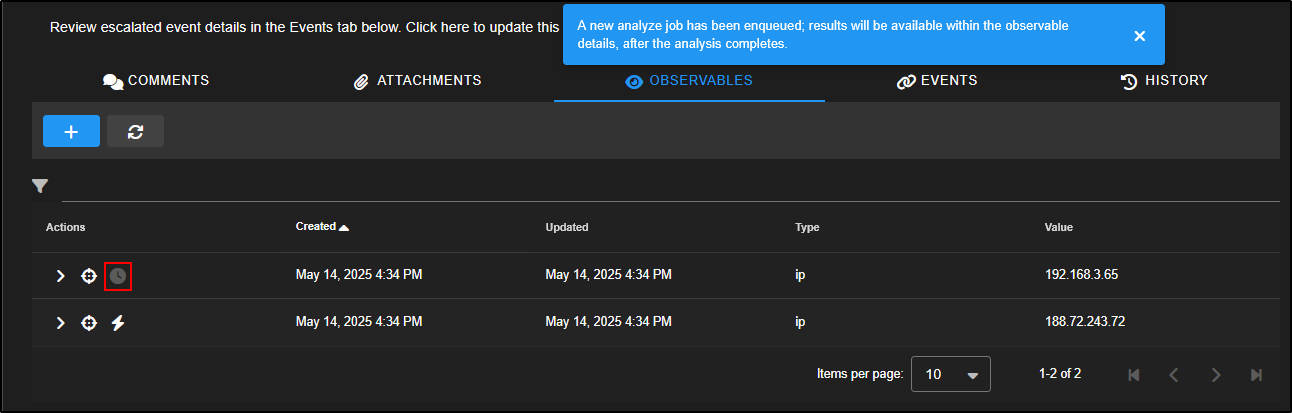
Under the Actions column for each observable, you will find a few icons.
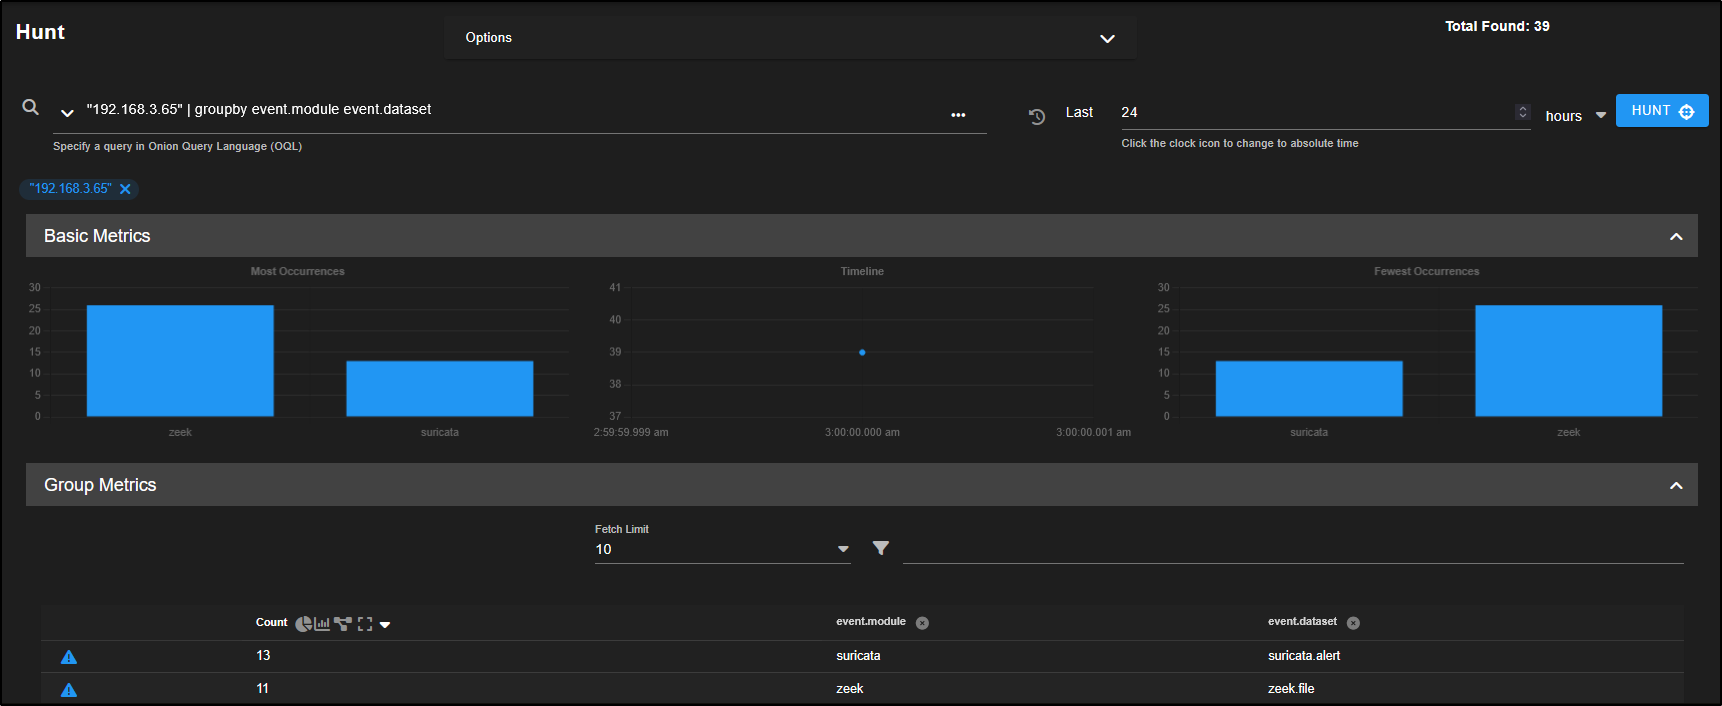
Clicking the crosshair icon will launch a new Hunt session focused on that specific observable. For example, selecting the crosshair next to the first entry will open a hunt centred around the IP address 192.168.3.65, allowing you to dig deeper into related activity.
The lightning bolt icon runs any analysers you have set up for that type of data.
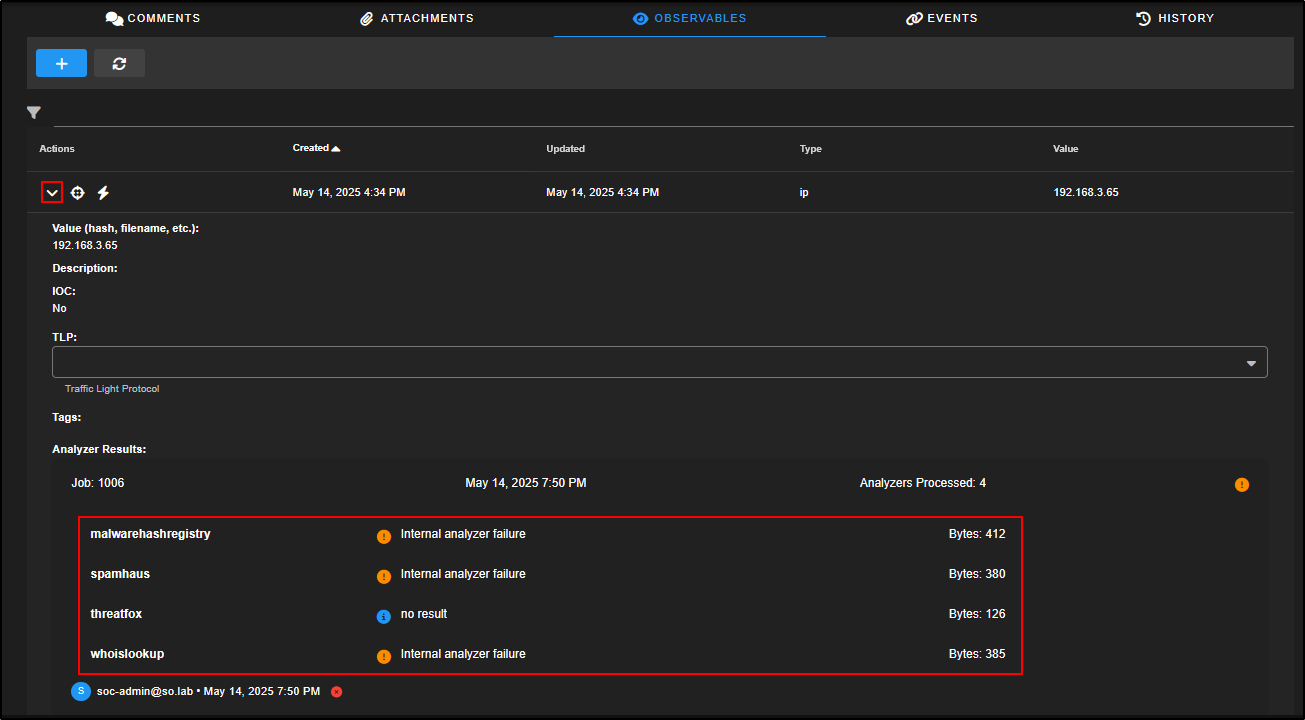
For example, clicking the lightning bolt next to the first observable will trigger analysis on that item. You can then expand the observable to view the results.
Note: This feature requires internal analysers to be properly configured in your Security Onion setup.
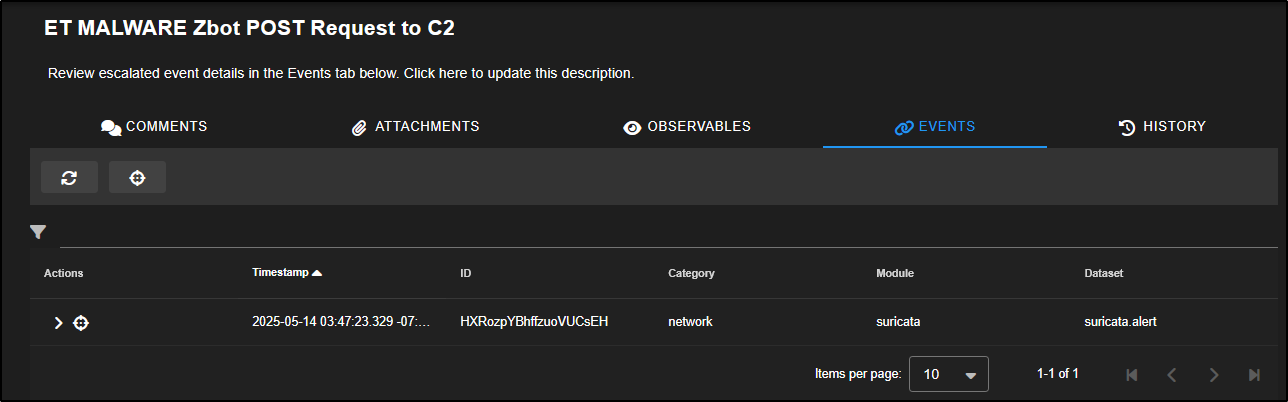
The Events tab displays all events that have been escalated and formally linked to the case. This helps you keep track of the specific alerts and logs you are investigating as part of that case.
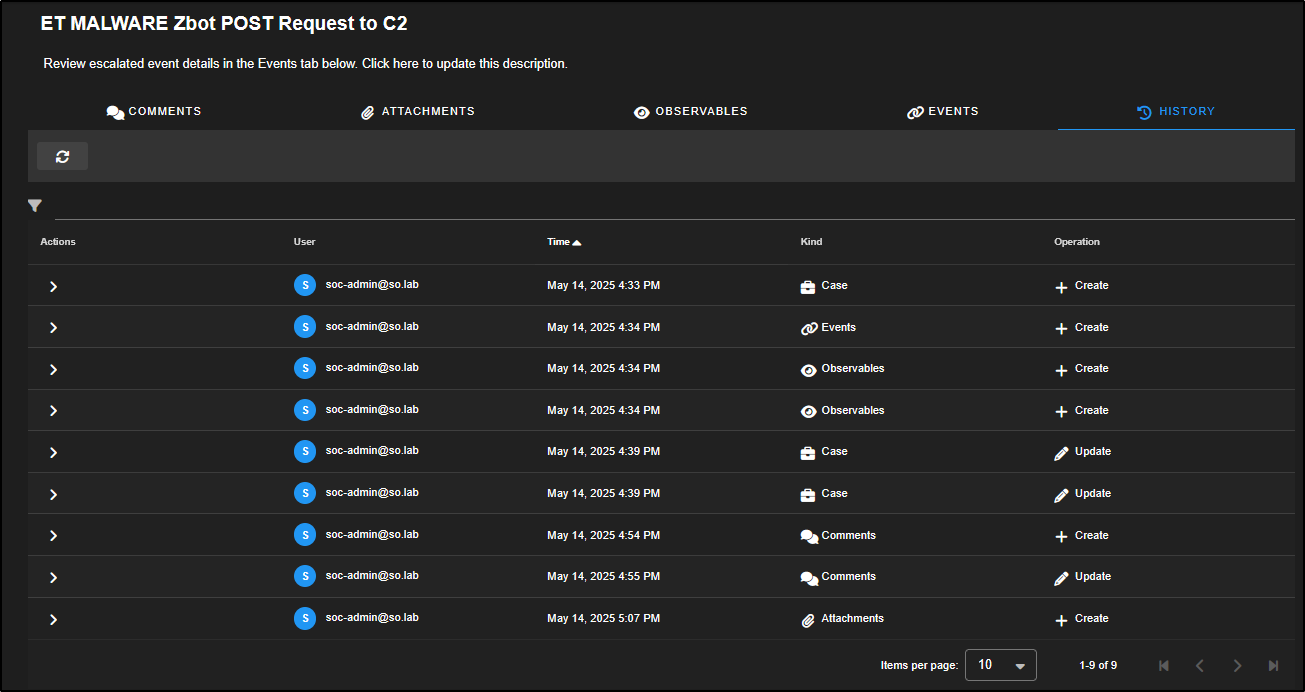
The History tab acts as an audit log for the case. It records every action taken such as items being added, changed, or deleted along with the username of the person who made the change and a timestamp for accountability.
Let’s revisit the ET MALWARE Zbot POST Request to C2 alerts and narrow our focus to a specific host.
Click on the source IP 192.168.3.65 and select Only. This will filter the alerts to show only those involving that IP address, helping us investigate its activity in more detail.
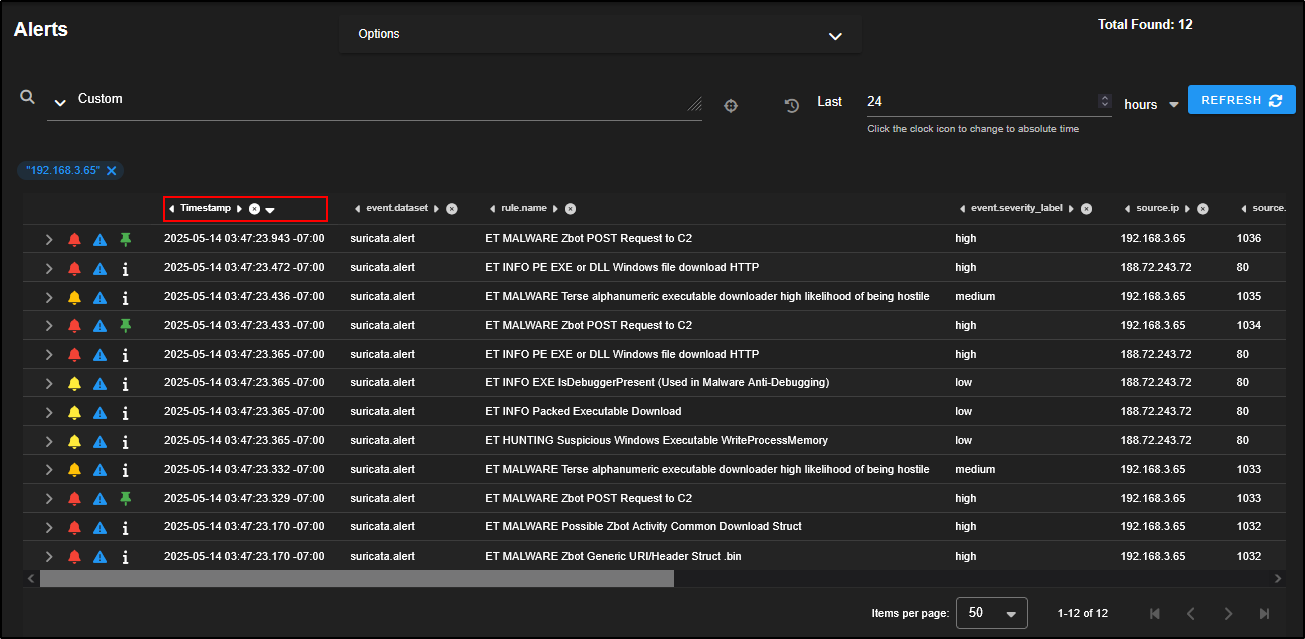
Click on the Timestamp column to sort the alerts chronologically.
From the timeline, it appears there was Zbot download activity, followed by a C2 POST request, and then an EXE file download over HTTP. This ****sequence strongly suggests malware infection and command-and-control behaviour.
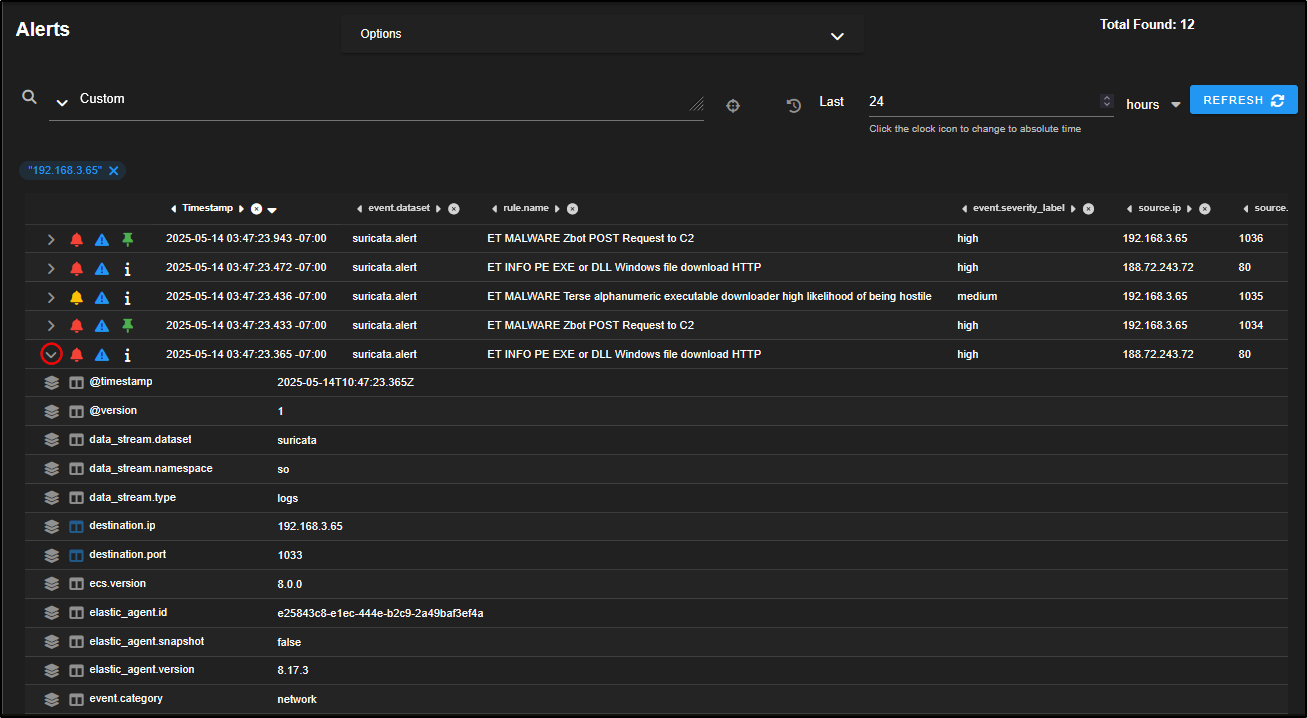
Expand the alert titled ET INFO PE EXE or DLL Windows file download HTTP to view the full details.
This rule is triggered when a Windows executable (.exe) or DLL file is downloaded over HTTP, which is often a red flag especially when it happens outside normal software update mechanisms.
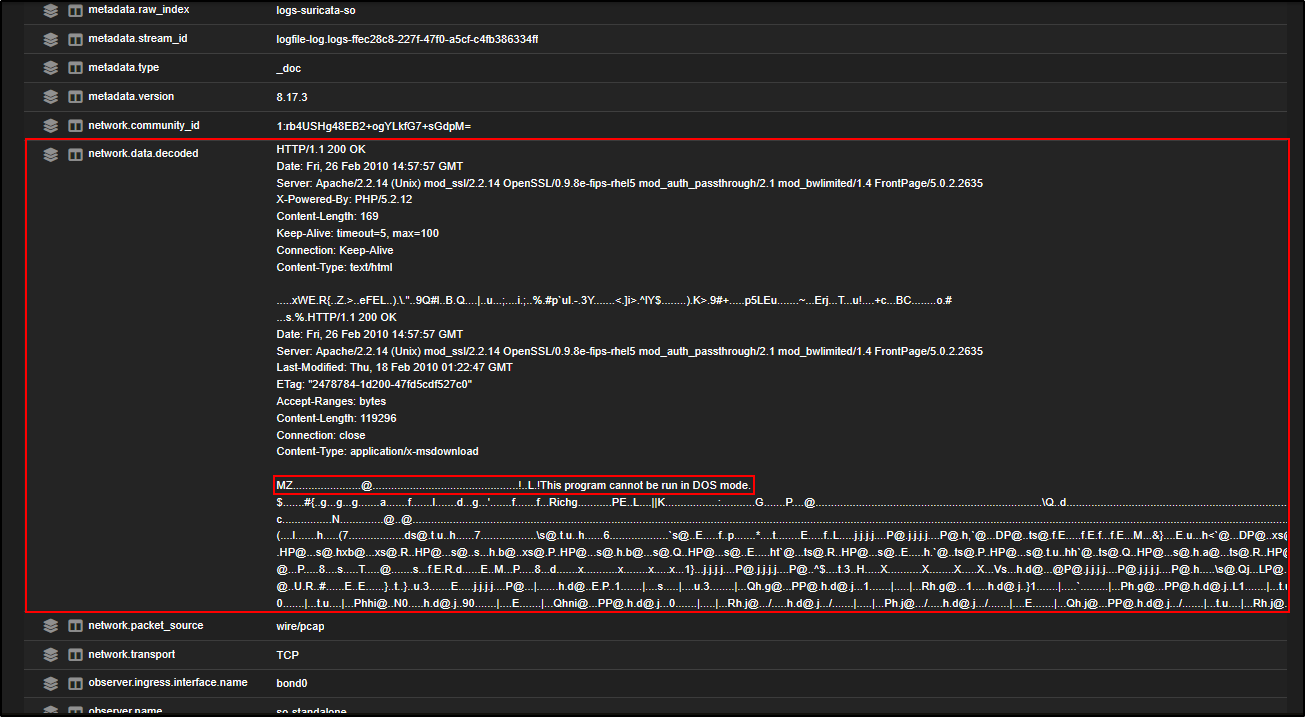
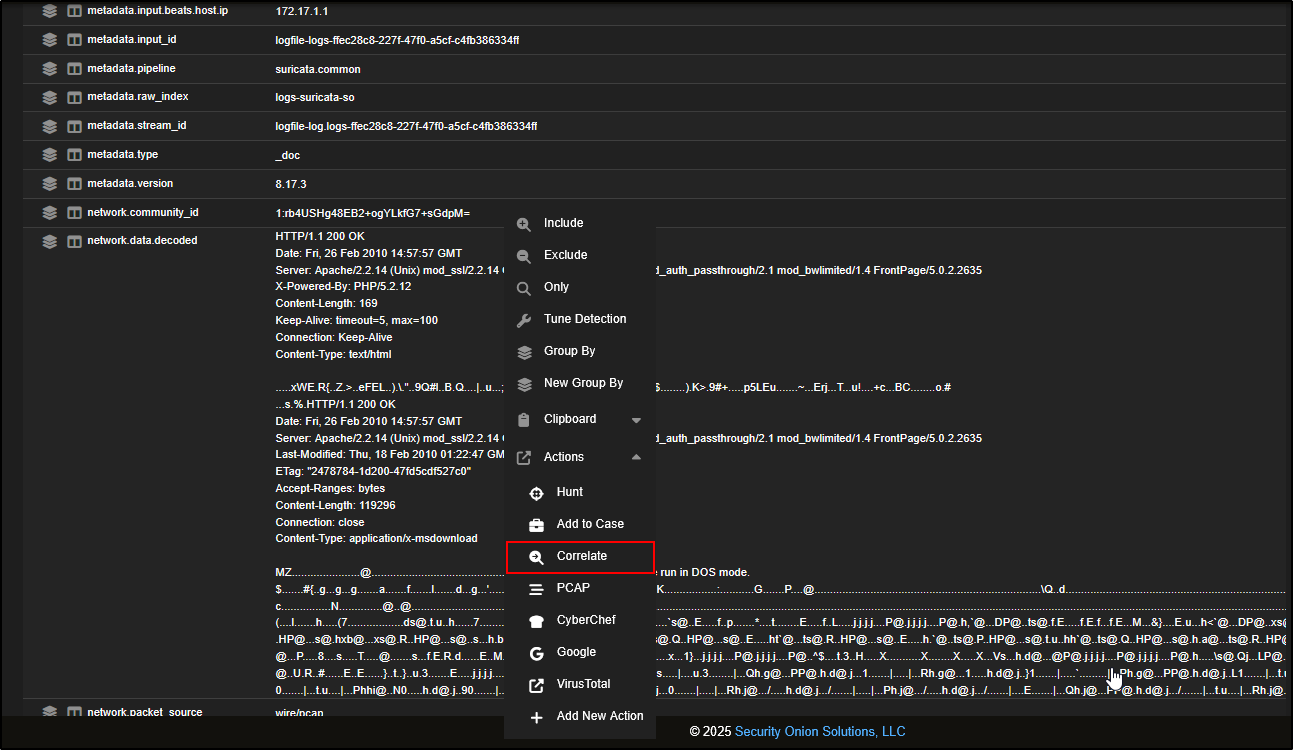
Scrolling down to the network.data.decoded field, we can see clear signs that a Windows executable is being downloaded. The presence of the MZ header and the string “This program cannot be run in DOS mode” are strong indicators of a PE (Portable Executable) file.
This confirms that a .exe file was likely transferred over HTTP.
To view all logs associated with this specific network flow, you can pivot using the community_id which is a unique hash that Security Onion assigns to each flow, based on the source/destination IPs, ports, and protocol (e.g. TCP or UDP). This makes it easy to group and investigate related activity across different log types.
Click on network.data.decoded, then choose Correlate. This will open a Hunt view showing all logs linked to that same network flow.
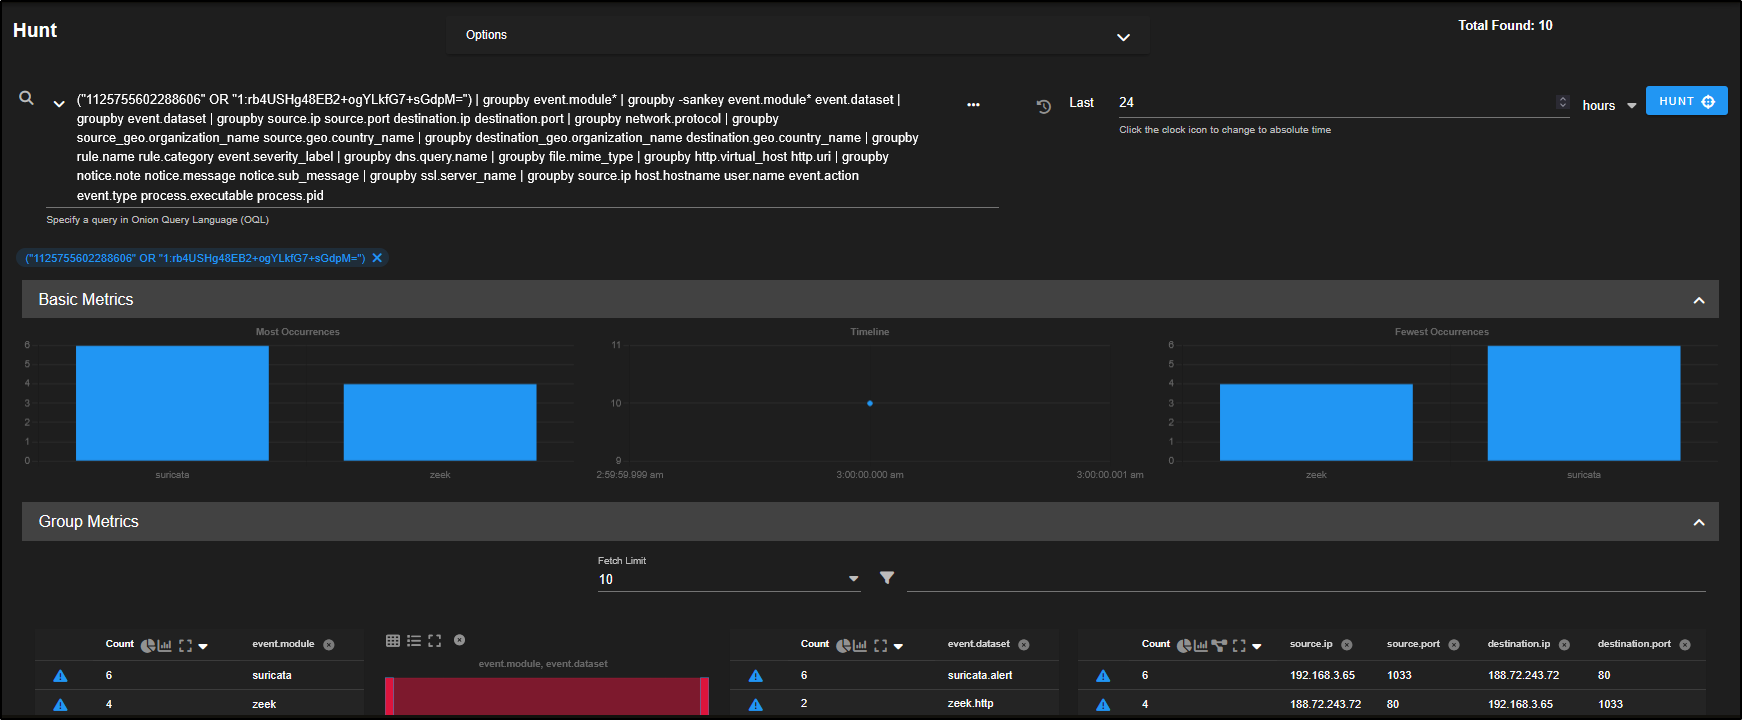
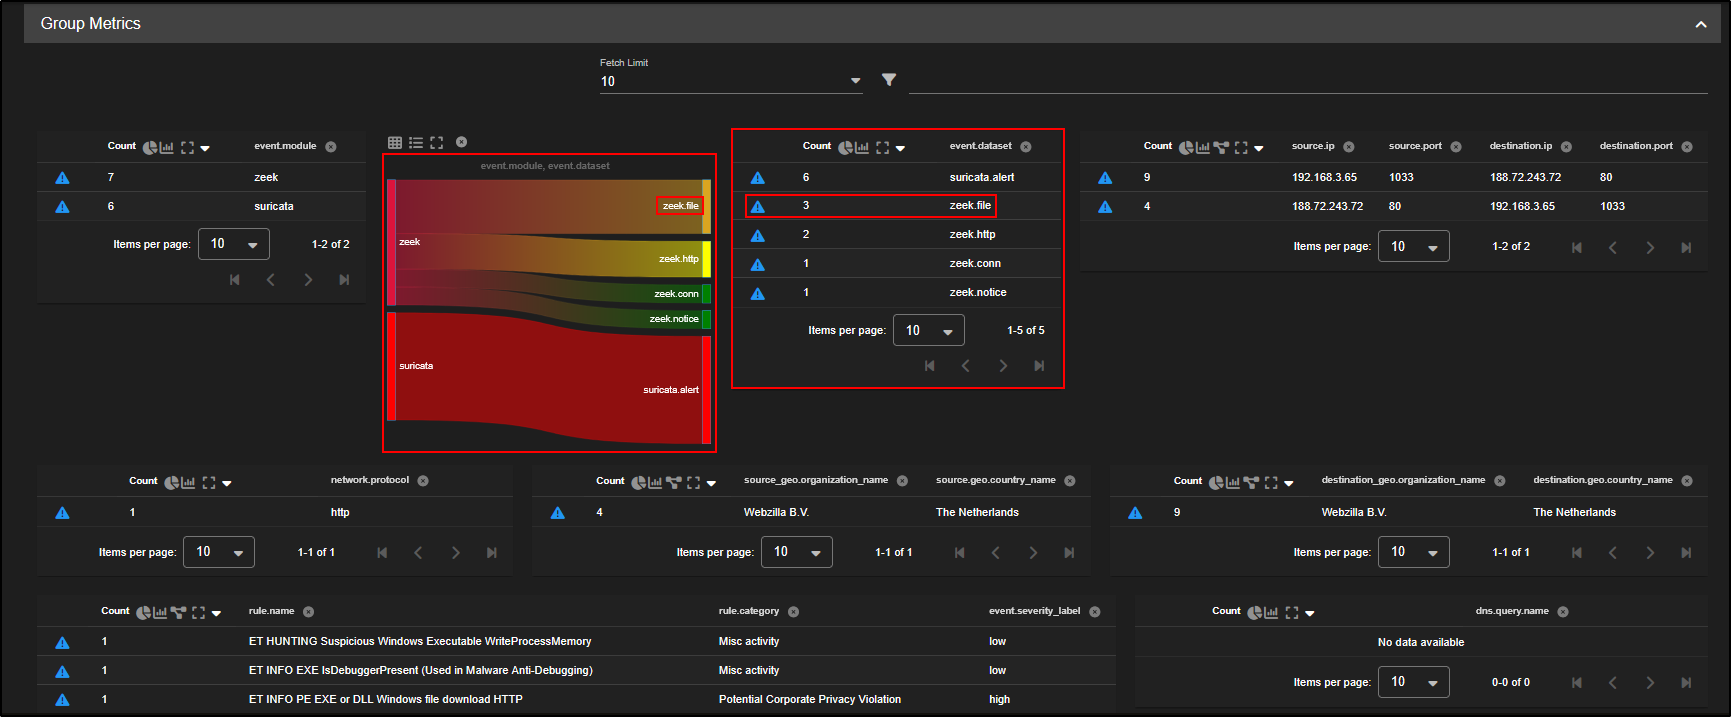
This opens a dashboard view containing all available information about the network flow.
You will see network metadata from Zeek, along with any Suricata alerts, displayed in the Group Metrics pane. This consolidated view helps you quickly understand what occurred during the flow and which detection tools flagged it.
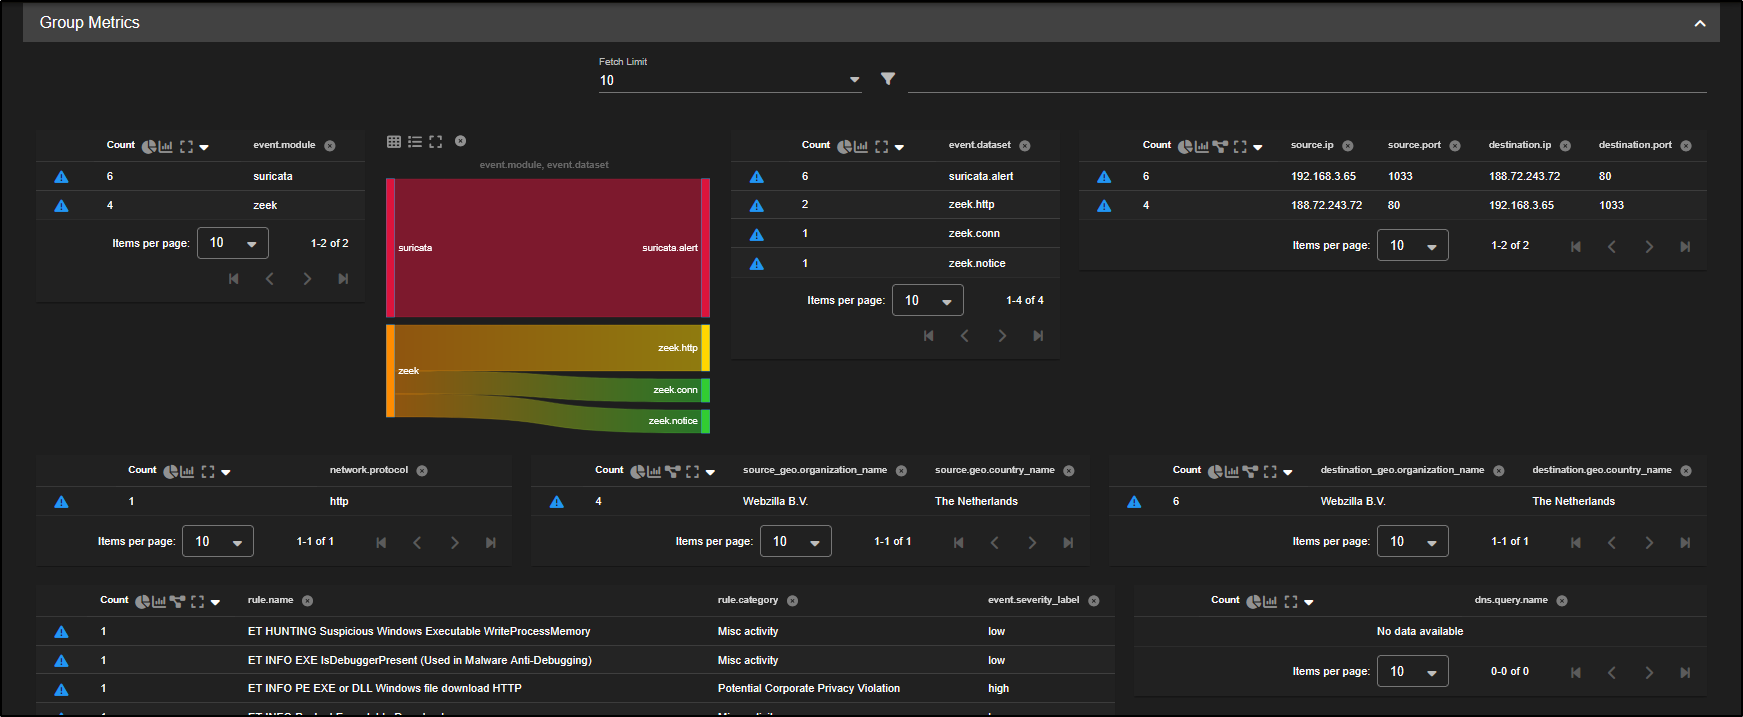
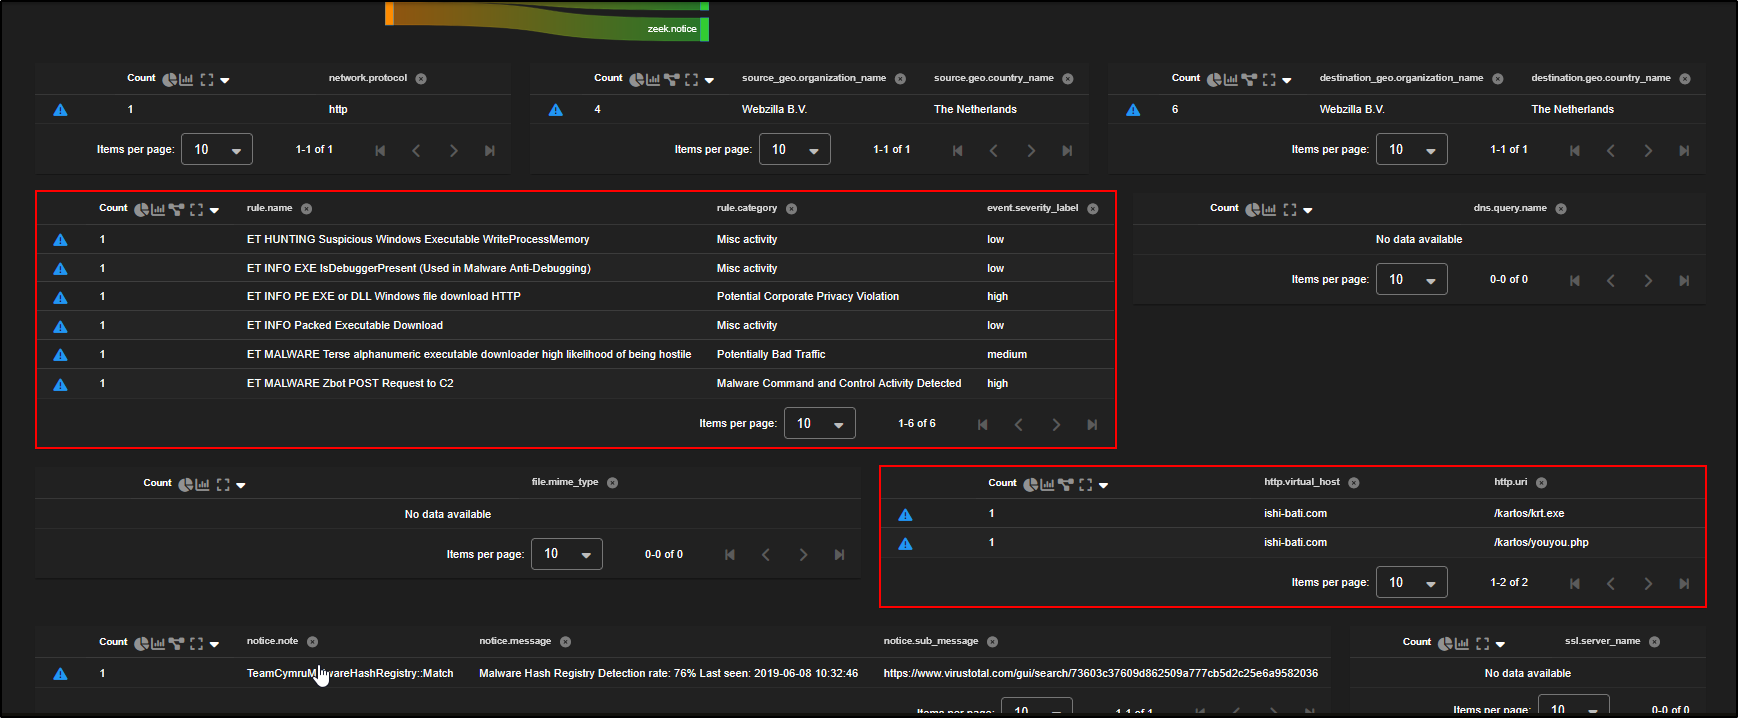
As you scroll down, you will see a list of alerts alongside the HTTP requests sent by the client to the external server.
This provides a clear view of the interaction including what was requested, when it happened, and which alerts were triggered as a result, making it easier to piece together the sequence of events.
Since zeek.file records do not include network connection details, you will need to correlate them with the zeek.conn records to link the file activity to its corresponding network flow.
Scroll down to the zeek.conn dataset, click Actions, then select Correlate. This will tie the file metadata to the relevant connection log, giving you the full context of how the file was transferred.
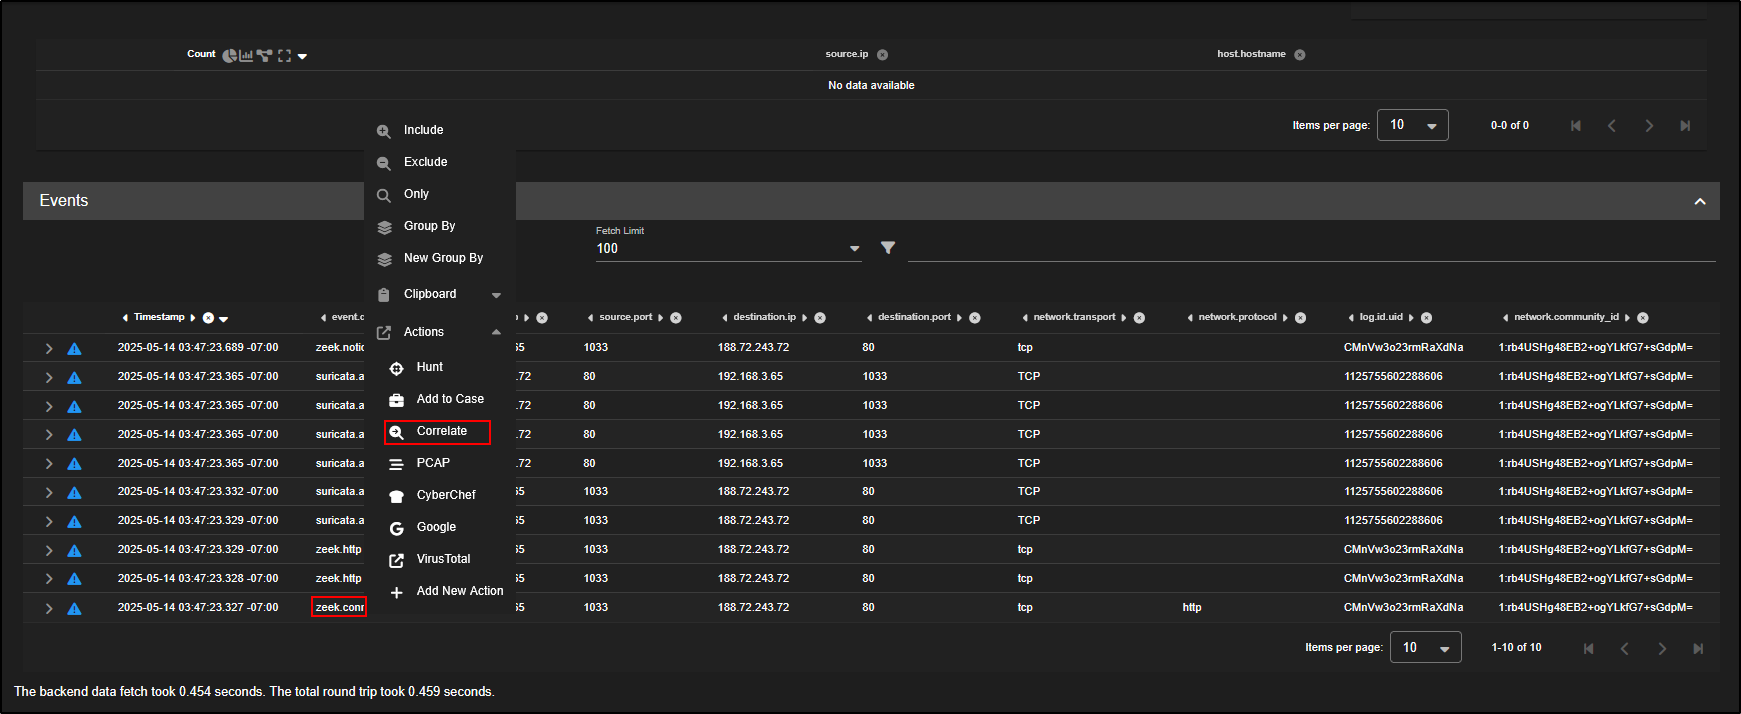
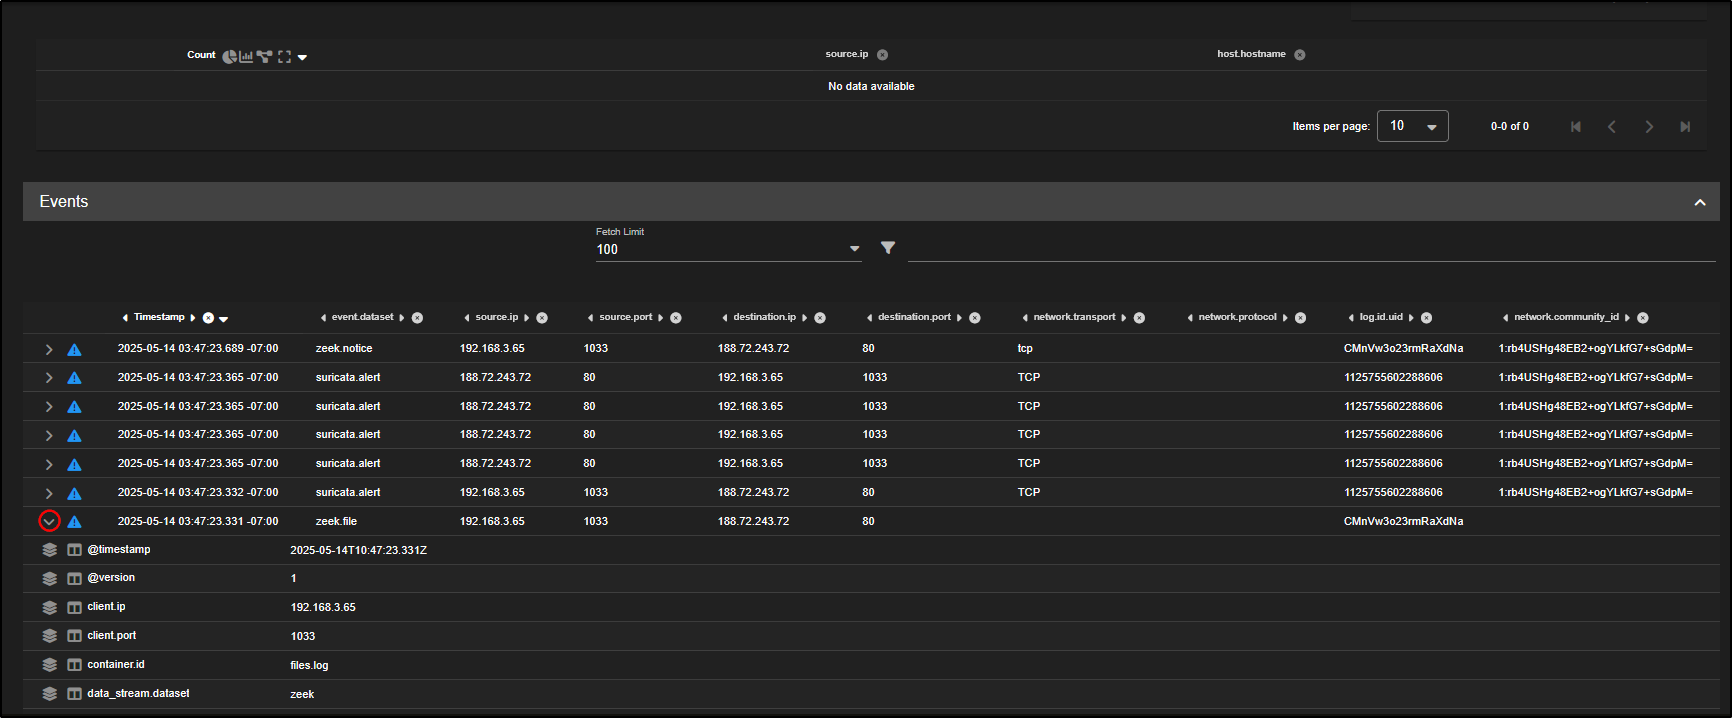
After correlating with the connection log, you should now see zeek.file records appear.
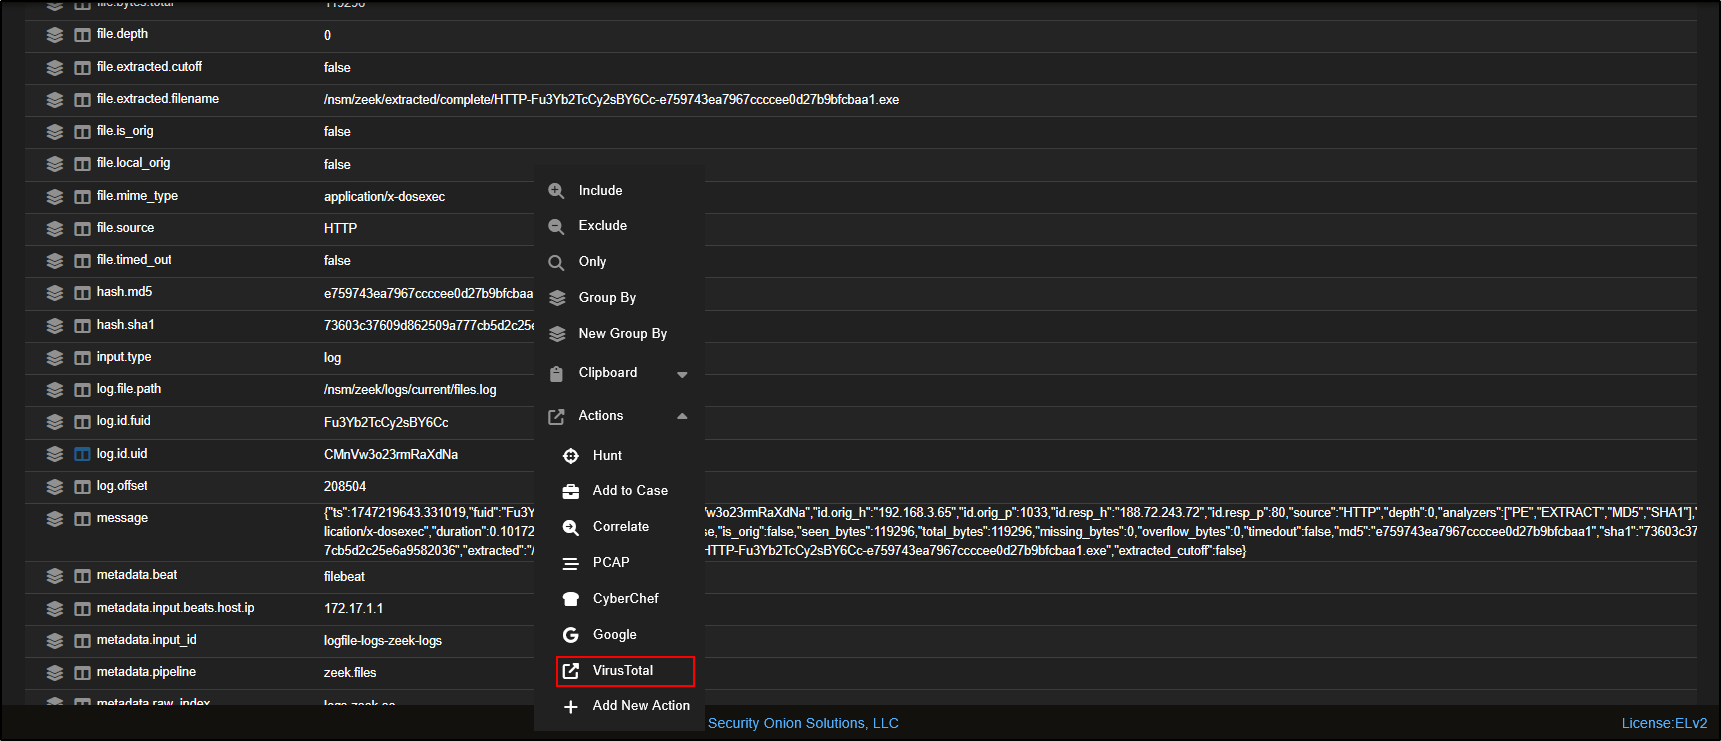
If you scroll down and expand the zeek.file entry, you will find detailed information about the transferred executable file including file size, MIME type, and most importantly, hash values like MD5, SHA1, and SHA256.
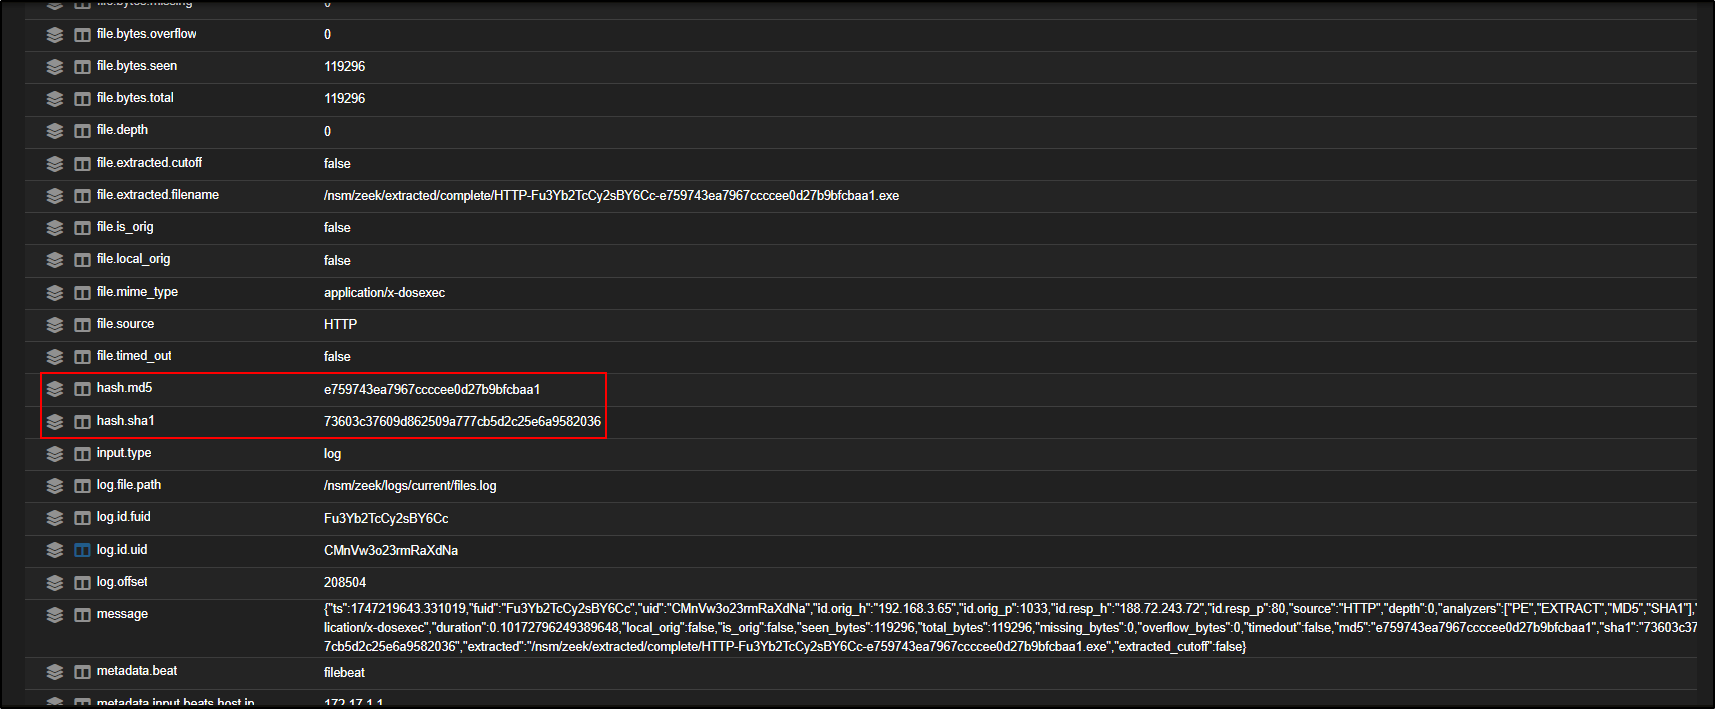
You can check if the file is known to be malicious by clicking on any of the hash values (MD5, SHA1, or SHA256) and selecting VirusTotal.
This will open a link to VirusTotal with a lookup of the hash, showing if the file has been flagged by any antivirus engines or threat intelligence sources.
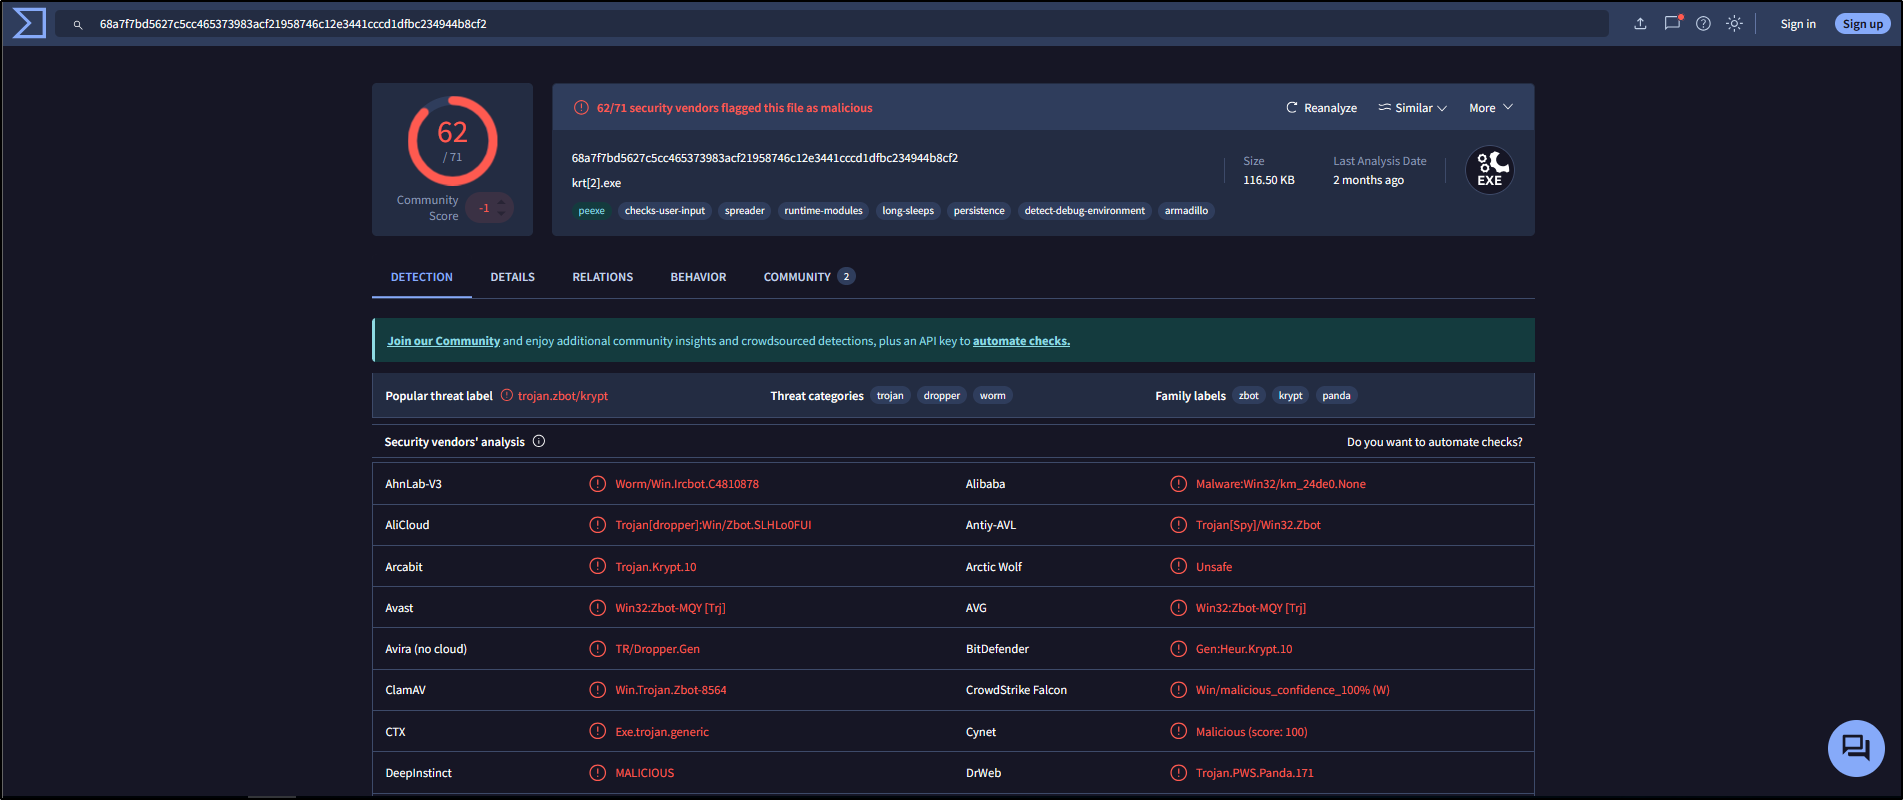
As expected, the VirusTotal results confirm that this is indeed a malicious file.
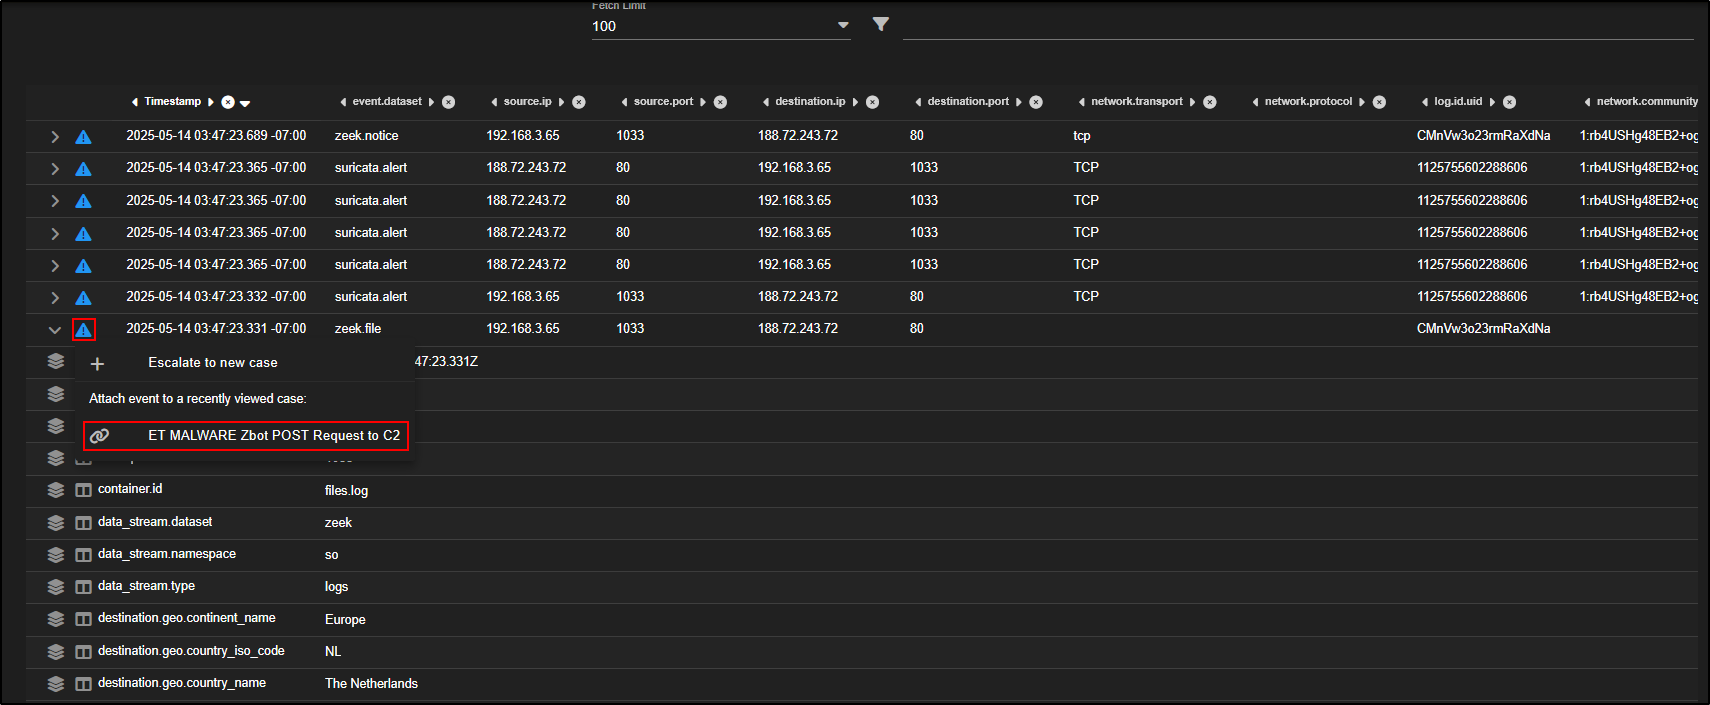
To link this file to your investigation, click the triangle icon on the relevant zeek.file record. Then choose the name of your case under "Attach event to a recently viewed case".
This ensures the event is documented as part of your case evidence.
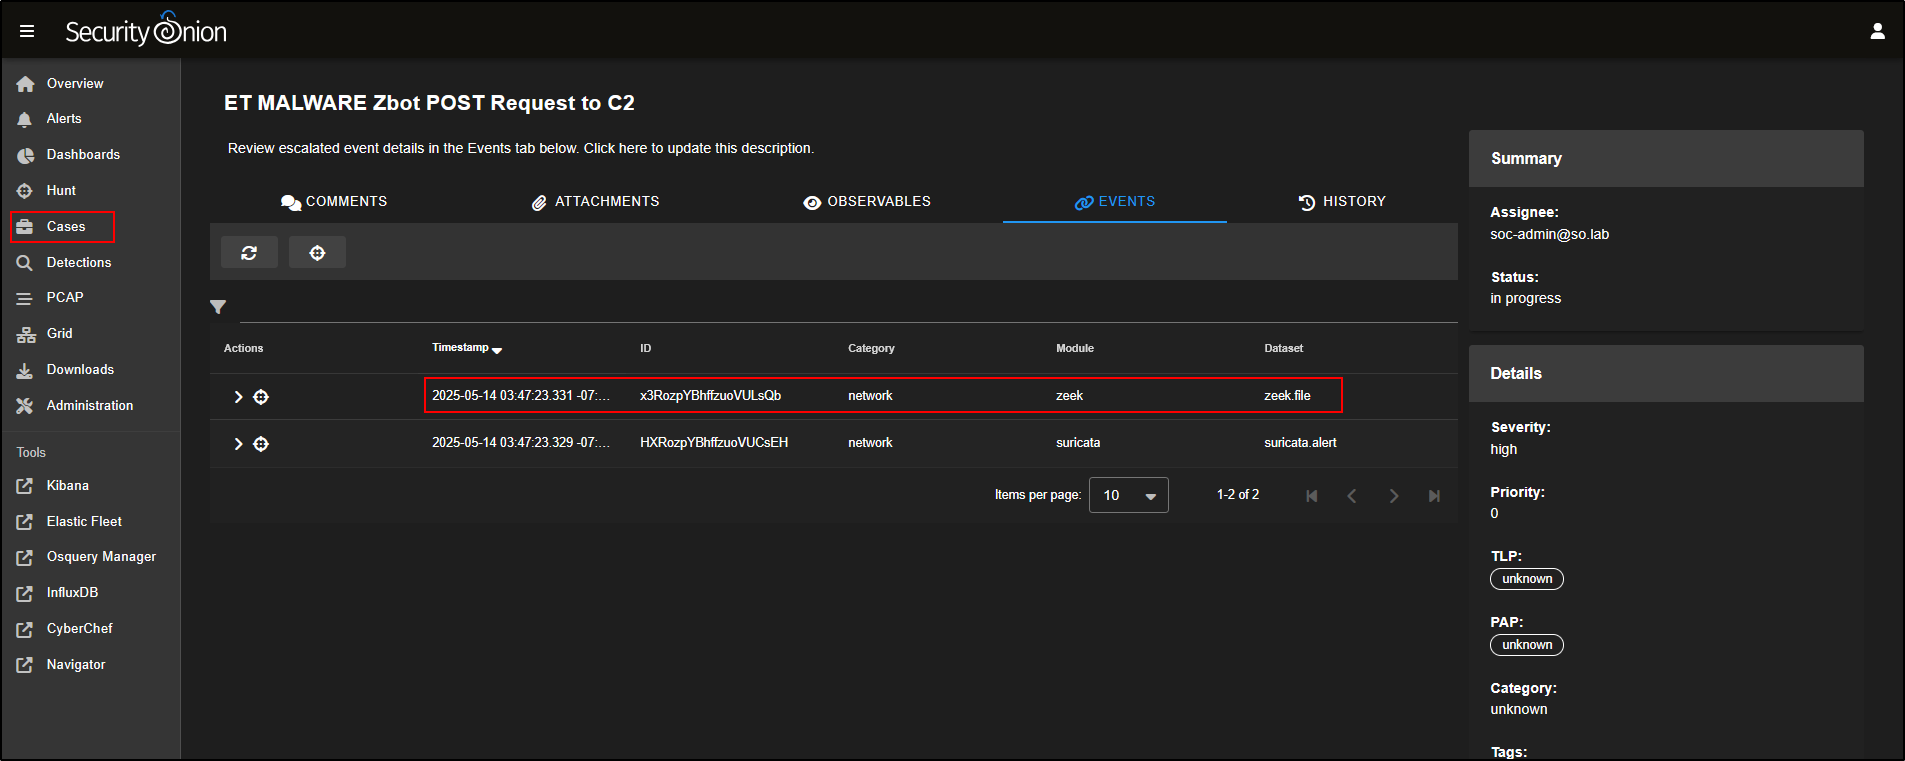
If you return to the Cases tab and open the Events section for your case, you will see that the zeek.file record has been successfully added confirming it is now part of your investigation’s evidence trail.
To add the file hash as an Observable, open the event, scroll down to the hash section, and click on the eye icon next to the hash value.
This will extract the hash and add it to the case as an observable, making it easier to track and hunt for across your environment.
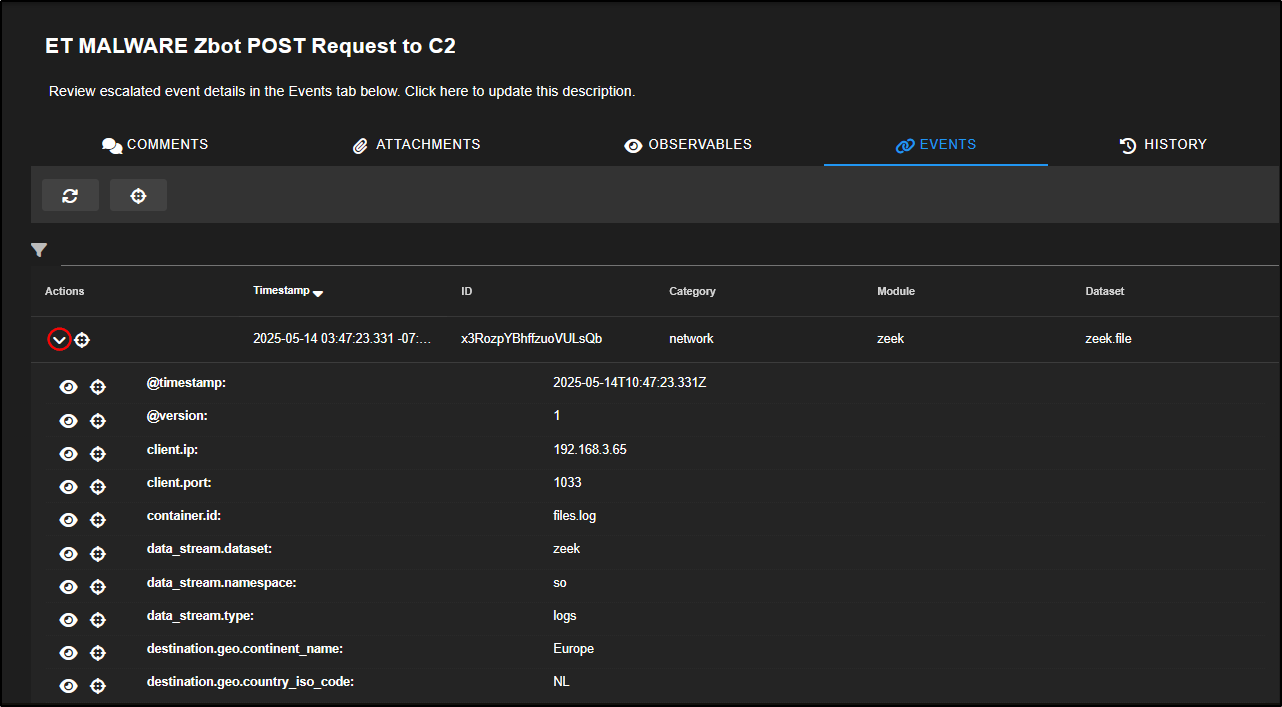
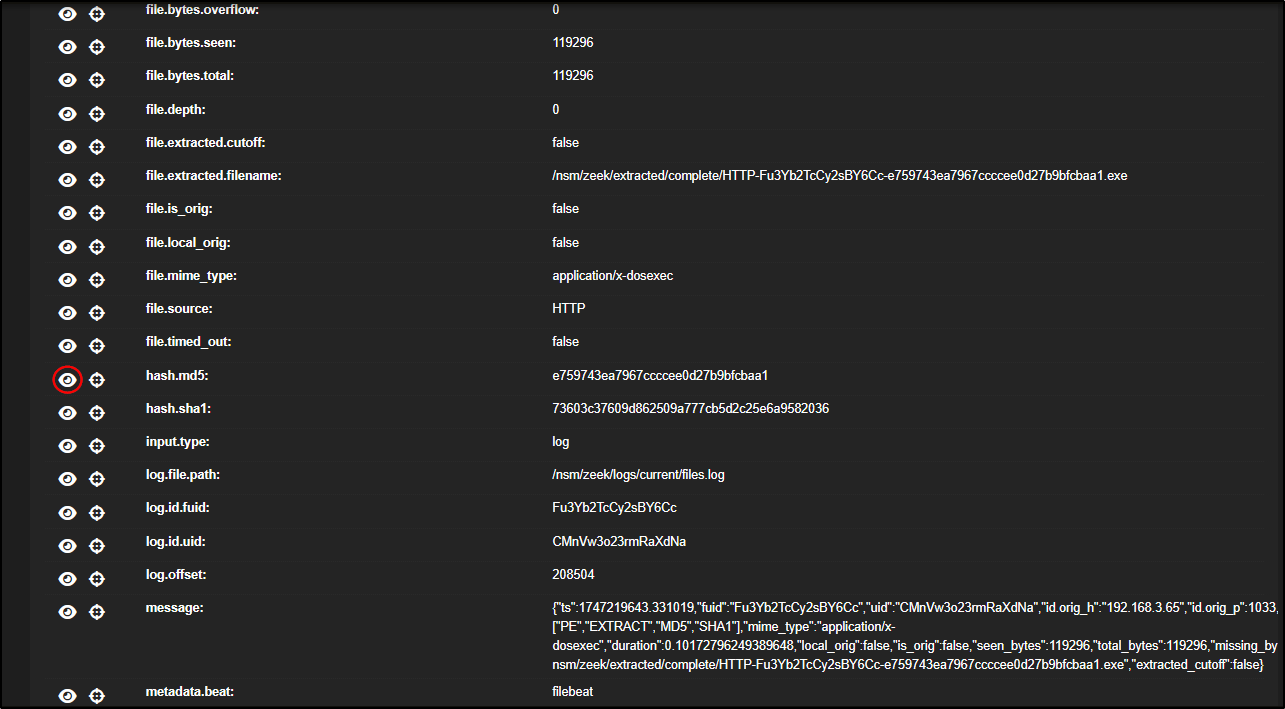
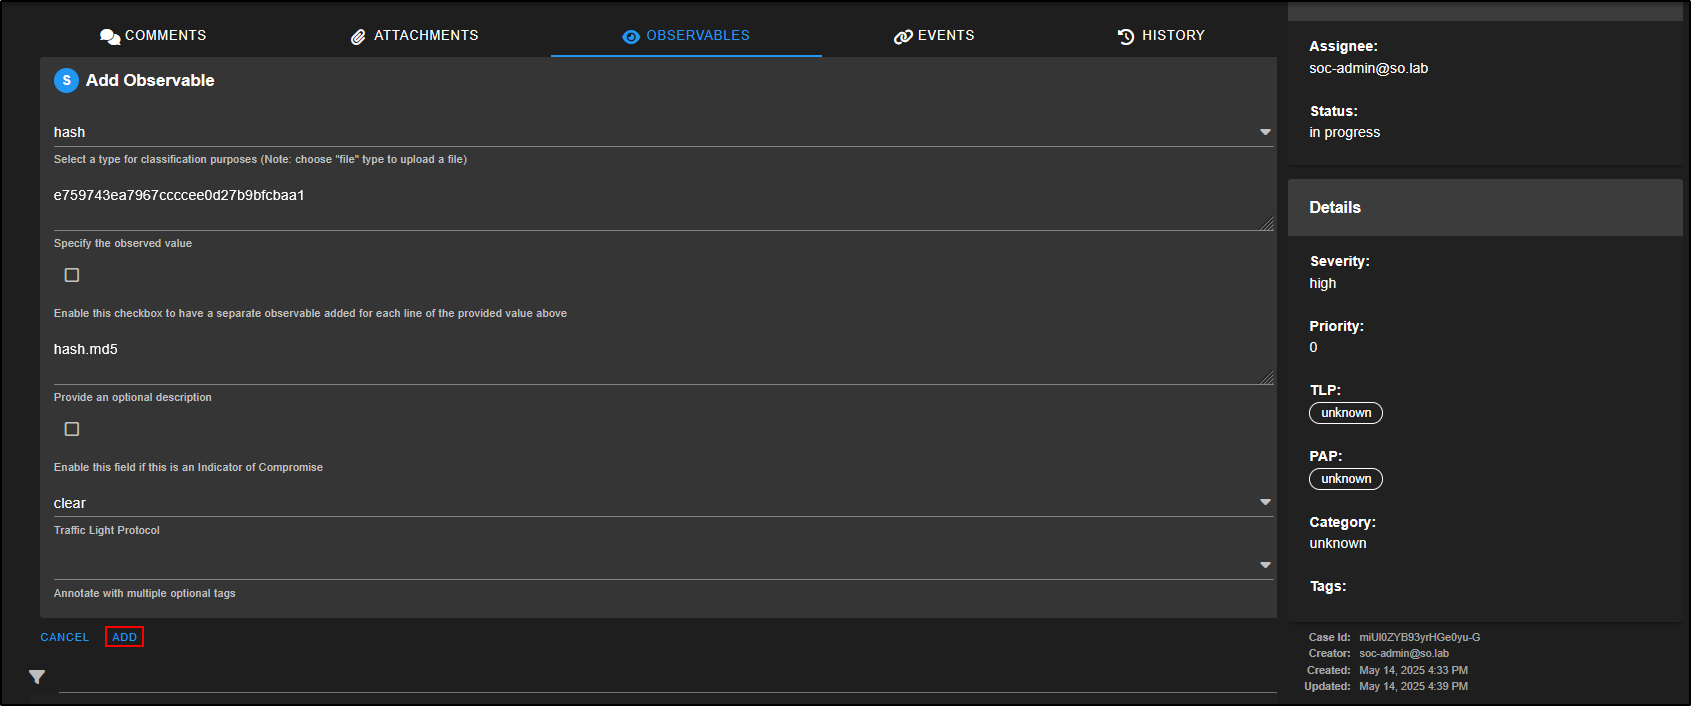
This action will automatically open the Add Observable pane with the hash values pre-filled. Simply click ADD to save the observable to your case.
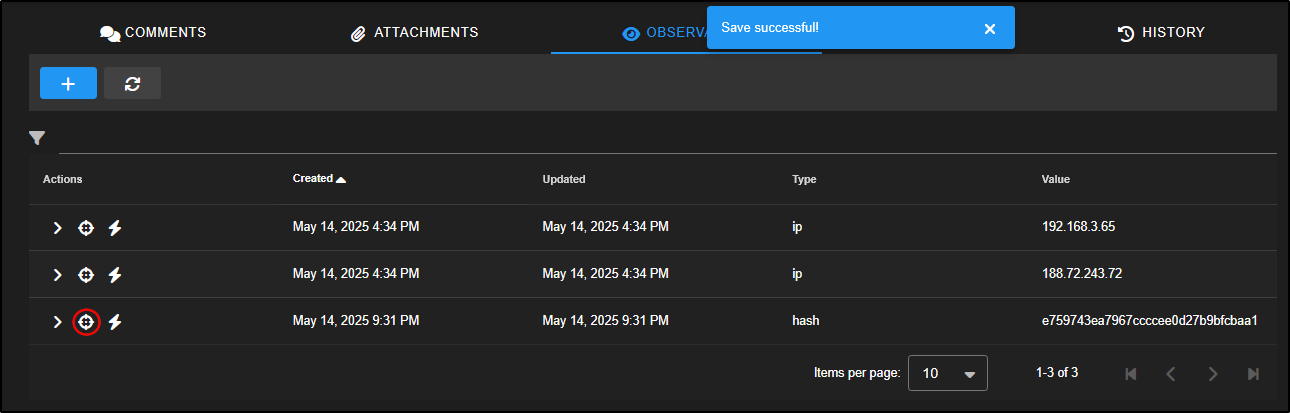
You can now click the crosshair icon next to the observable to launch a new hunt focused on that hash. This helps you check whether the same file appears anywhere else in your environment, which could indicate further compromise.
You can keep building on the investigation by returning to the original Zbot C2 alerts, reviewing activity from other source IPs, and identifying any further signs of infection. Use the PCAPs and network metadata to extract additional Indicators of Compromise (IOCs) and document your findings clearly within the case.
Summary of Alert Triage and Case Creation:
- The Alerts tab shows potential threats detected in your network.
- Analysts can review, acknowledge, dismiss, or escalate alerts to cases for further analysis.
- Once escalated, cases serve as a central record for investigations — storing related events, observables, and attachments.
Investigate the evidence
Record the alert time, rule, severity, source, destination, affected host, and supporting event identifiers. Pivot to Hunt and PCAP where applicable. In the case, preserve the query, relevant observables, evidence, analyst reasoning, disposition, and recommended next action.