Search, Alert, and Visualise
Use the events collected by the PoC to practise investigation searches, reports, alerts, and dashboards.
Introduction to Splunk
Splunk offers free training. You will need to create a user account to access free training materials. The following content is available from the free course “Introduction to Splunk.” Alternatively, same contents are available from SplunkHowTo YouTube channel.
The Splunk search walkthrough provides an additional demonstration of the search workflow used in the exercises below.
The demonstration below requires searchable FortiGate events. Complete either the SC4S path or the direct FortiGate app path first. The two paths assign different sourcetypes, so the searches below include both variants.
Attack Simulation
Authorised lab activity only
Run these tests only against the isolated FortiGate VM that you own or are explicitly authorised to assess. Manual failed logins are sufficient for the learning activity. Treat the automated Hydra example as an advanced, optional reproduction of the original PoC.
Run nmap scan against FortiGate VM’s internal IP address. From the nmap scan result, we can see that port 22 for ssh is open and belongs to FortiGate.
Show example Nmap output
#Example output
PORT    STATE  SERVICE   VERSION
22/tcp  open   ssh       FortiSSH (protocol 2.0)
| ssh-hostkey:
|   256 63:3a:d1:25:e2:97:c3:52:e8:00:77:b5:0f:db:2d:9a (ECDSA)
|   384 41:0d:b6:d0:af:43:08:fe:5b:64:e3:de:7f:80:6c:82 (ECDSA)
|   521 1f:ac:5e:96:a2:70:a5:ea:f2:3f:e4:12:fd:23:aa:94 (ECDSA)
|_  256 45:77:22:18:b8:13:bb:6d:60:bf:87:91:95:f3:d9:02 (ED25519)
113/tcp closed ident
443/tcp open   ssl/https
| ssl-cert: Subject: commonName=FortiGate/organizationName=Fortinet Ltd./stateOrProvinceName=California/countryName=US
| Subject Alternative Name: IP Address:192.168.1.10, IP Address:10.0.0.1
| Issuer: commonName=FGVMEVMBF57GNJF3/organizationName=Fortinet/stateOrProvinceName=California/countryName=US
| Public Key type: rsa
| Public Key bits: 2048
| Signature Algorithm: sha256WithRSAEncryption
| Not valid before: 2025-02-25T22:28:01
| Not valid after:  2027-05-31T22:28:01
| MD5:   1757:d25d:ec8e:5eae:92ef:1b01:91a6:9fb1
|_SHA-1: 9246:9b61:fbab:1a64:aeac:da55:7ebf:277f:05e5:65ec
<SNIP>
Manual failed logins in the next step are sufficient to create the events used by this exercise. The automated reproduction below is optional and should use only deliberately invalid, lab-only credentials.
Optional: generate a small, rate-limited authentication test with Hydra
Create a usernames file containing lab account names and a passwords file containing deliberately invalid test values. Do not include real credentials.
Run a small rate-limited test. Stop after confirming that the expected failed authentication events have been generated.
Show example Hydra output
#Example output
└─$ hydra -t 4 -L usernames.txt -P passwords.txt ssh://10.0.0.1

Hydra v9.5 (c) 2023 by van Hauser/THC & David Maciejak - Please do not use in military or secret service organizations, or for illegal purposes (this is non-binding, these *** ignore laws and ethics anyway).

Hydra (https://github.com/vanhauser-thc/thc-hydra) starting at 2025-02-27 14:25:56
[WARNING] Many SSH configurations limit the number of parallel tasks, it is recommended to reduce the tasks: use -t 4
[DATA] max 16 tasks per 1 server, overall 16 tasks, 24 login tries (l:4/p:6), ~2 tries per task
[DATA] attacking ssh://10.0.0.1:22/
[ERROR] ssh target does not support password auth
[ERROR] ssh target does not support password auth
[ERROR] ssh target does not support password auth
[ERROR] ssh target does not support password auth
[ERROR] ssh target does not support password auth
[ERROR] ssh target does not support password auth
[ERROR] ssh target does not support password auth
[ERROR] ssh target does not support password auth
[ERROR] ssh target does not support password auth
[ERROR] ssh target does not support password auth
[ERROR] all children were disabled due too many connection errors
0 valid passwords found
[INFO] Writing restore file because 2 server scans could not be completed
[ERROR] 1 target was disabled because of too many errors
[ERROR] 1 targets did not complete
Hydra (https://github.com/vanhauser-thc/thc-hydra) finished at 2025-02-27 14:25:57
To generate failed login events from multiple different hosts, SSH into the FortiGate using a valid username but a random password.
From Splunk and Ubuntu VM:
#Example output
The authenticity of host '10.0.0.1 (10.0.0.1)' can't be established.
ED25519 key fingerprint is SHA256:zuocT3kebXHrIVyokxu2EKQTKhuxG/ikAQb2K+uZY54.
This key is not known by any other names.
Are you sure you want to continue connecting (yes/no/[fingerprint])? yes
Warning: Permanently added '10.0.0.1' (ED25519) to the list of known hosts.
admin@10.0.0.1's password:
Permission denied, please try again.
admin@10.0.0.1's password:
Permission denied, please try again.
admin@10.0.0.1's password:
Received disconnect from 10.0.0.1 port 22:2: Too many authentication failures
Disconnected from 10.0.0.1 port 22
To generate a successful login event, connect to FortiGate over SSH with valid credentials. You may need to wait until FortiGate resets the connection limit.
From Splunk and Ubuntu VM:
WARNING: File System Check Recommended! An unsafe reboot may have caused an inconsistency in the disk drive.
It is strongly recommended that you check the file system consistency before proceeding.
Please run 'execute disk list' and then 'execute disk scan <ref#>'.
Note: The device will reboot and scan the disk during startup. This may take up to an hour.
FGVMEVMBF57GNJF3 # exit
Connection to 10.0.0.1 closed.
Creating Reports
See also: Creating a Splunk report.
Discover broadly, then narrow the search
The examples initially use index=* so they work with either ingestion
path. Once you identify the index that contains your FortiGate data,
replace index=* with that specific index in saved reports, alerts, and
dashboard searches.
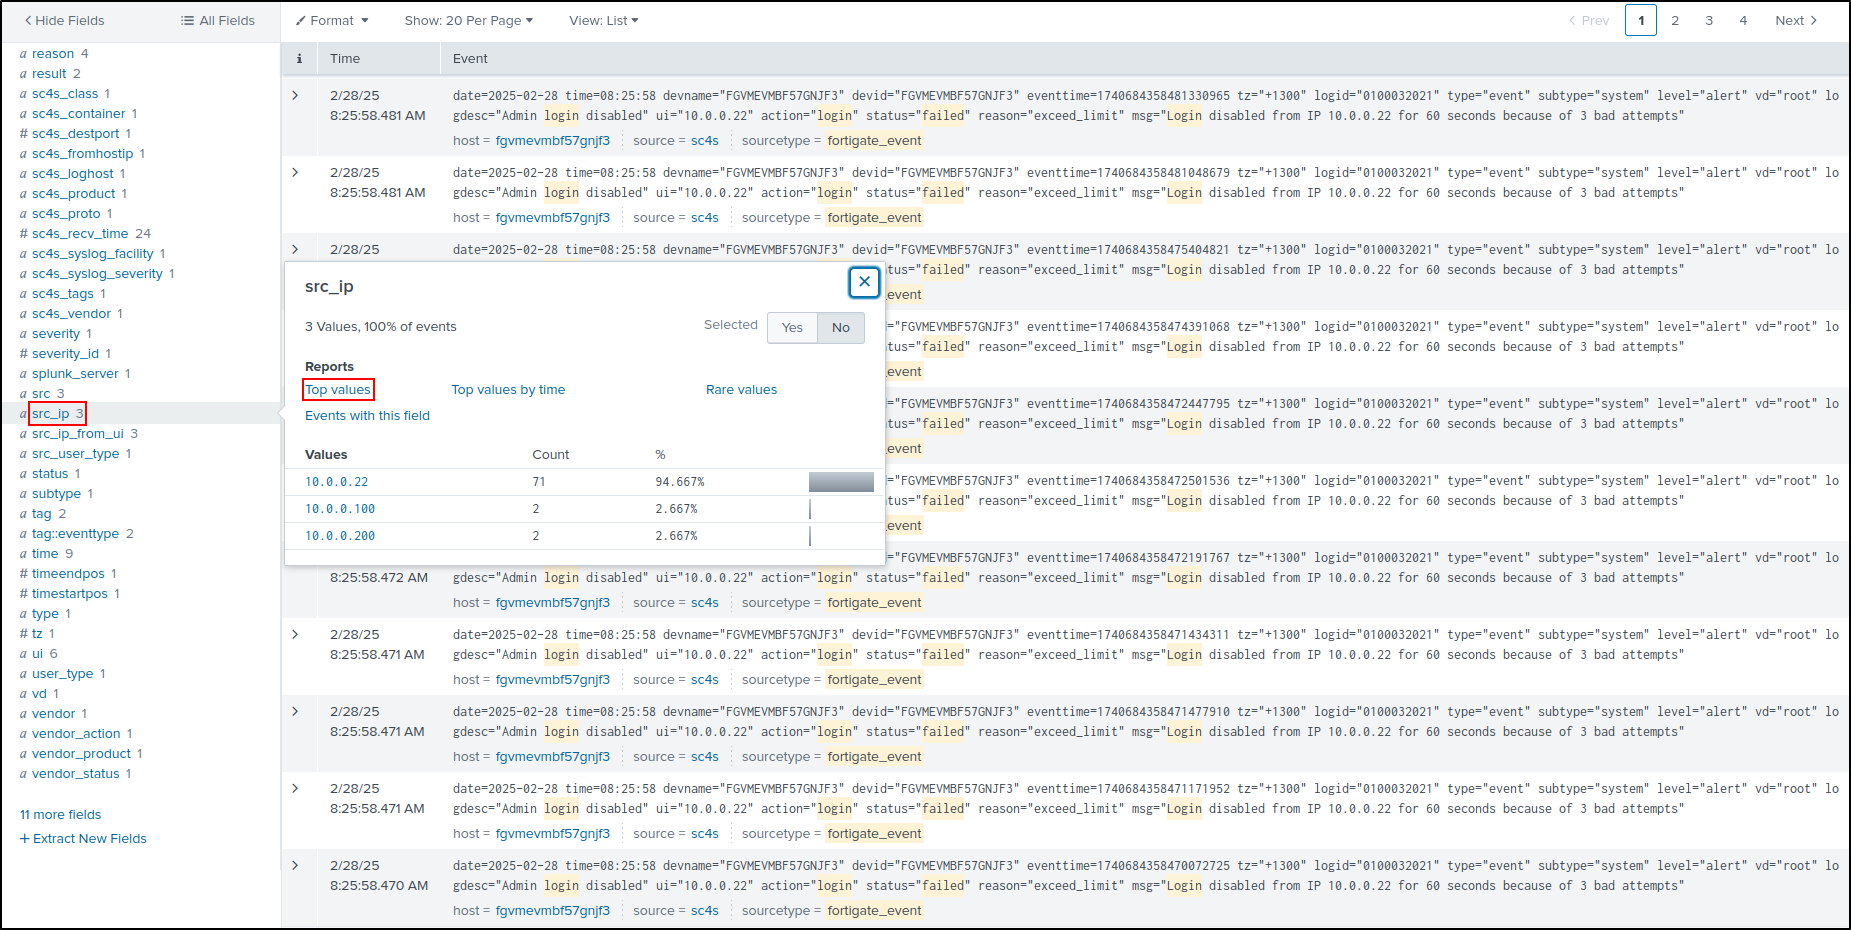
On Splunk Enterprise web UI, search for login failed events on FortiGate.
Select srcip from Interesting Fields, then select Top values.
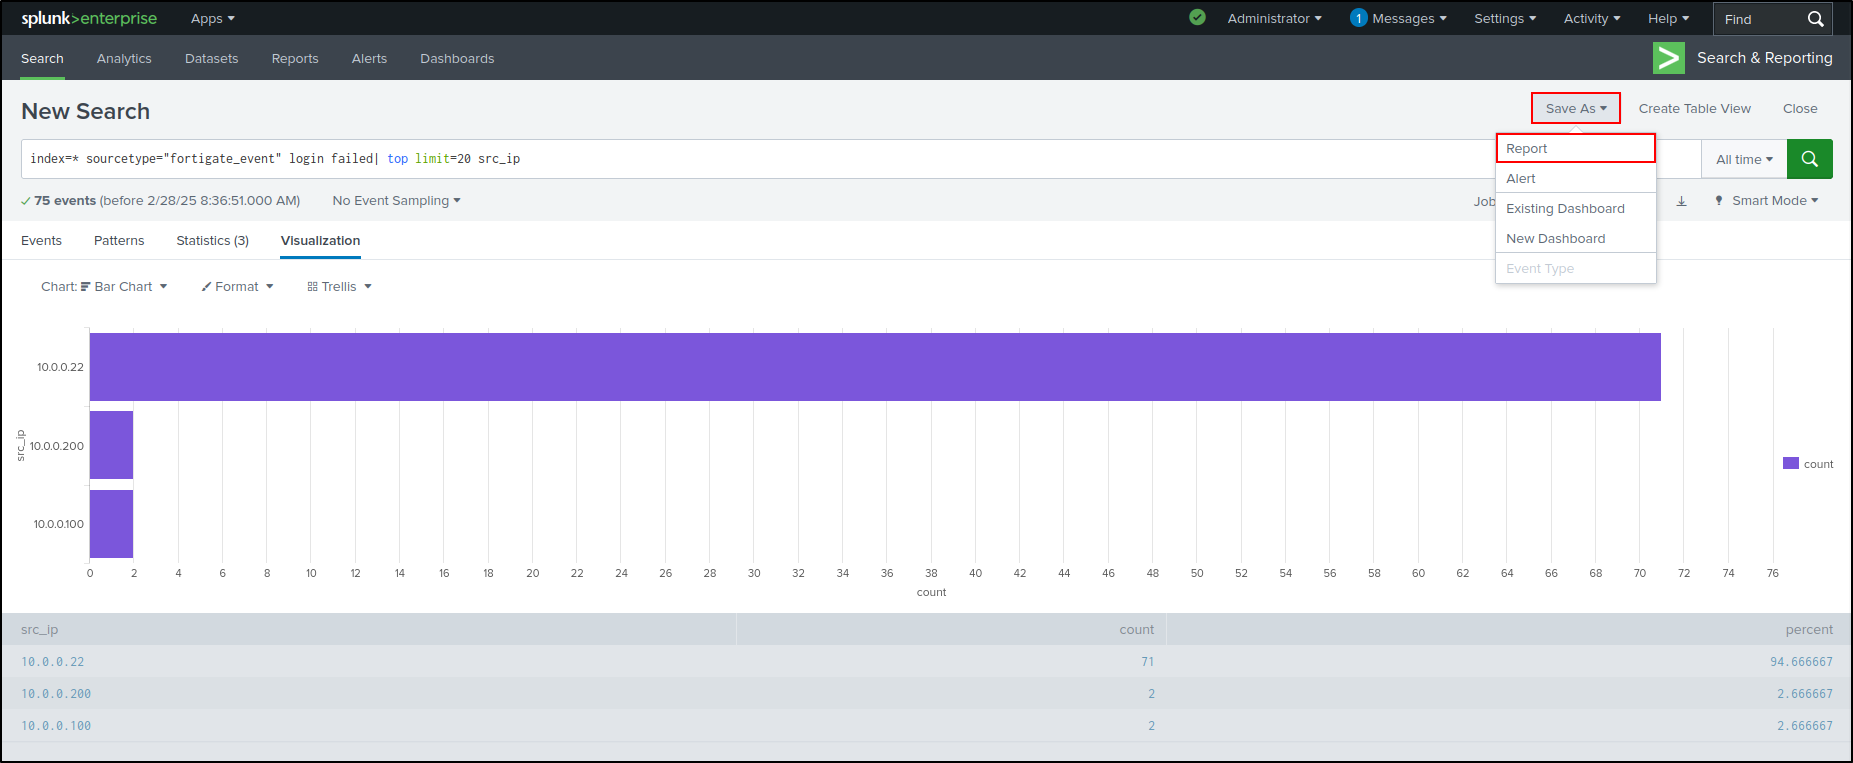
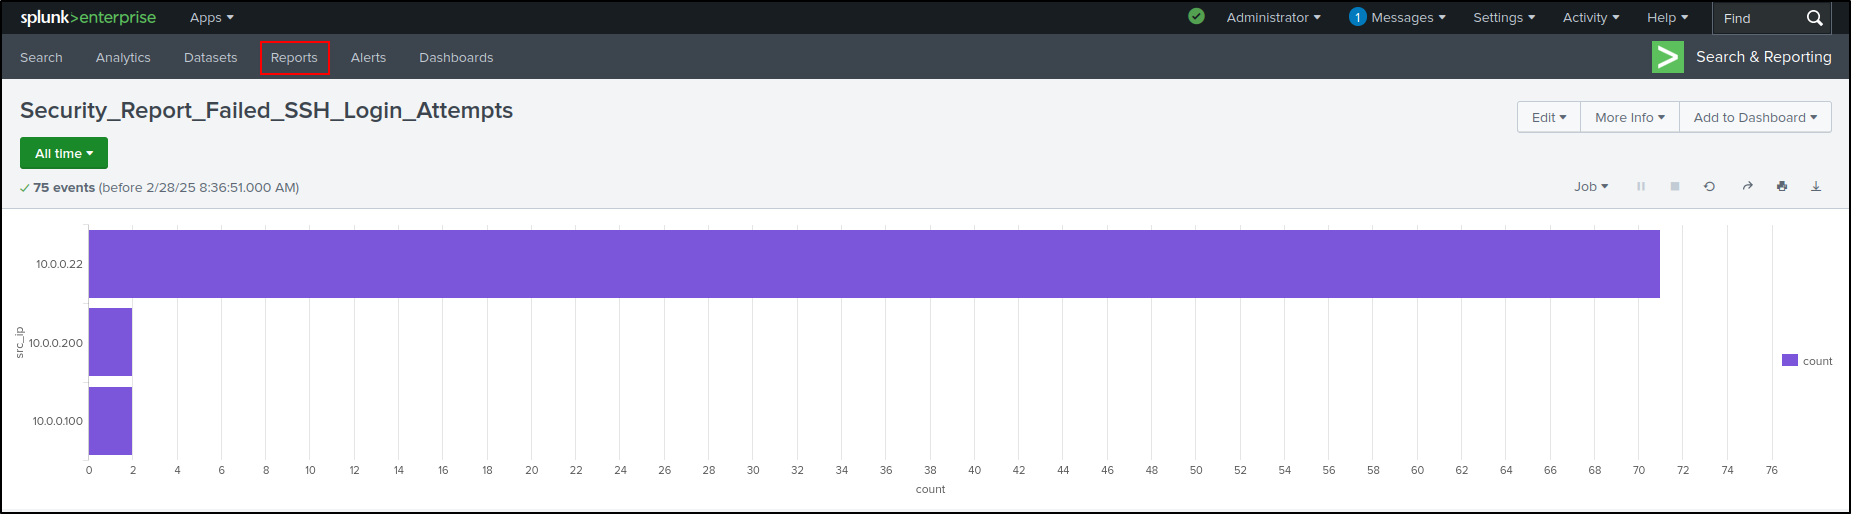
This will visualise data as a bar chart. Save As Report.
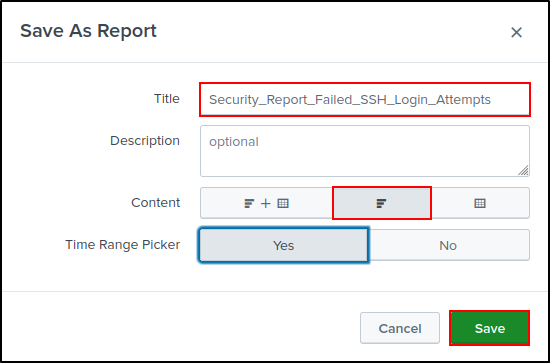
Set Title as Security_Report_Failed_SSH_Login_Attempts. Set Content as Bar Chart. Select Yes for Time Range Picker. Click Save.
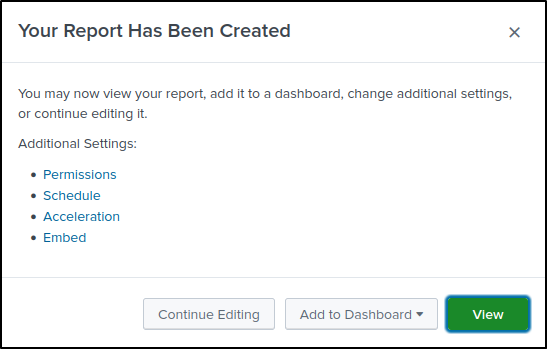
Select View
Select Time Range as All time and click Reports.
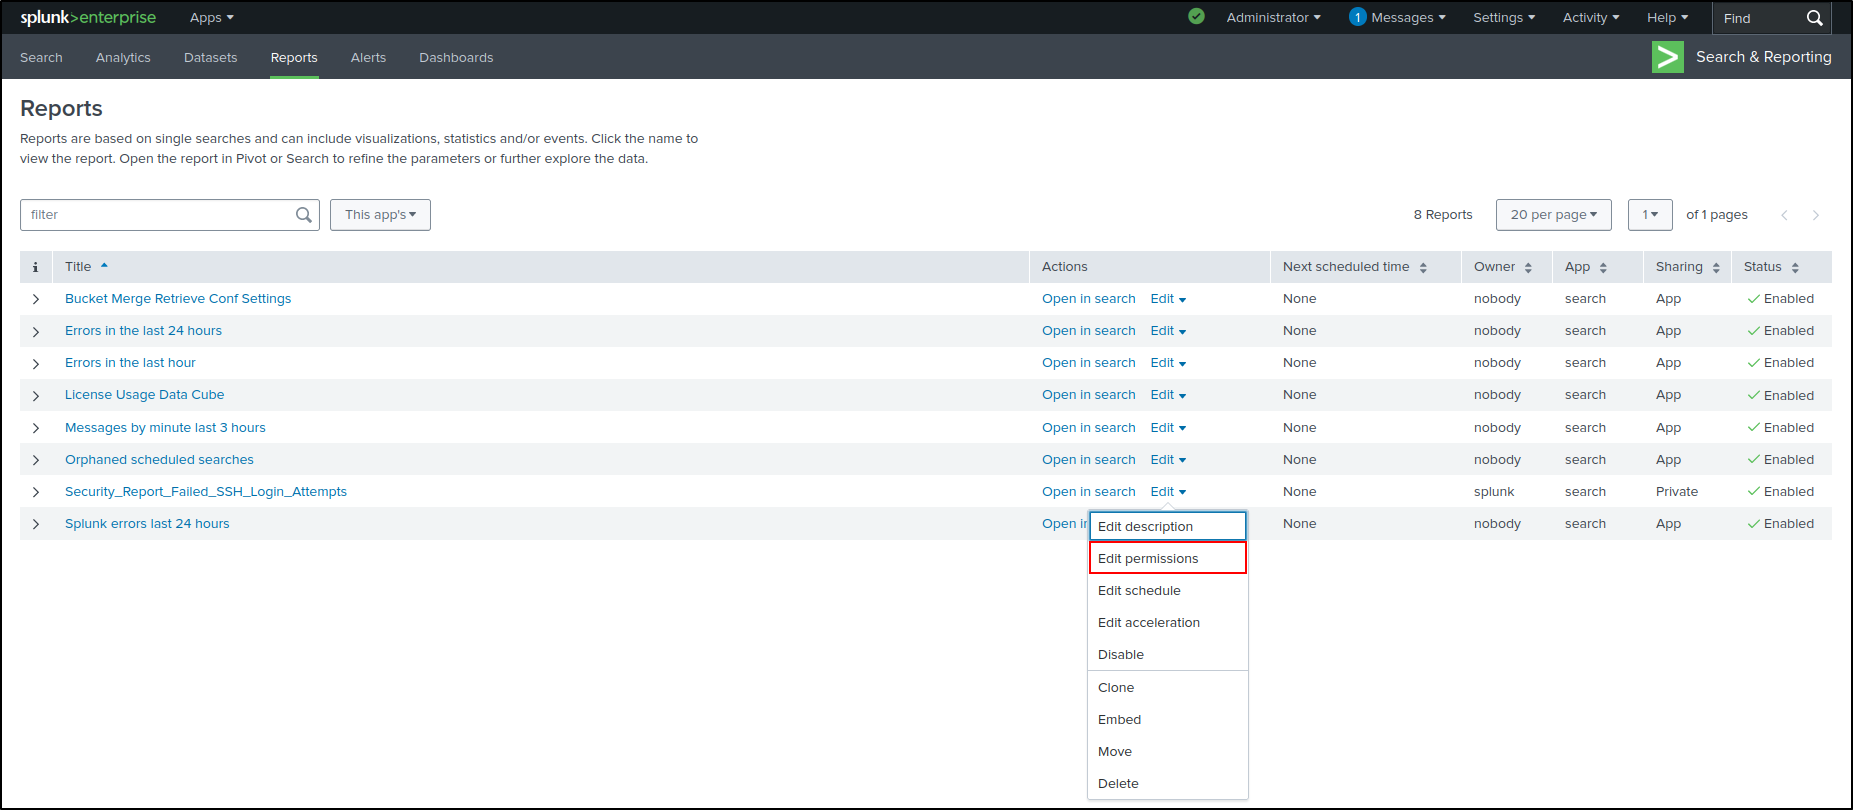
Edit Permissions for Security_Report_Failed_SSH_Login_Attempts.
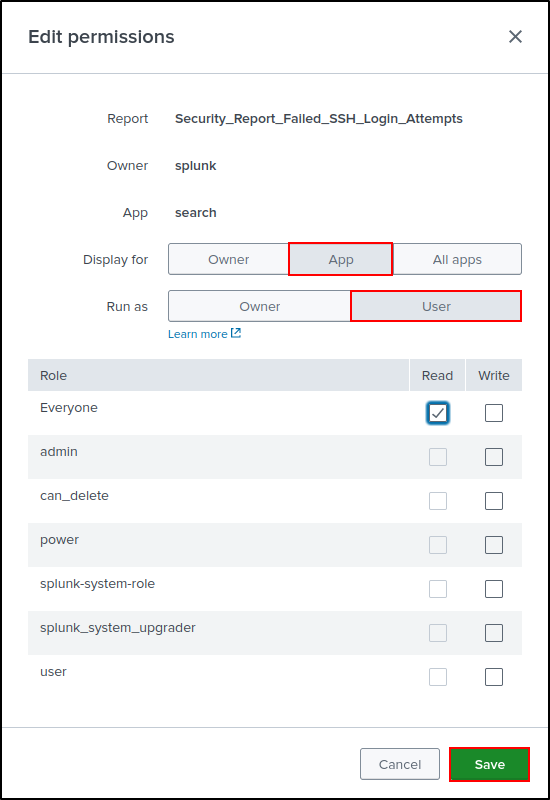
Select following options:
- Display For App
- Run As User
- Assign Read to Everyone
Click Save
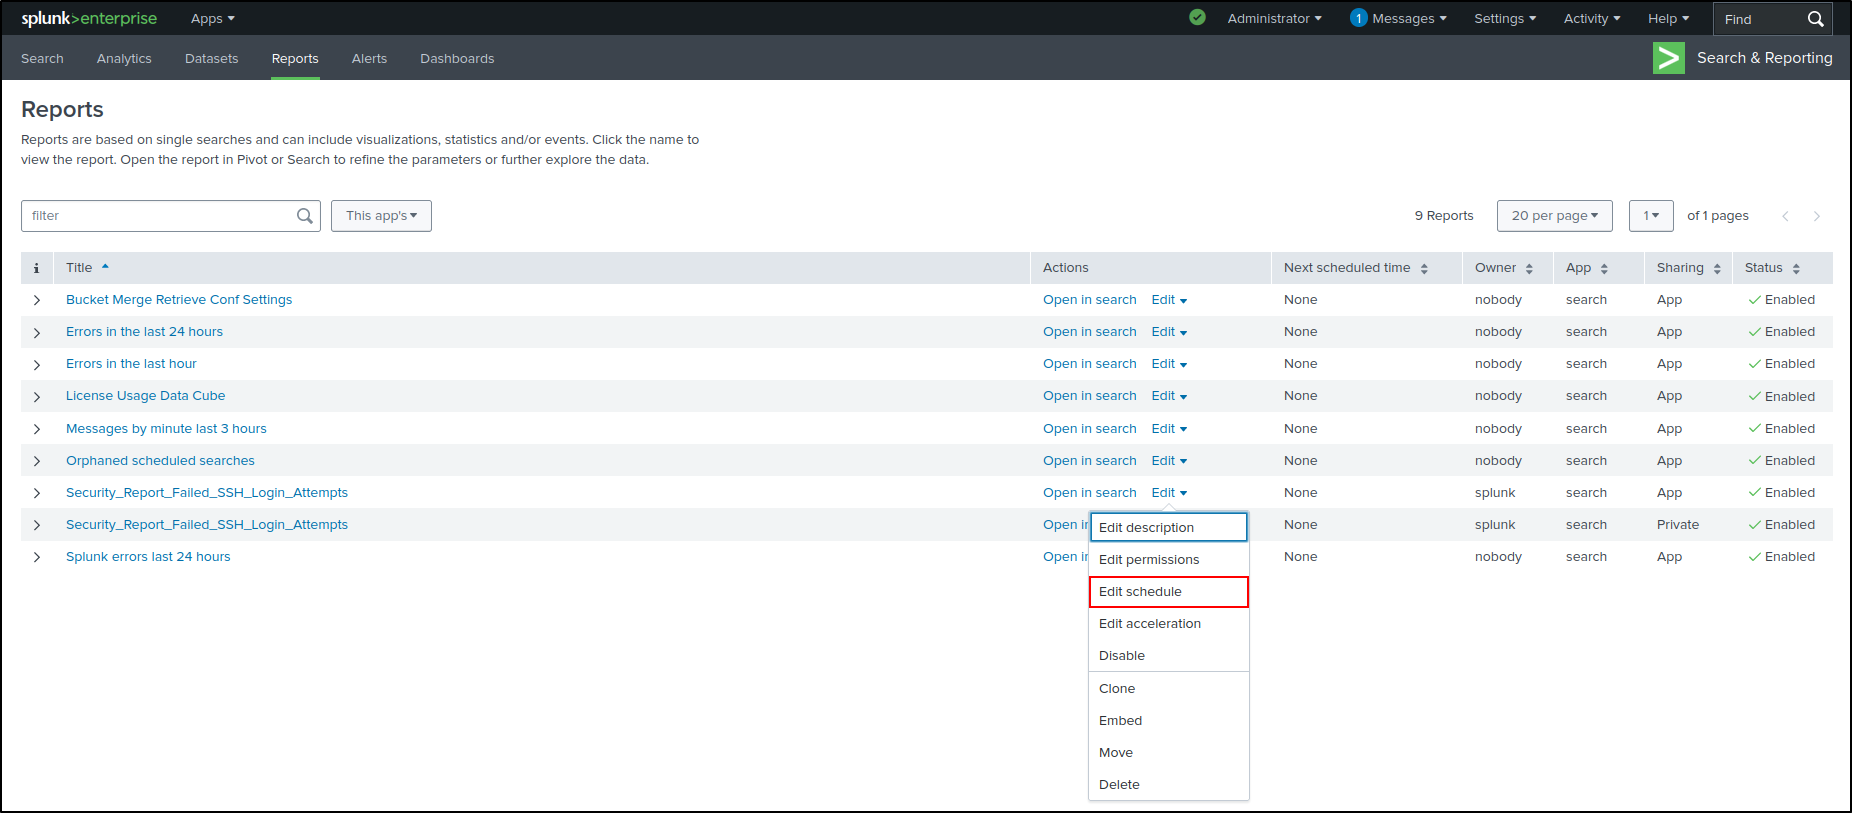
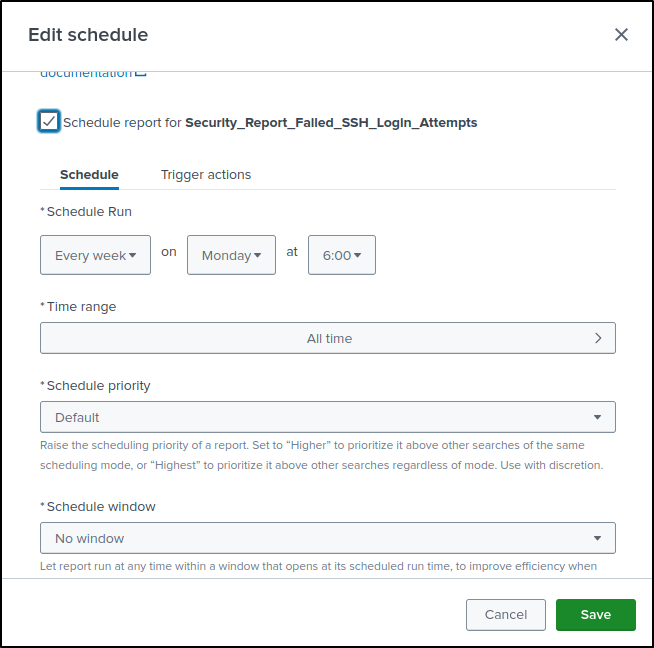
Edit Schedule (optional). Scheduling Report can reduce strain on your environment caused by repeatedly running new ad-hoc searches. Select Schedule and Time Range of your preference (leave as default). Click Save.
Creating Alerts
See also: Creating a Splunk alert.
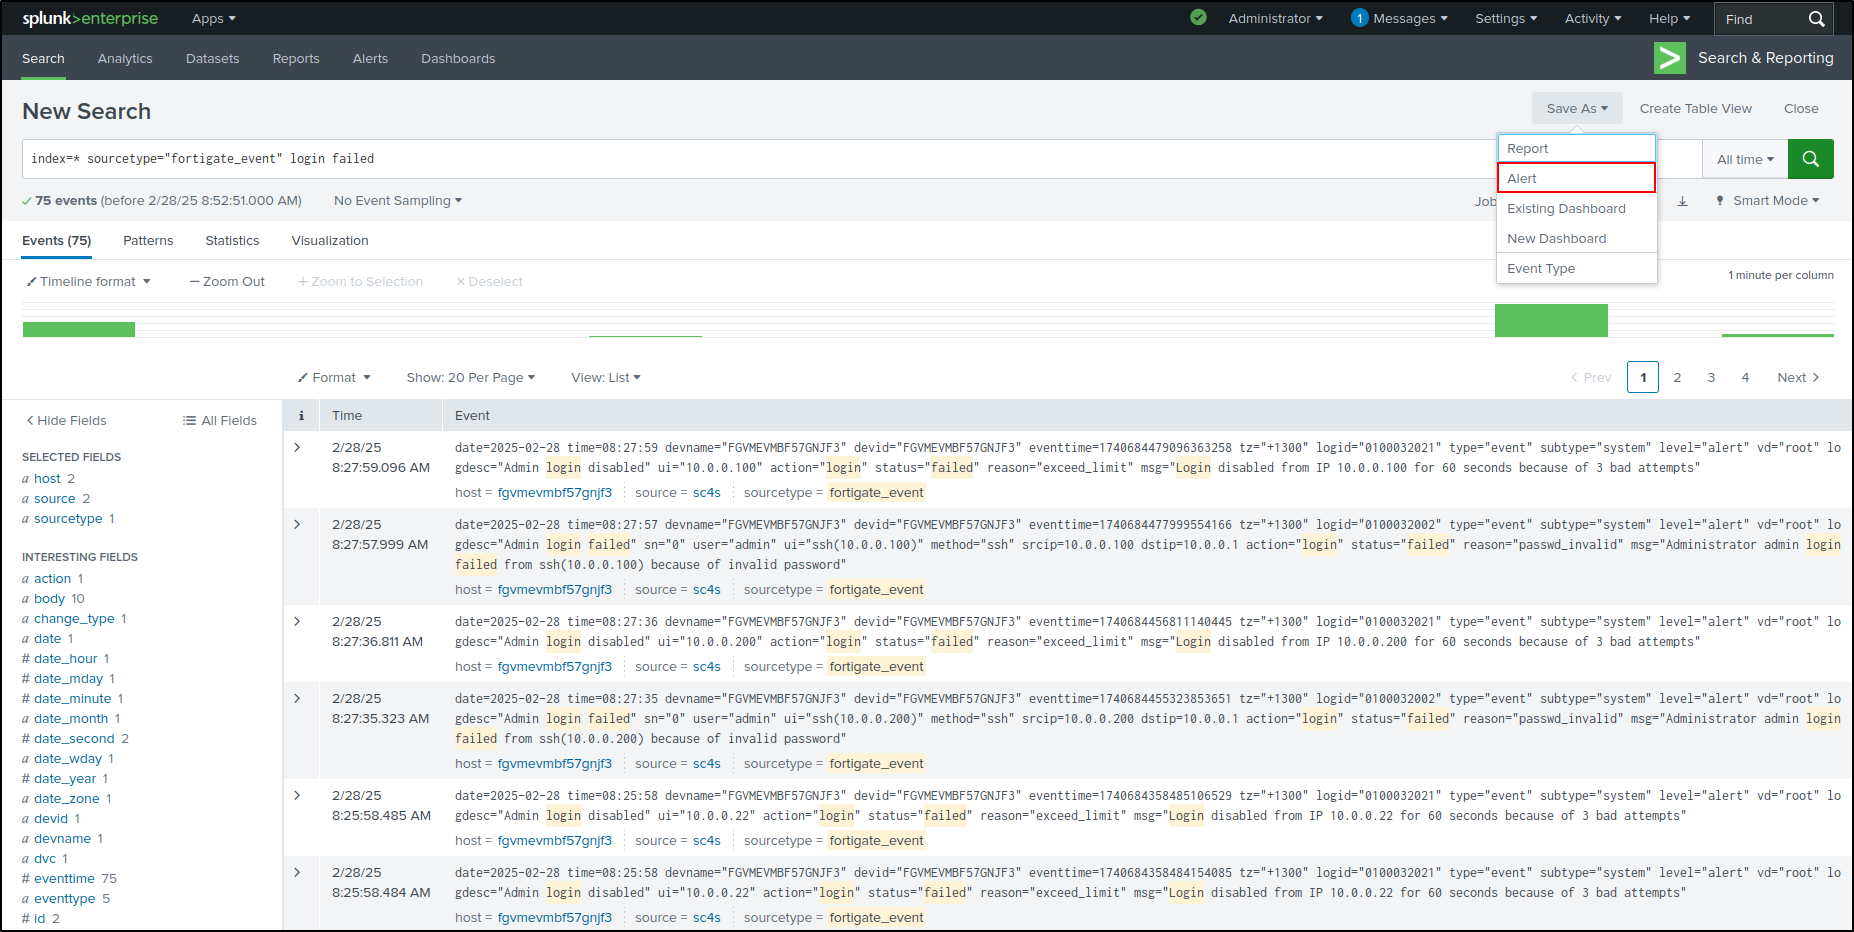
On Splunk Enterprise web UI, search for Admin login failed events on FortiGate.
Save As Alert
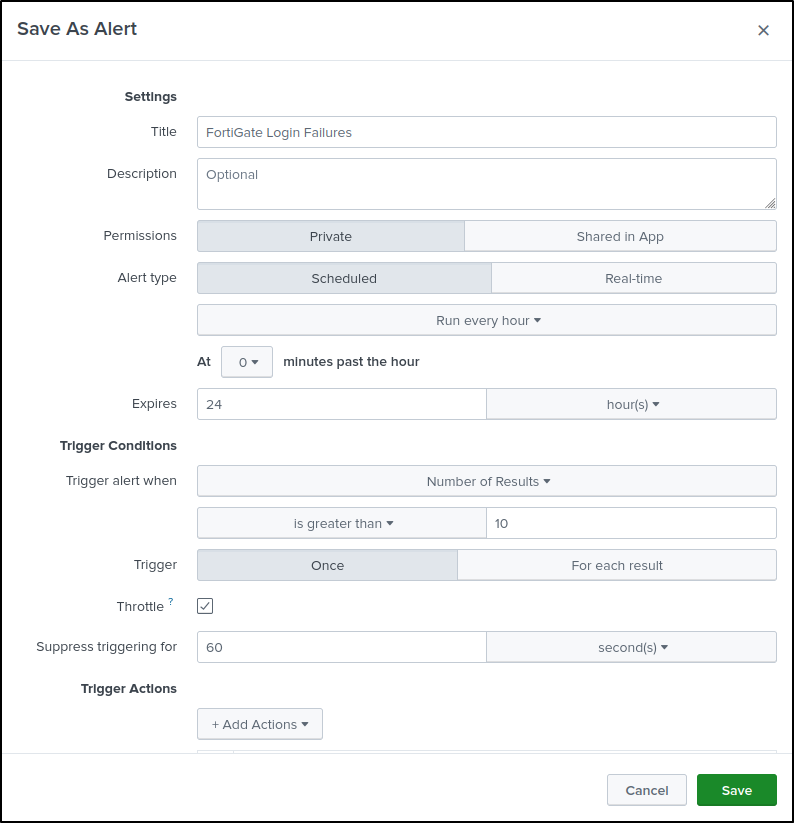
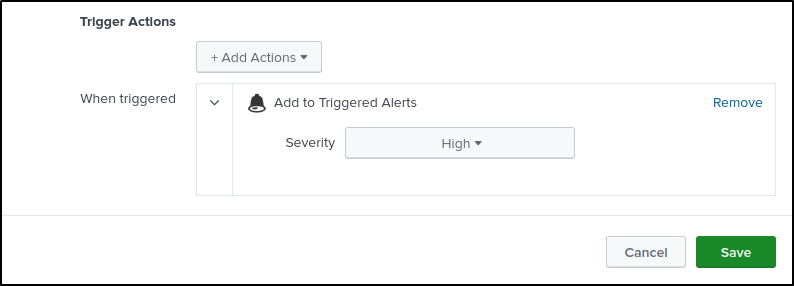
Set the title to FortiGate Login Failures and permissions to Private. Configure a scheduled alert that runs hourly and expires after 24 hours. Trigger it once when the number of results is greater than 10. Enable throttling for 60 seconds and add the alert to Triggered Alerts with high severity, then save.
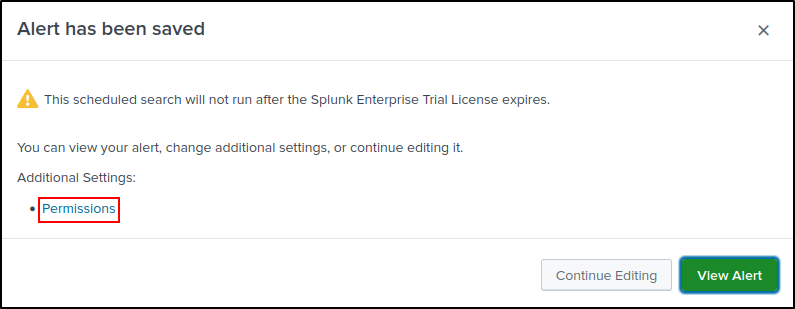
Click Permissions
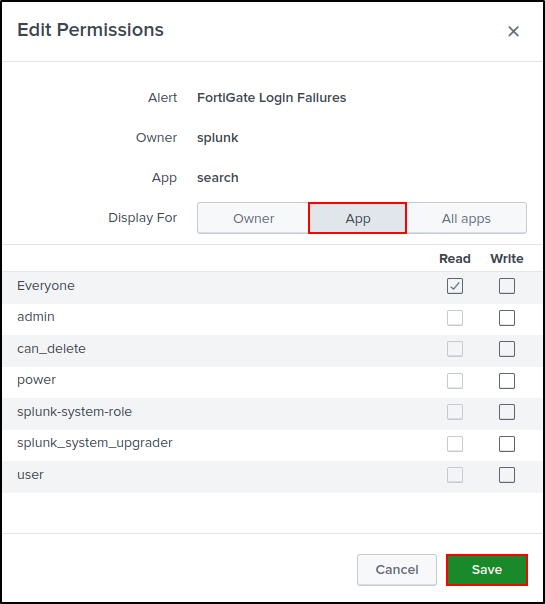
Select Display For App. Assign Read access to Everyone. Click Save.
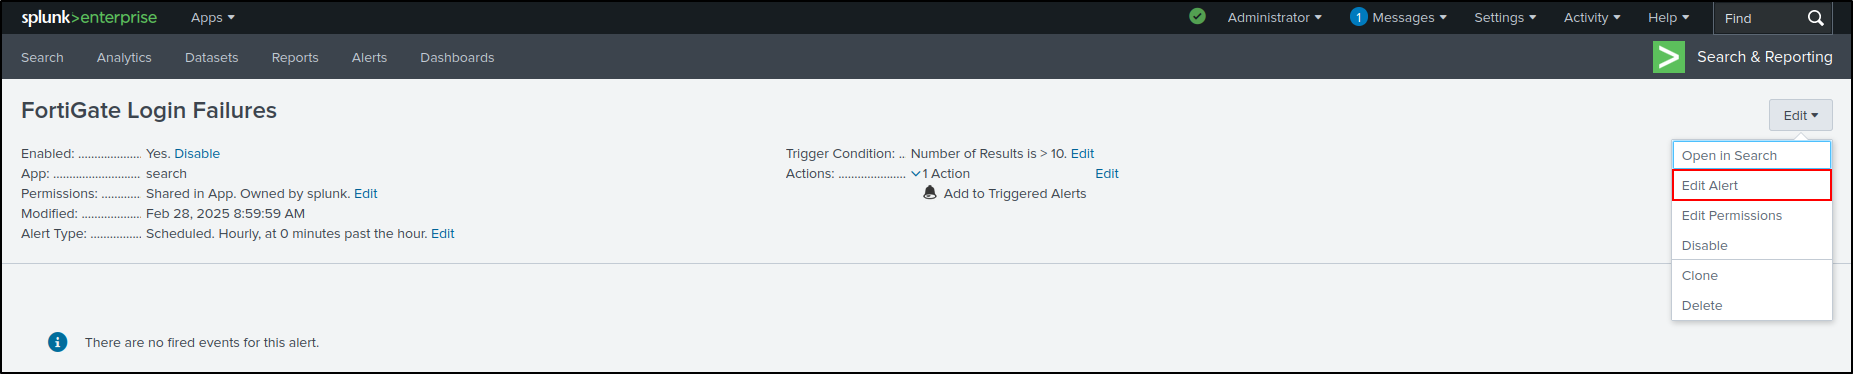
Select Edit Alert again
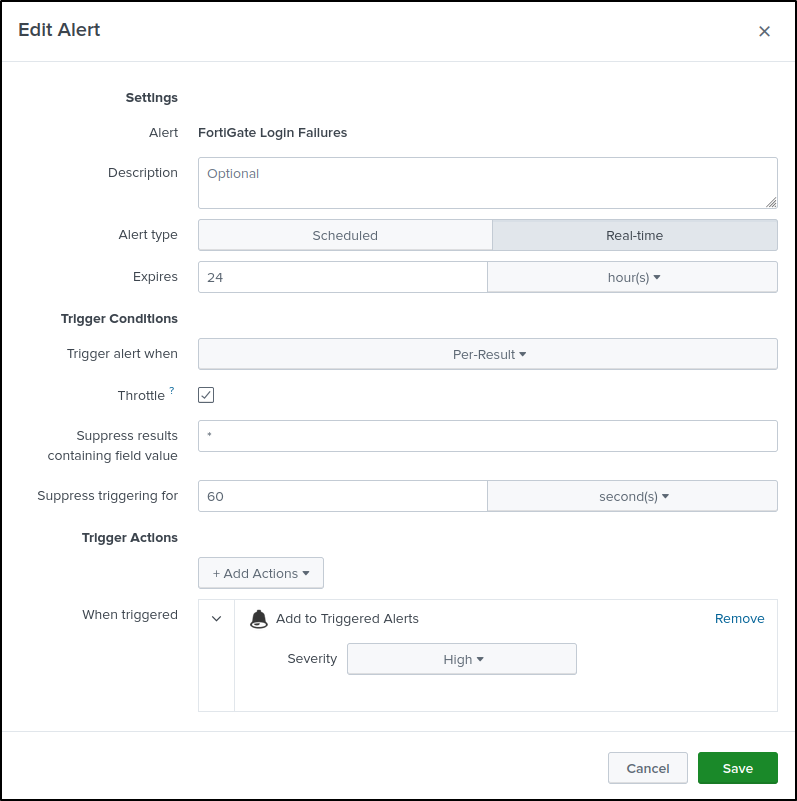
For an exact reproduction of the PoC, change the alert type to Real-time and
suppress matching field values with *, then save.
Prefer scheduled alerts outside this demonstration
Real-time searches consume continuous resources. Use a scheduled alert with an appropriate lookback window unless the use case genuinely requires immediate evaluation.
Click Triggered Alerts.
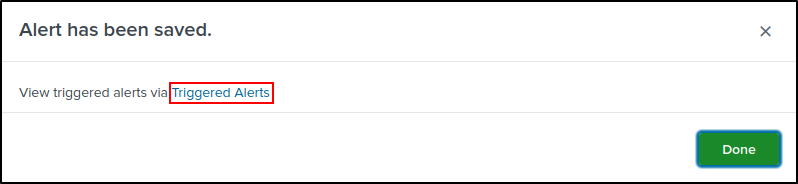
Alternatively, Triggered Alerts can be viewed on the Activity tab (Activity > Triggered Alerts). If you don’t see your alerts, manually trigger alerts by running Hydra on Kali VM.

Alerts and Reports can also be viewed from Setting > Searches, reports, and alerts

Creating Dashboards
See also: Creating a classic Splunk dashboard.
On Splunk Enterprise web UI, search for login failed events on FortiGate.
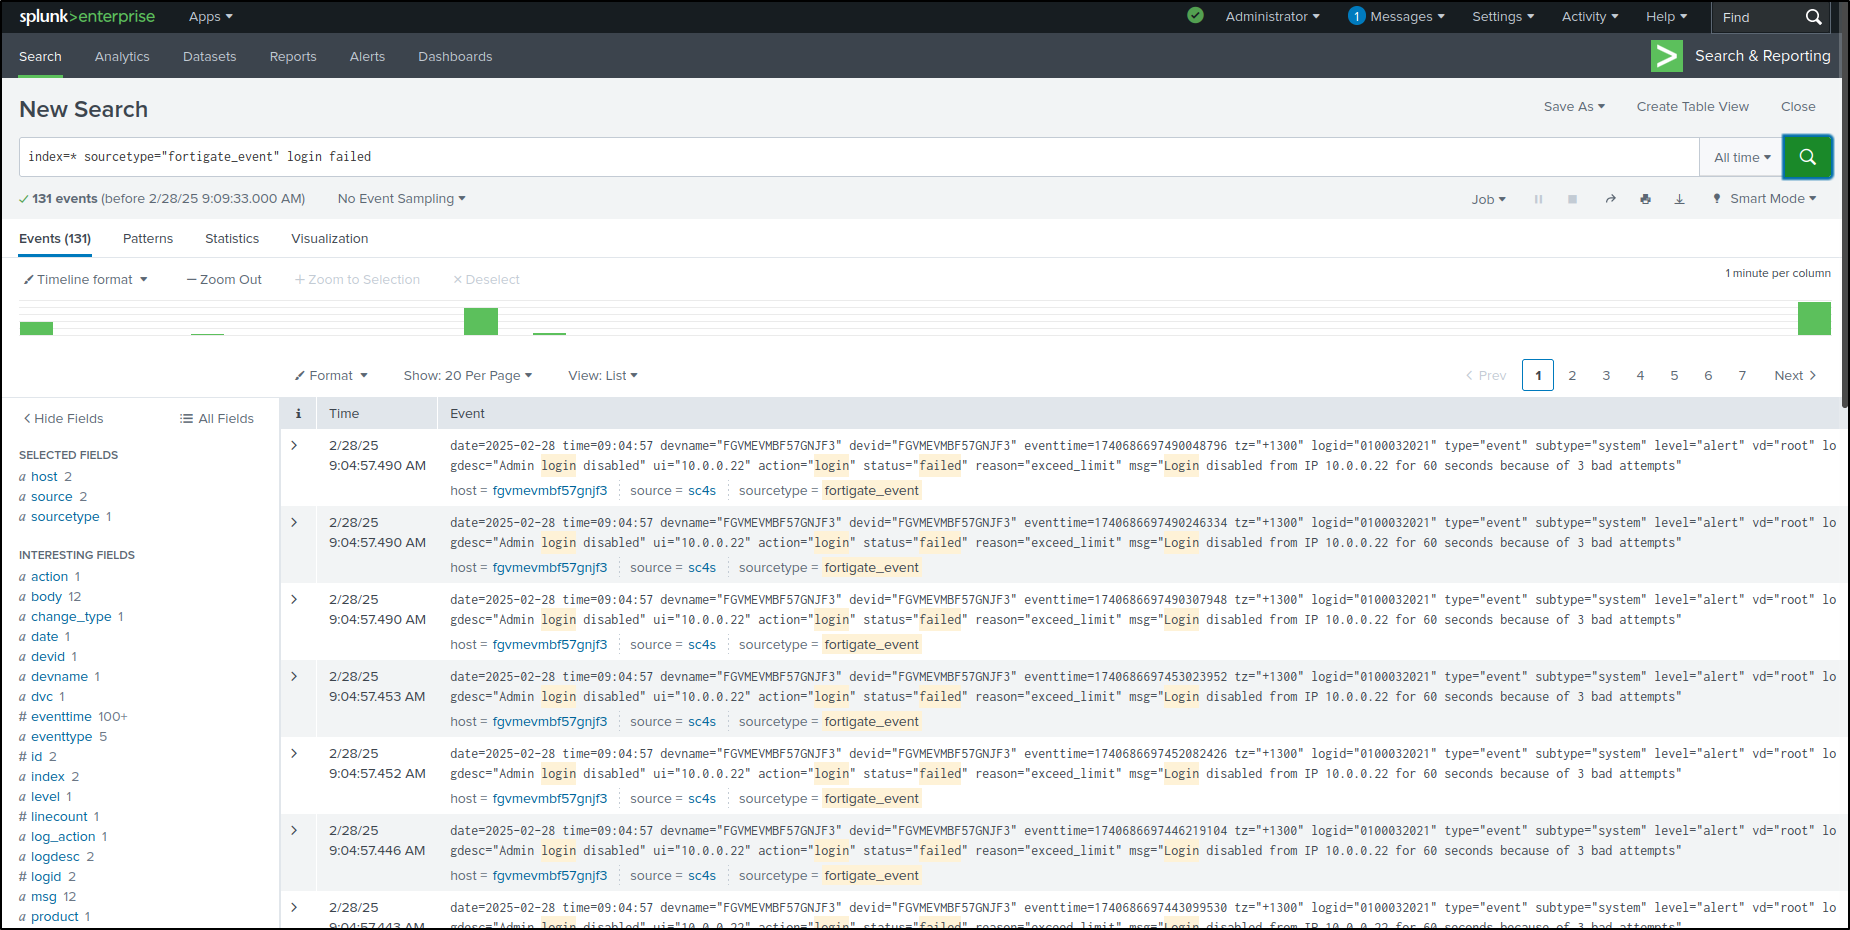
From the Interesting Fields panel, Select more fields.
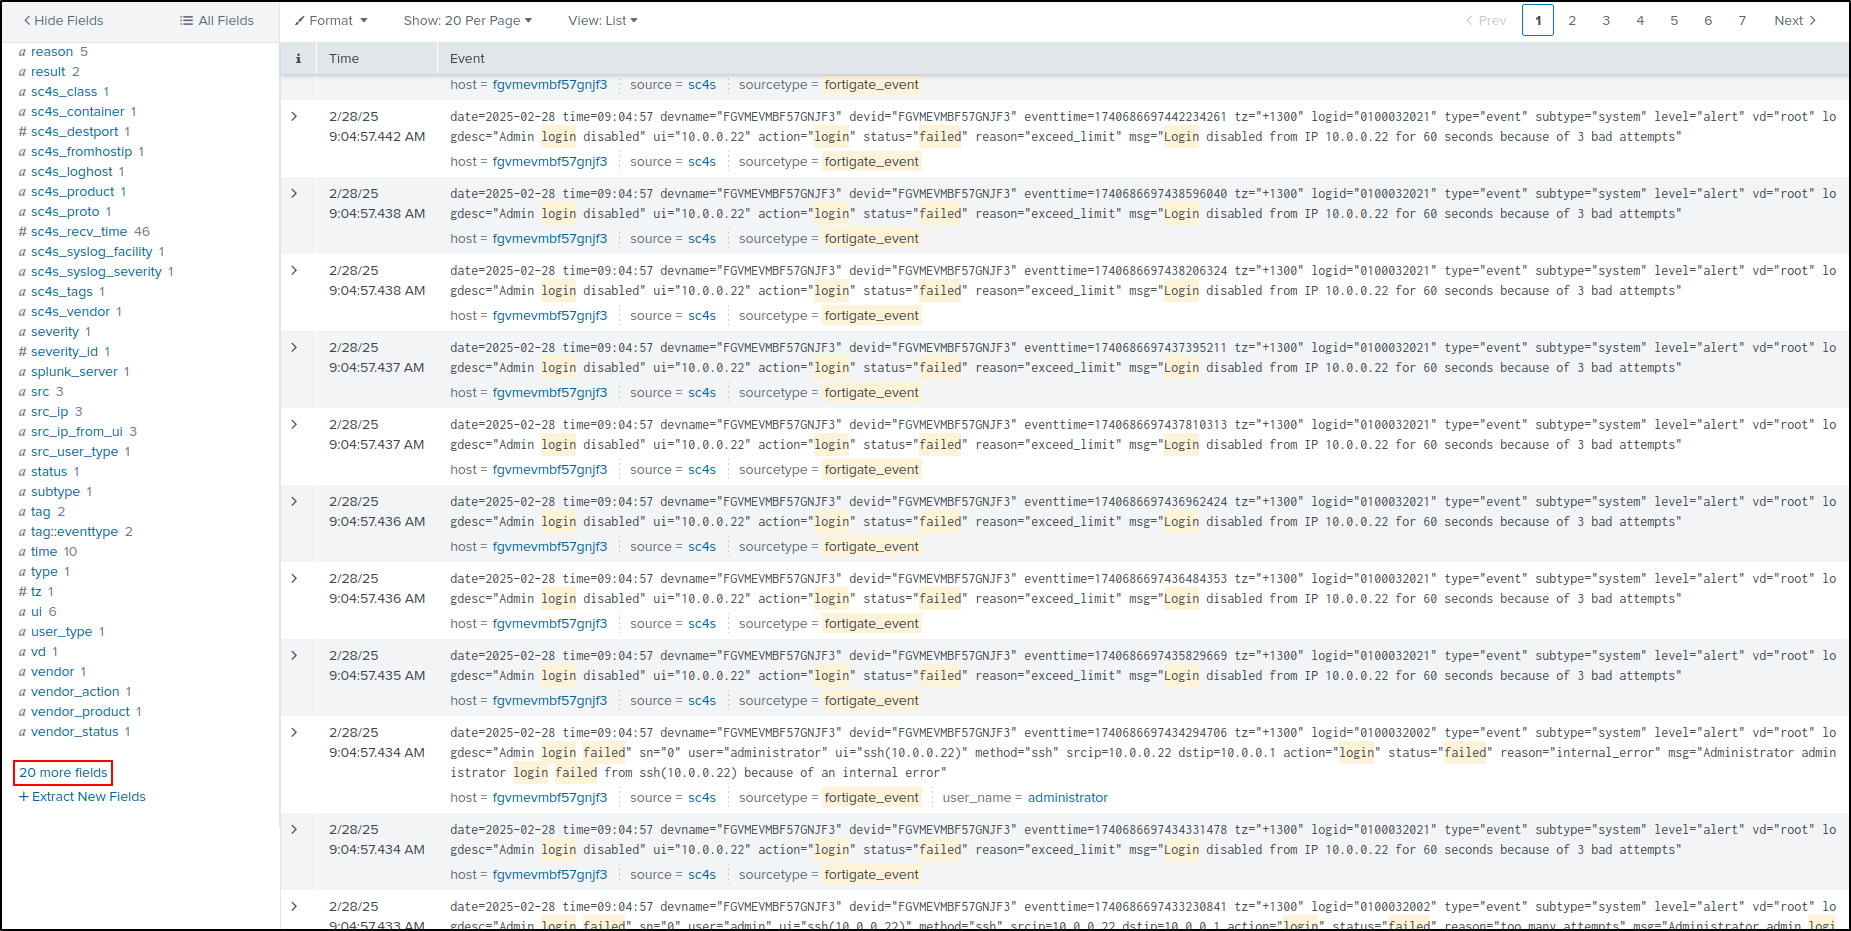
Search for user and select user_name, then close the window.

The selected user_name field should now appear in the selected fields. Select user_name then top values.
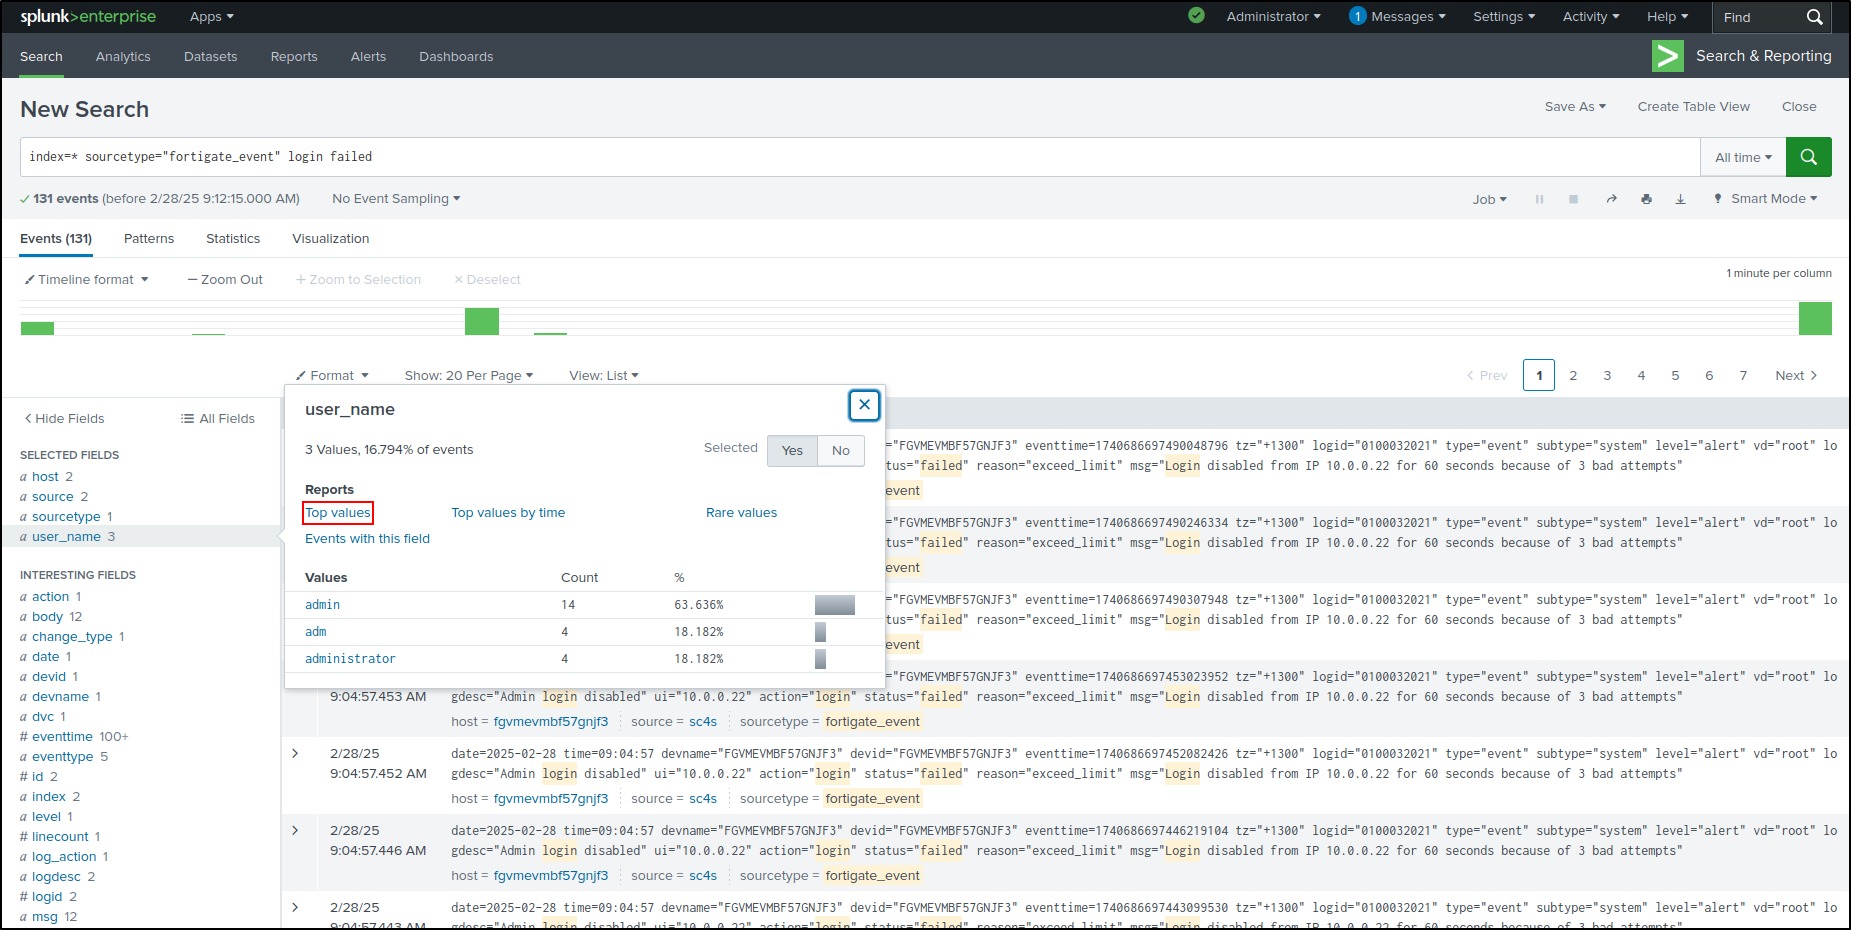
This will generate a Visualisation that is most suitable for our data.
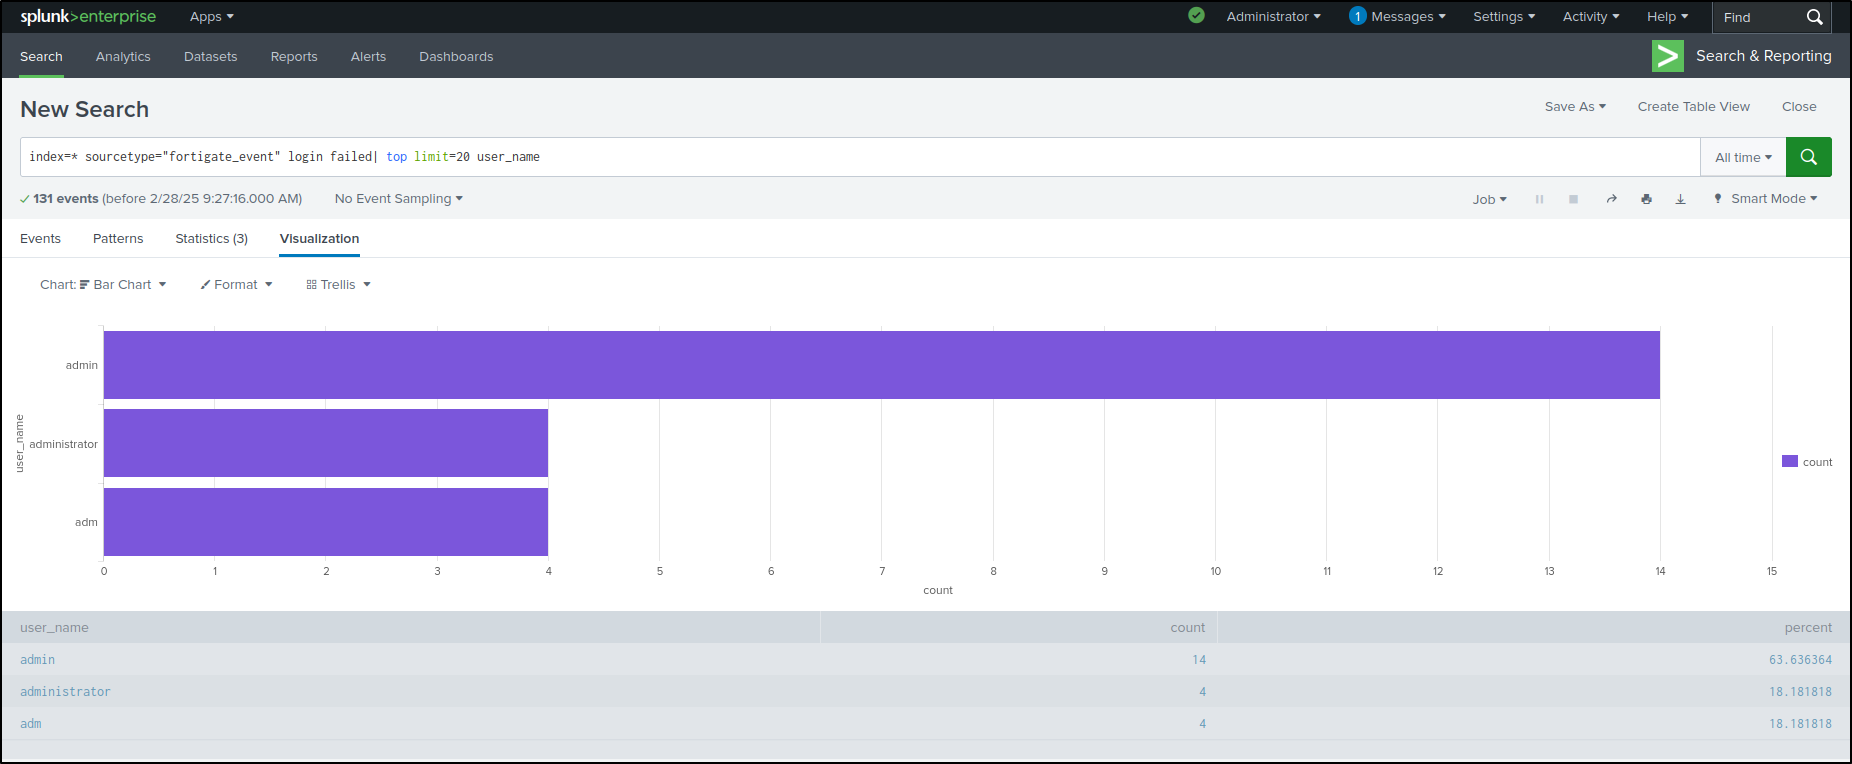
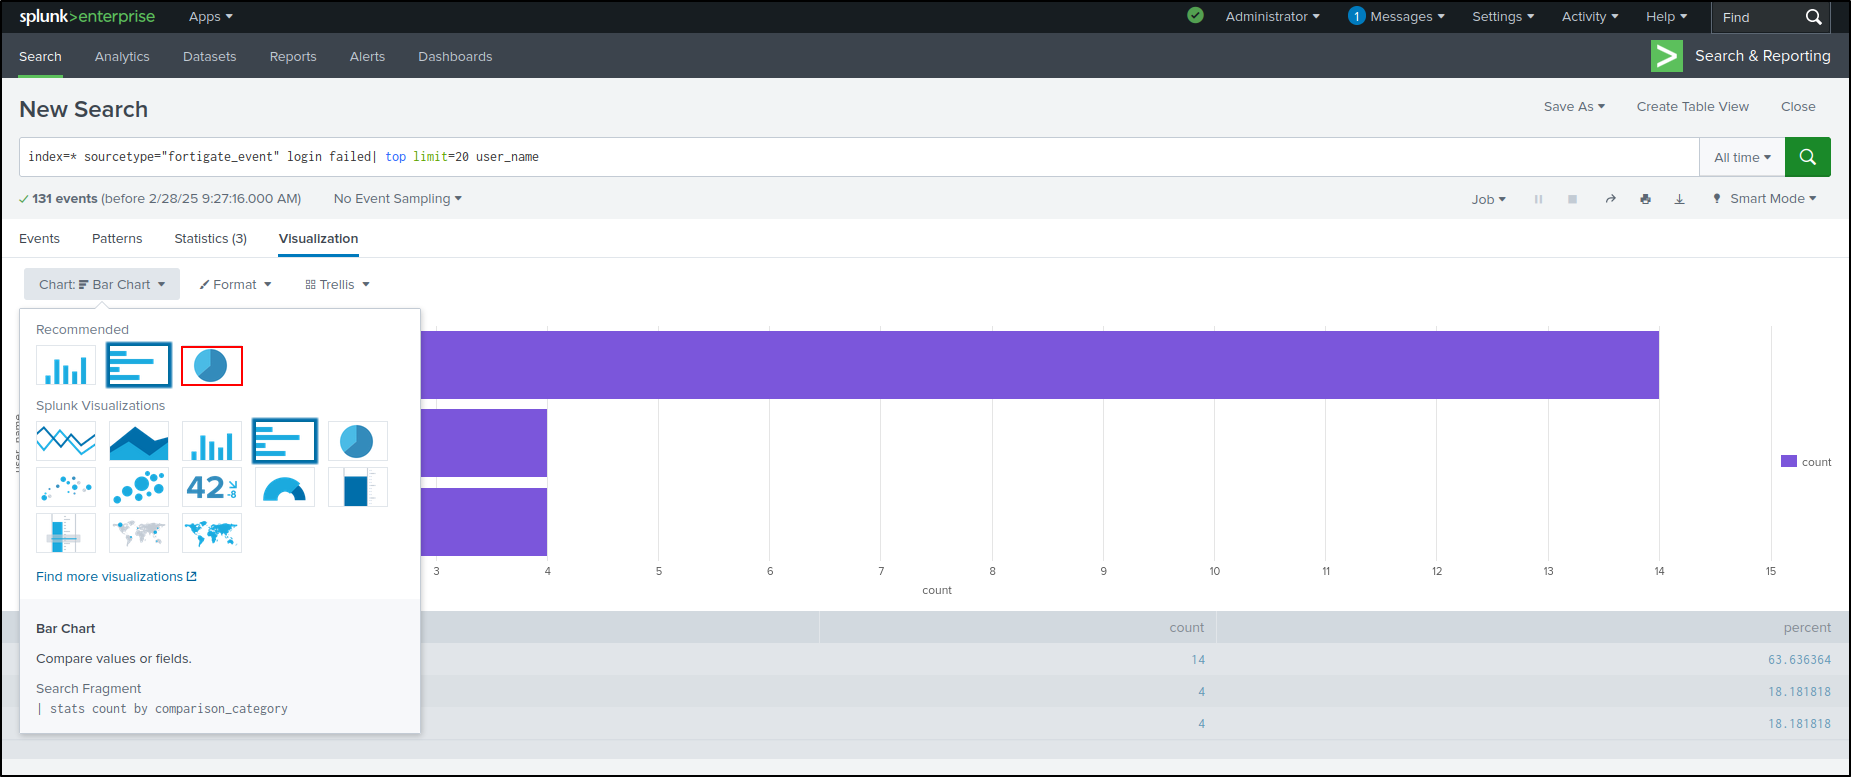
Select Bar Chart and select Pie Chart.
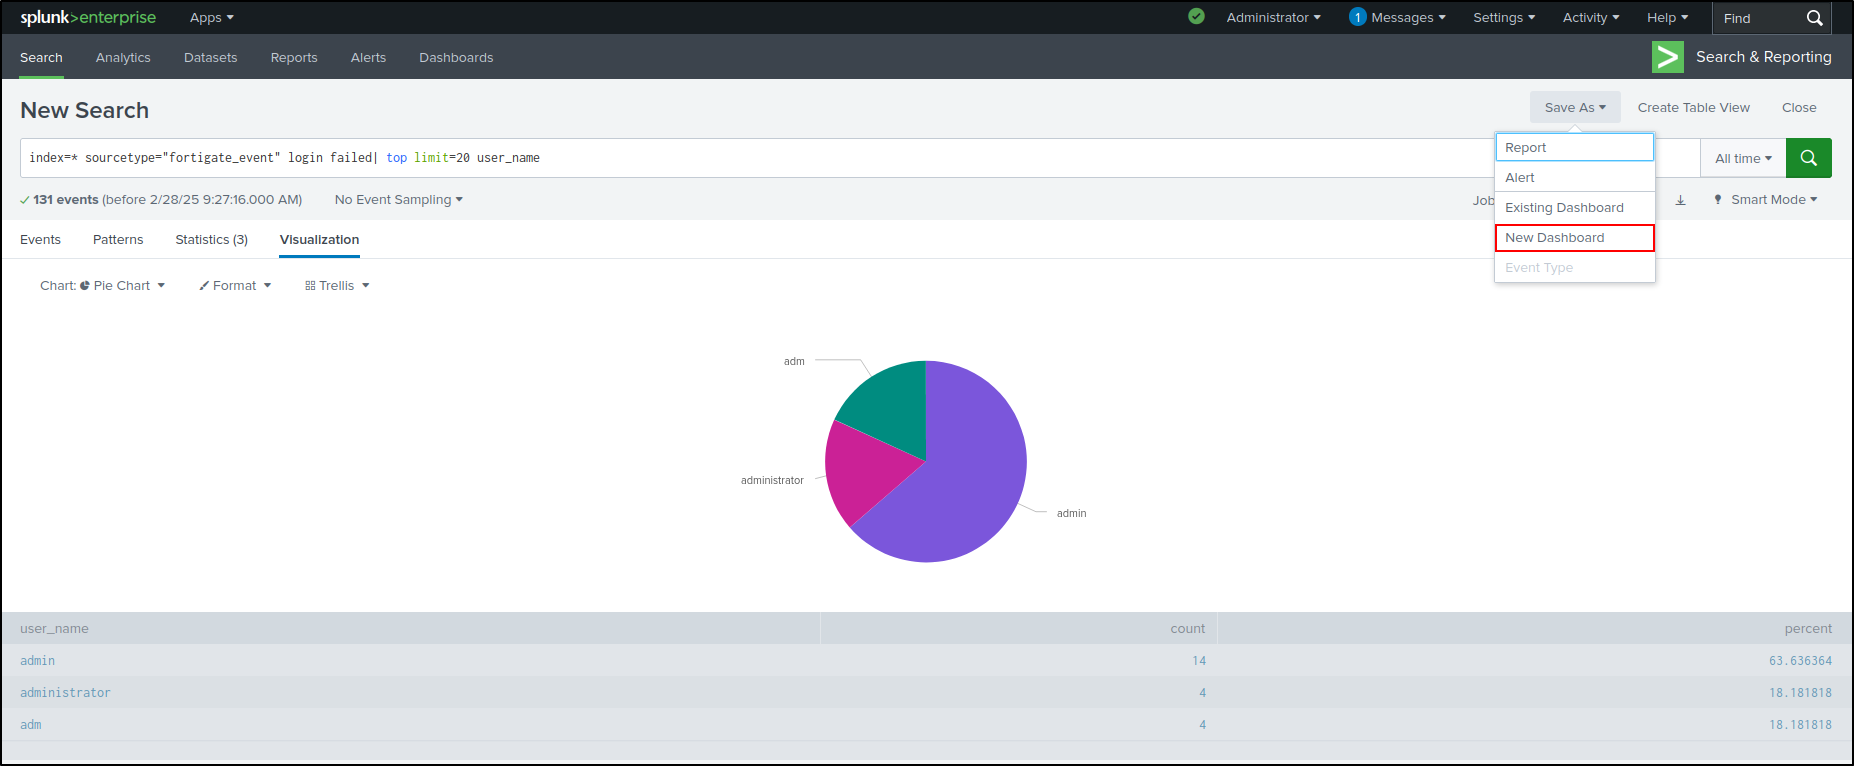
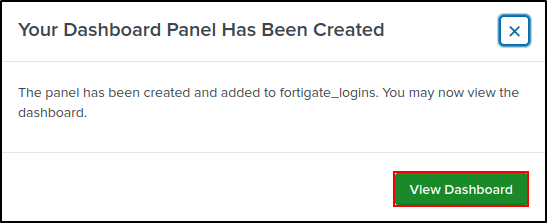
Select Save As, then New Dashboard.
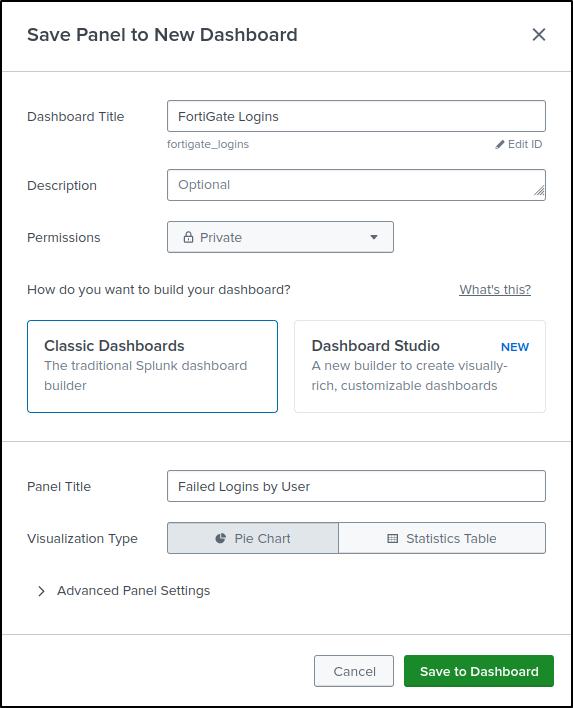
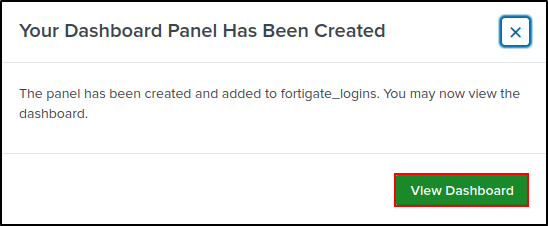
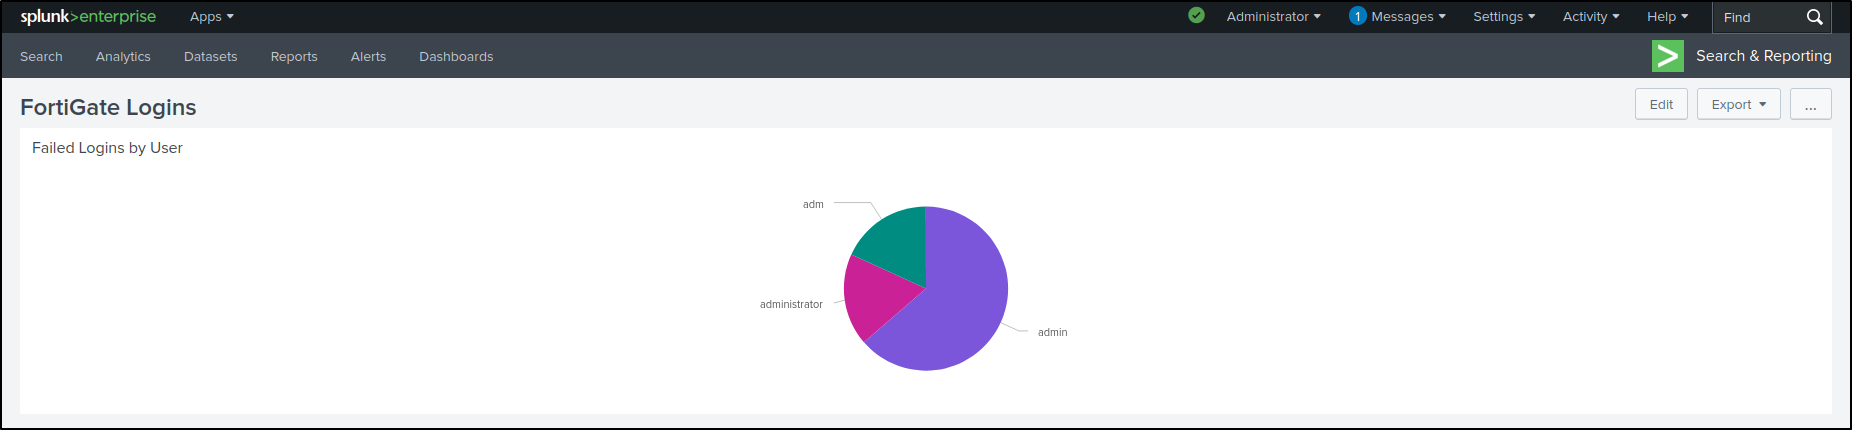
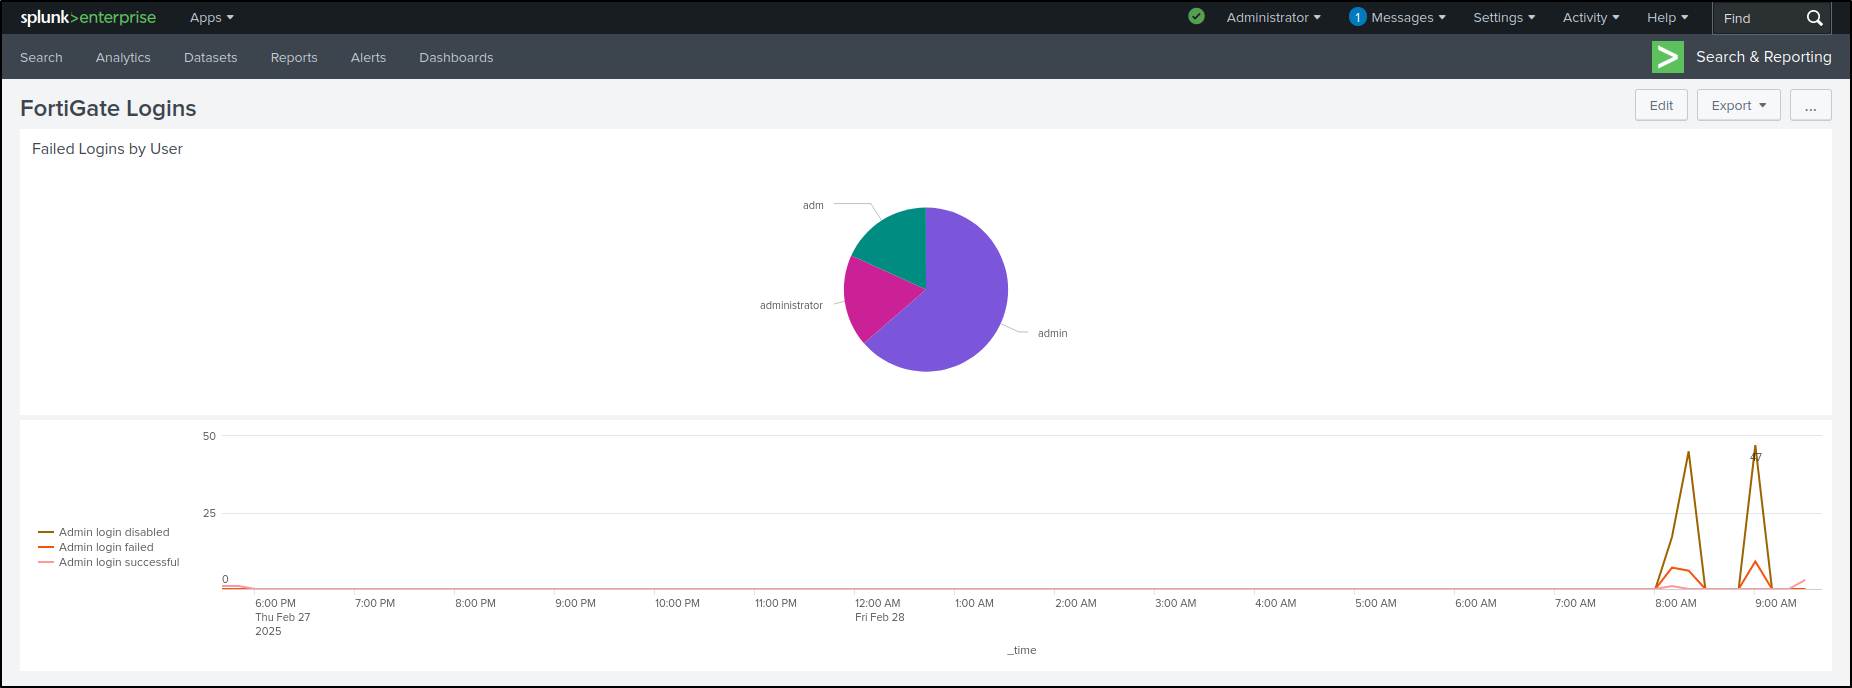
Set Dashboard Title as “FortiGate Logins” and leave Permissions as Private. Select Classic Dashboards (we will explore Dashboard Studio later). Set Panel Title as “Failed Logins by User.” Set Visualization Type as Pie Chart. Save to Dashboard.
View Dashboard
Go back to Search and search for FortiGate login events (not login failed).
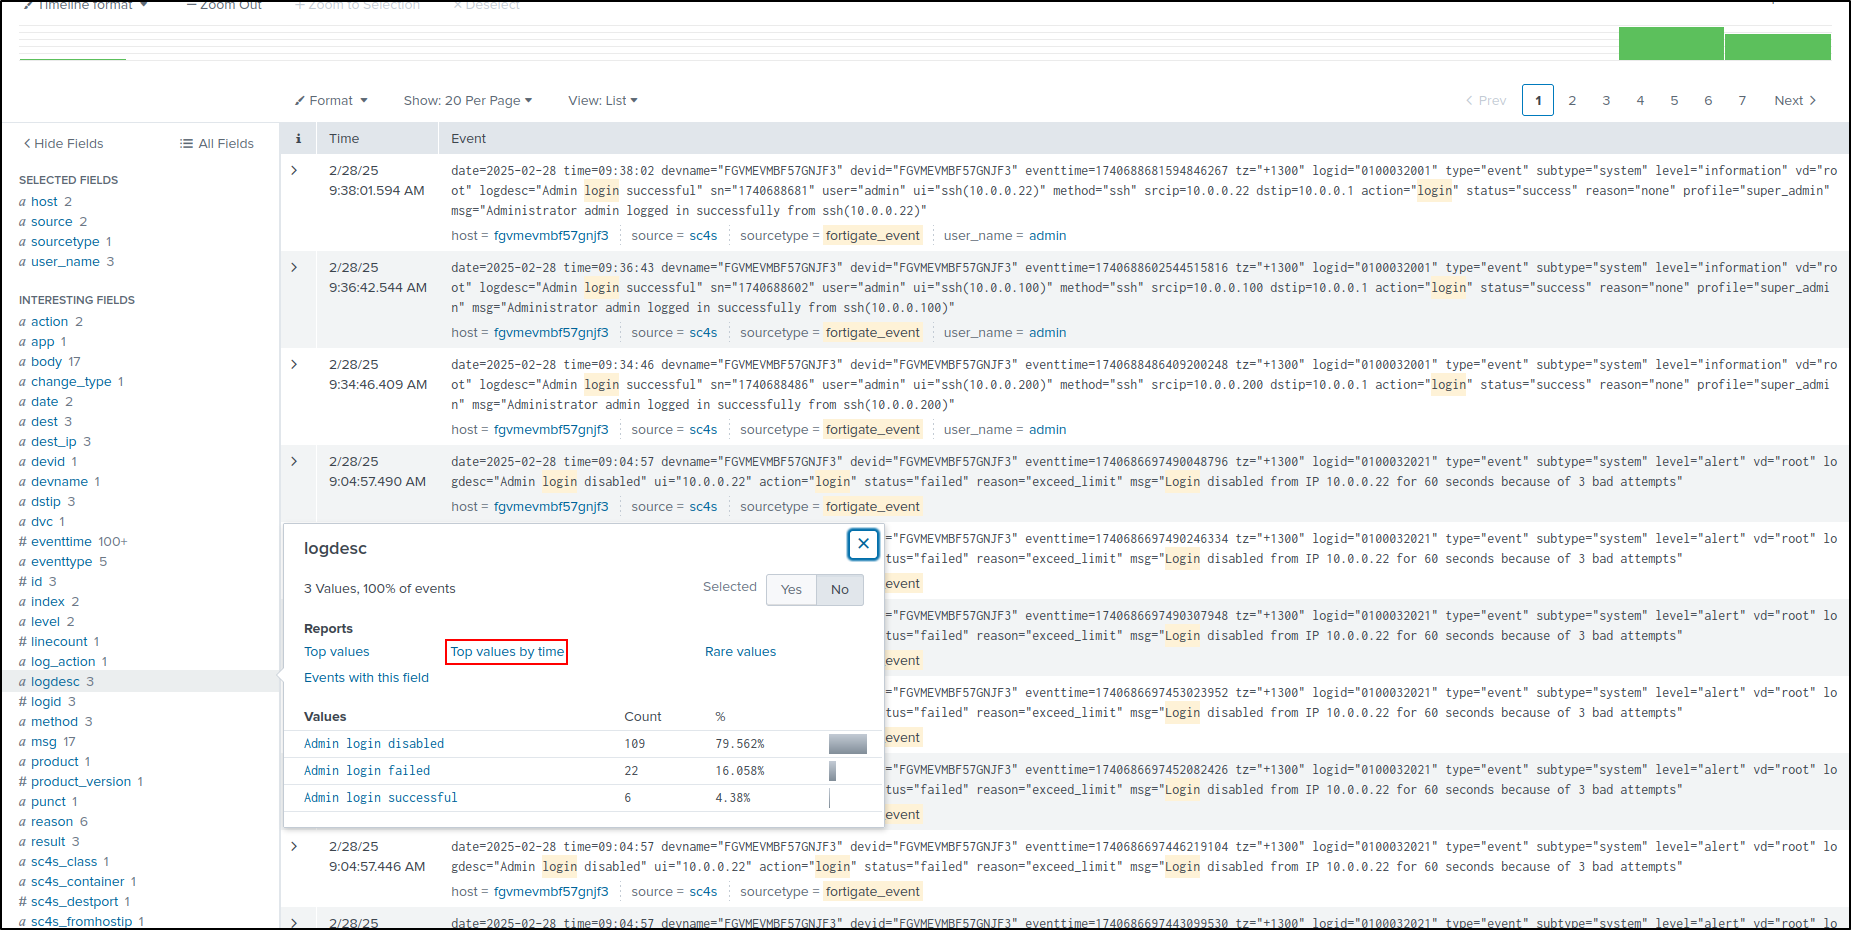
In the Interesting Fields panel, select logdesc, then Top values by time
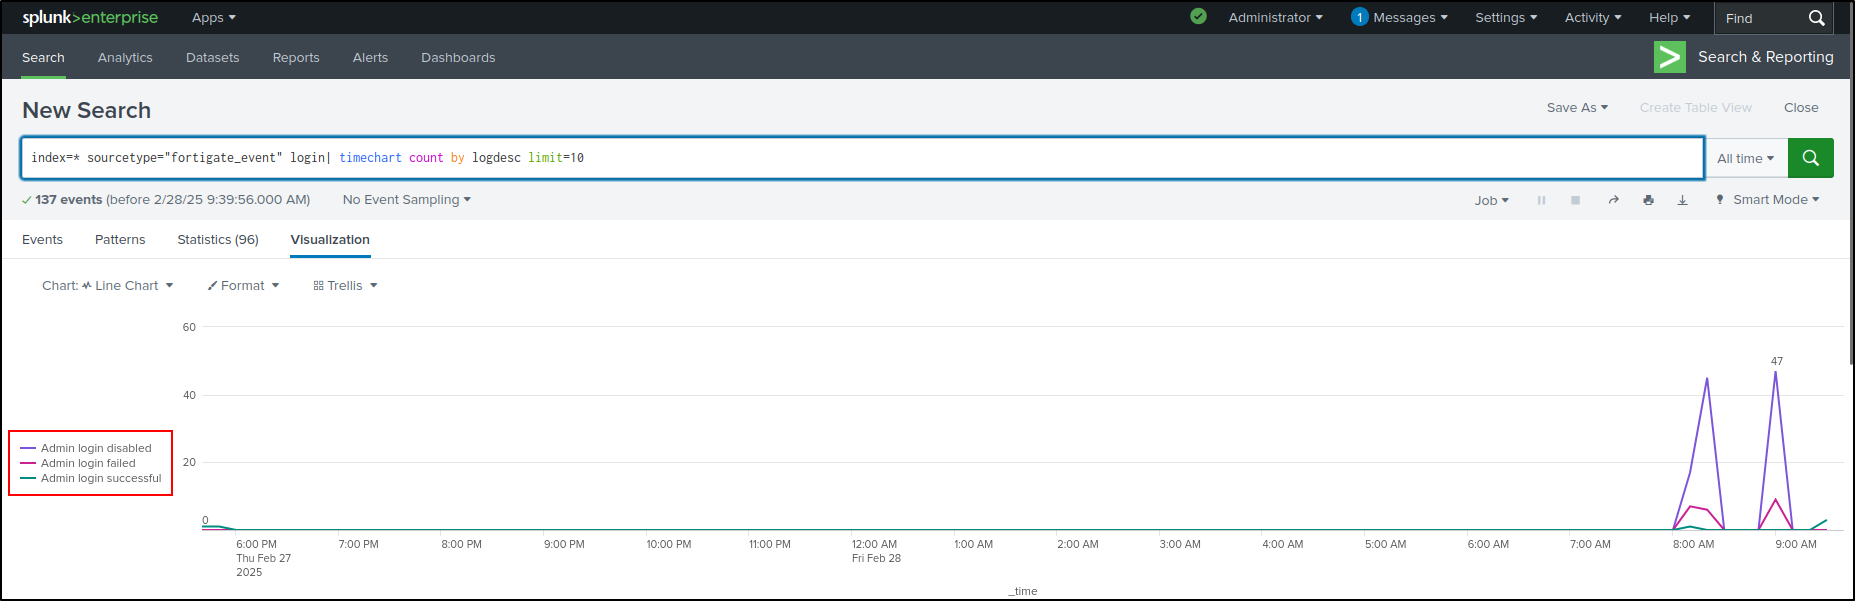
This shows the login trends over time as a line chart.
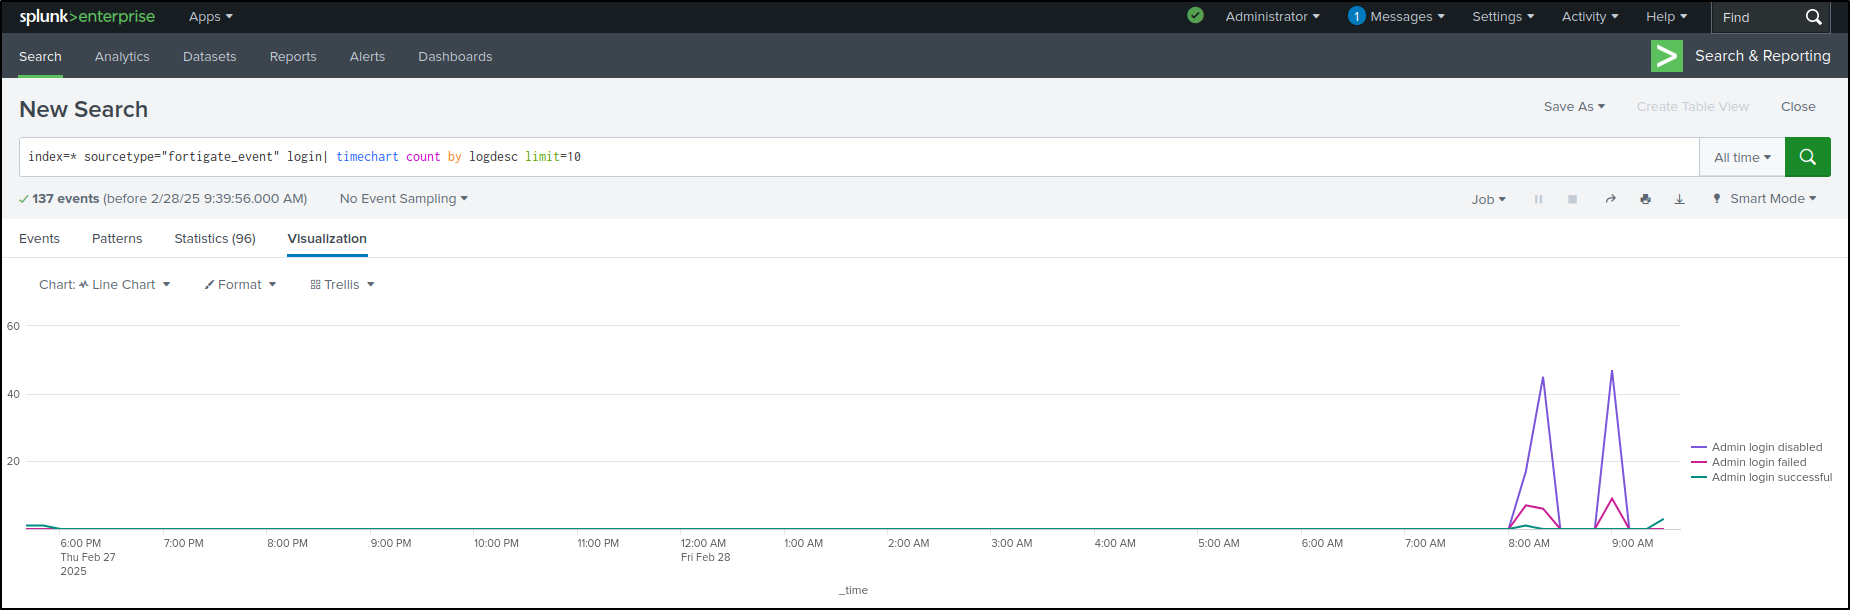
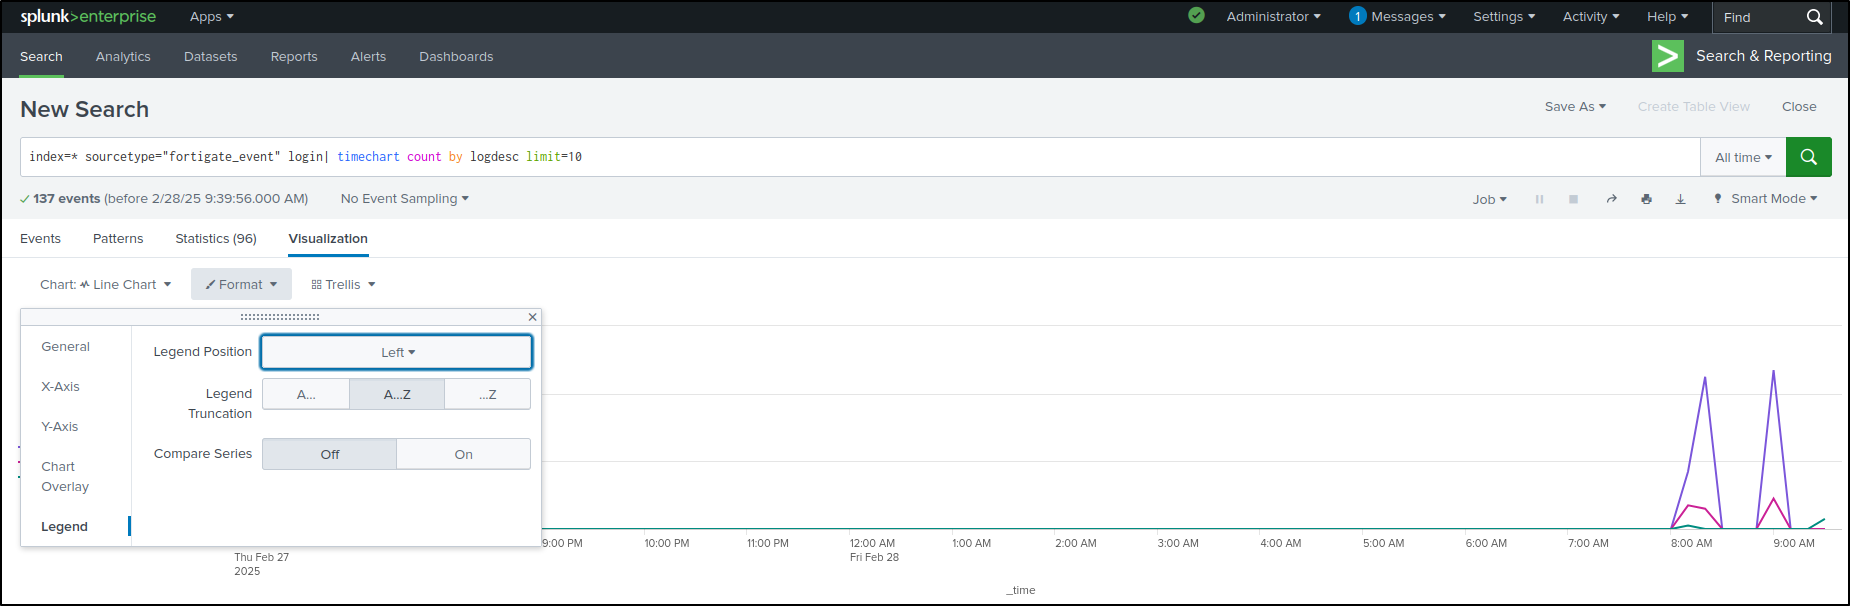
Select Format, then Legend. Select Legend Position as Left. This positions the legend to the left.
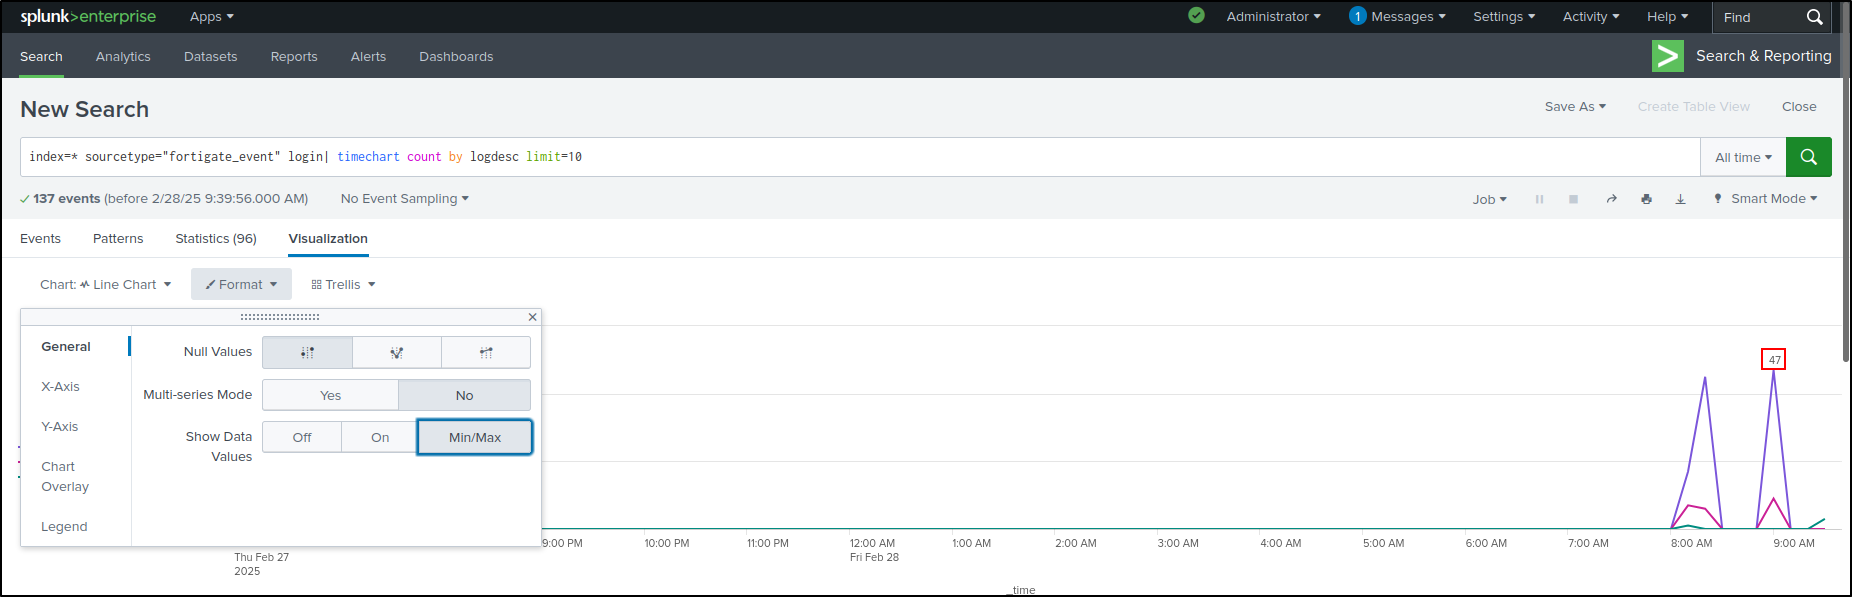
Select General. Select Min/Max in Show Data Values. This shows data values on the peak of the graph.
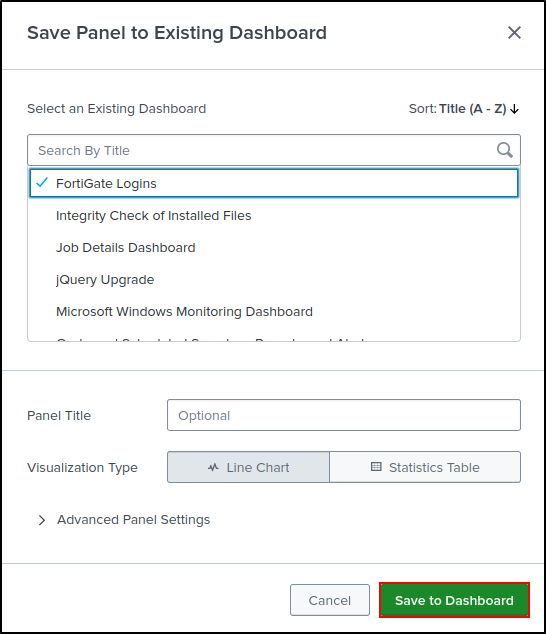
Save As Existing Dashboard. Select FortiGate Logins. Save to Dashboard.
View Dashboard
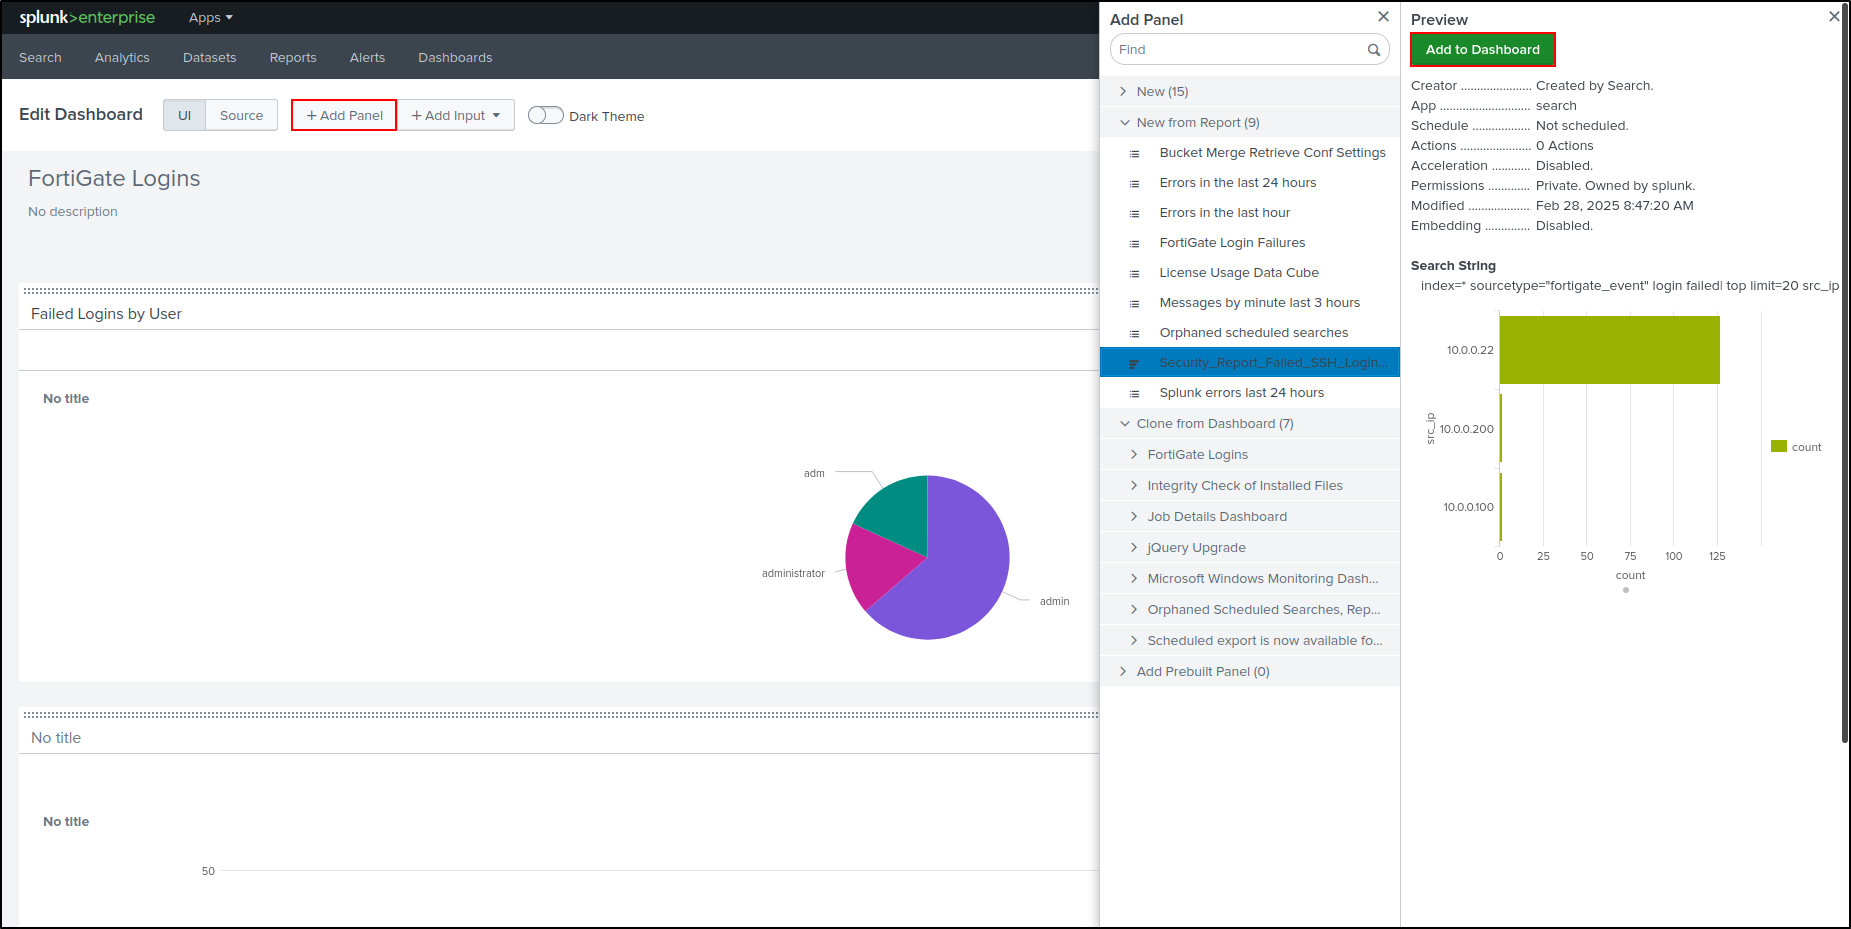
Click Edit on top right. Add Panel. Select New from Report. Select Security_Report_Failed_SSH_Login_Attempts. Select Add to Dashboard
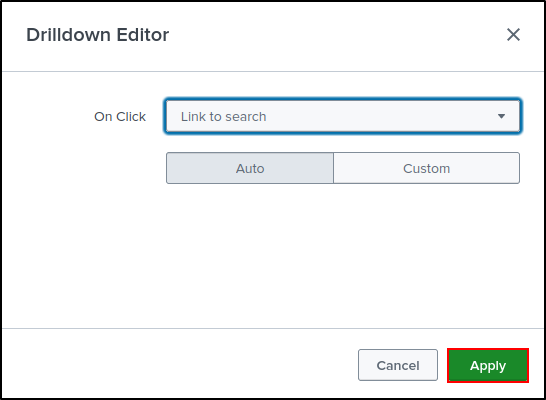
Drag and Drop Bar Chart next to the Pie Chart. Edit Drilldown on the Pie Chart.
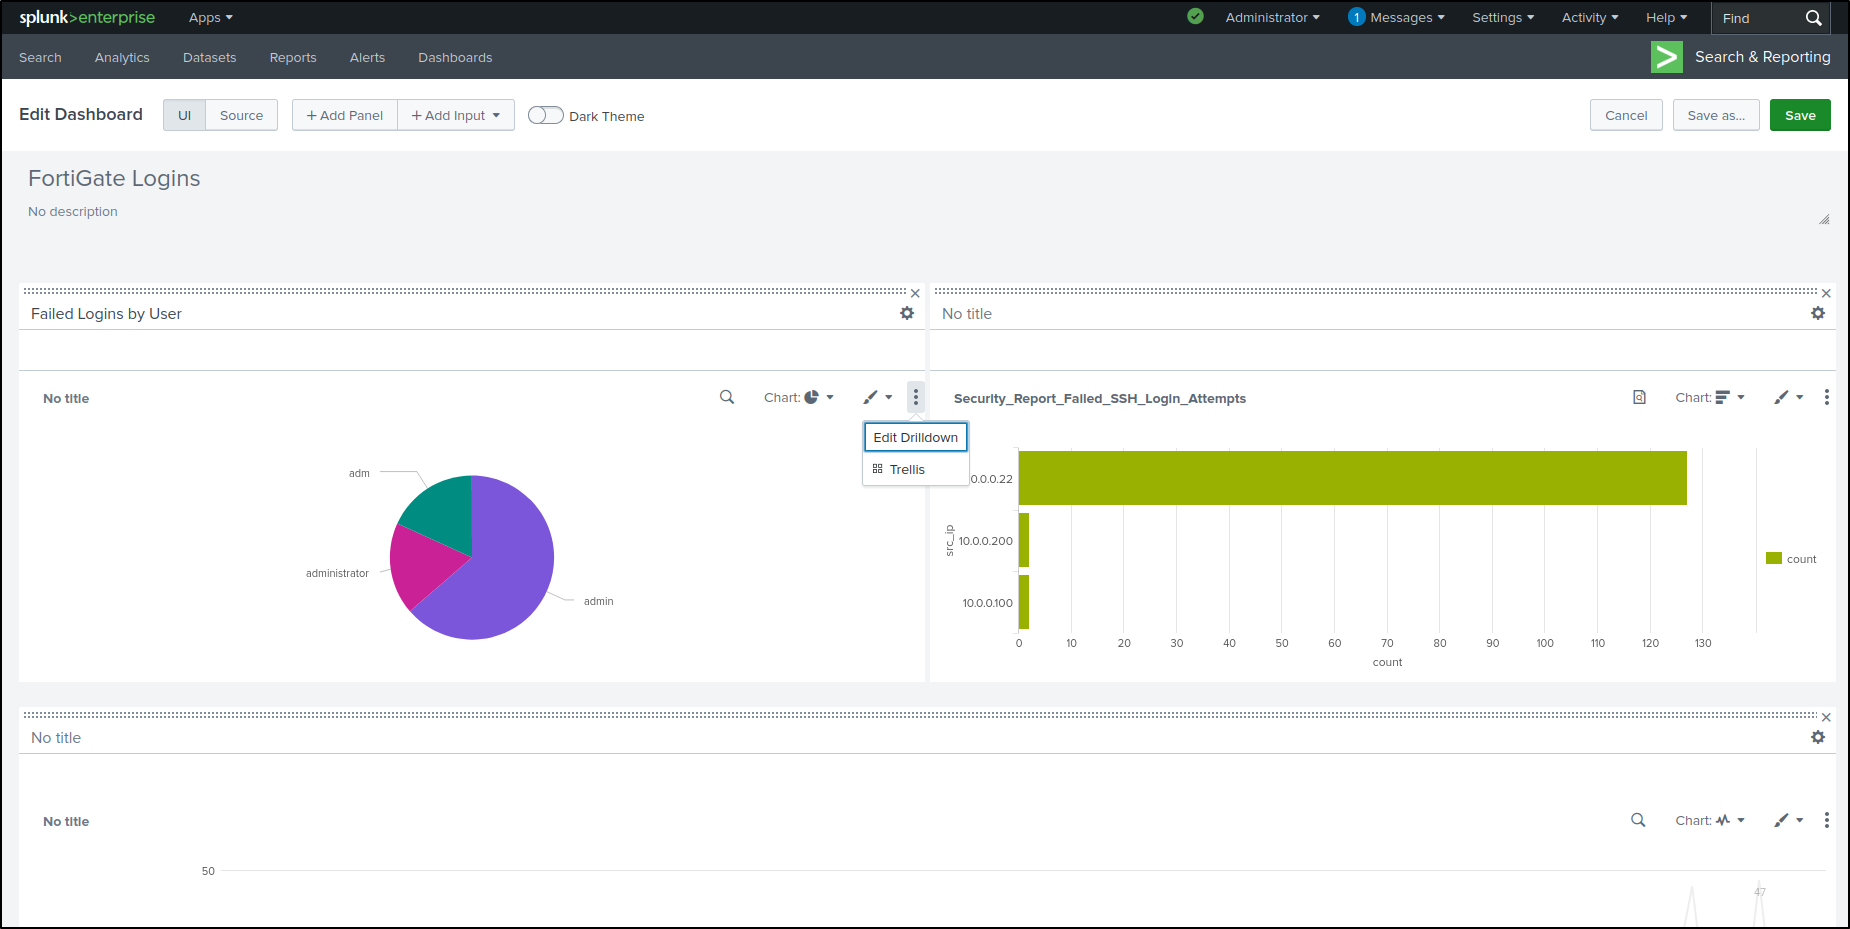
Set Drilldown Action On click to Link to Search. Click Apply.
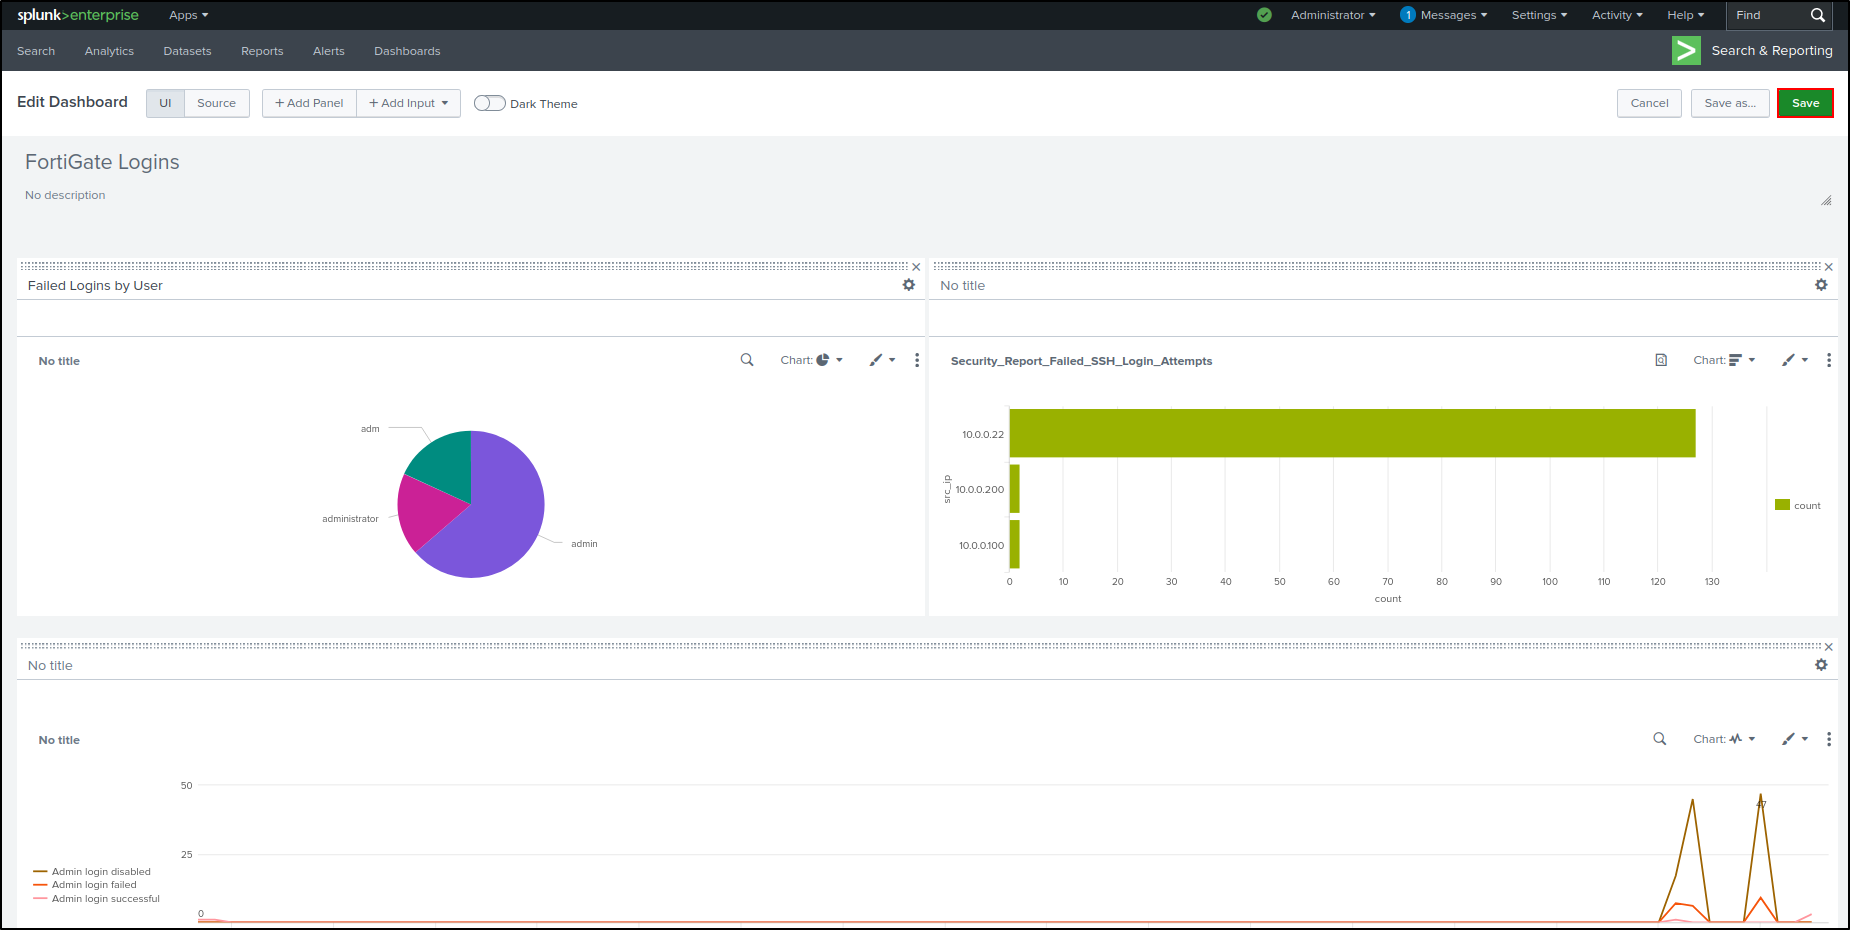
Save the Dashboard.
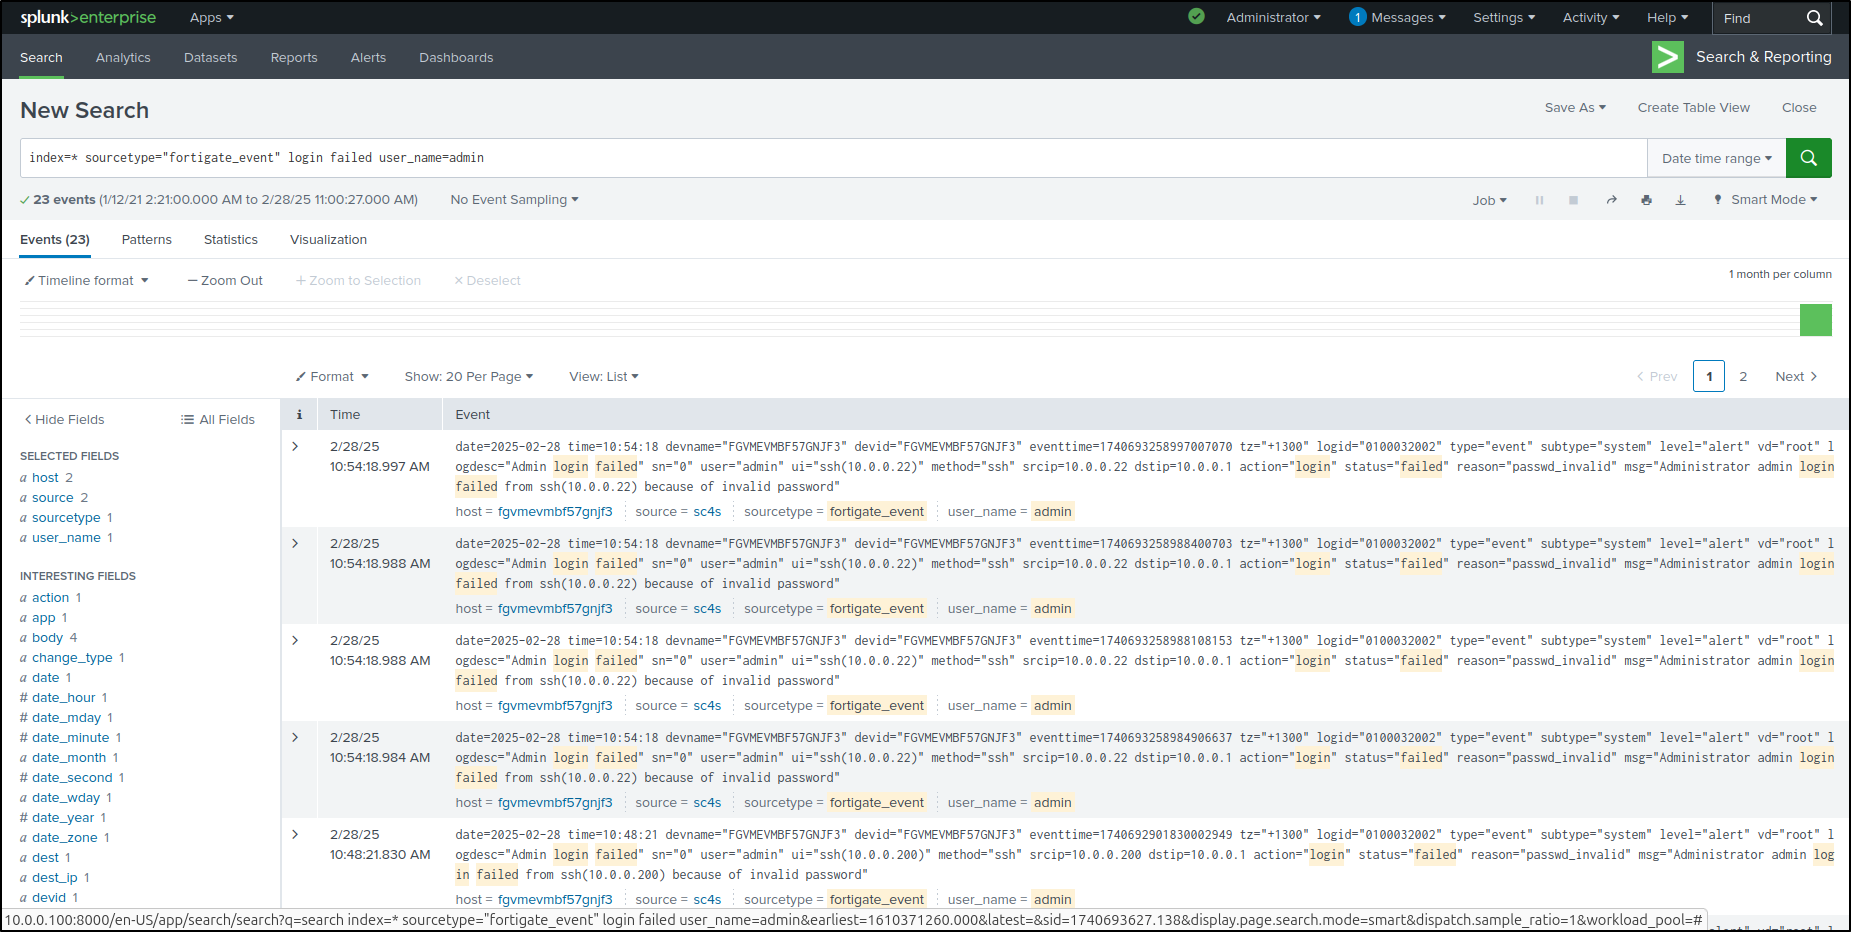
Since we configured Link to Search, clicking 'admin' on the pie chart will redirect you to the Search and Reporting page with the search query automatically populated.
Cloning in Dashboard Studio
See also: Cloning a dashboard in Dashboard Studio.
While the FortiGate Logins Dashboard is open, select Clone in Dashboard Studio.
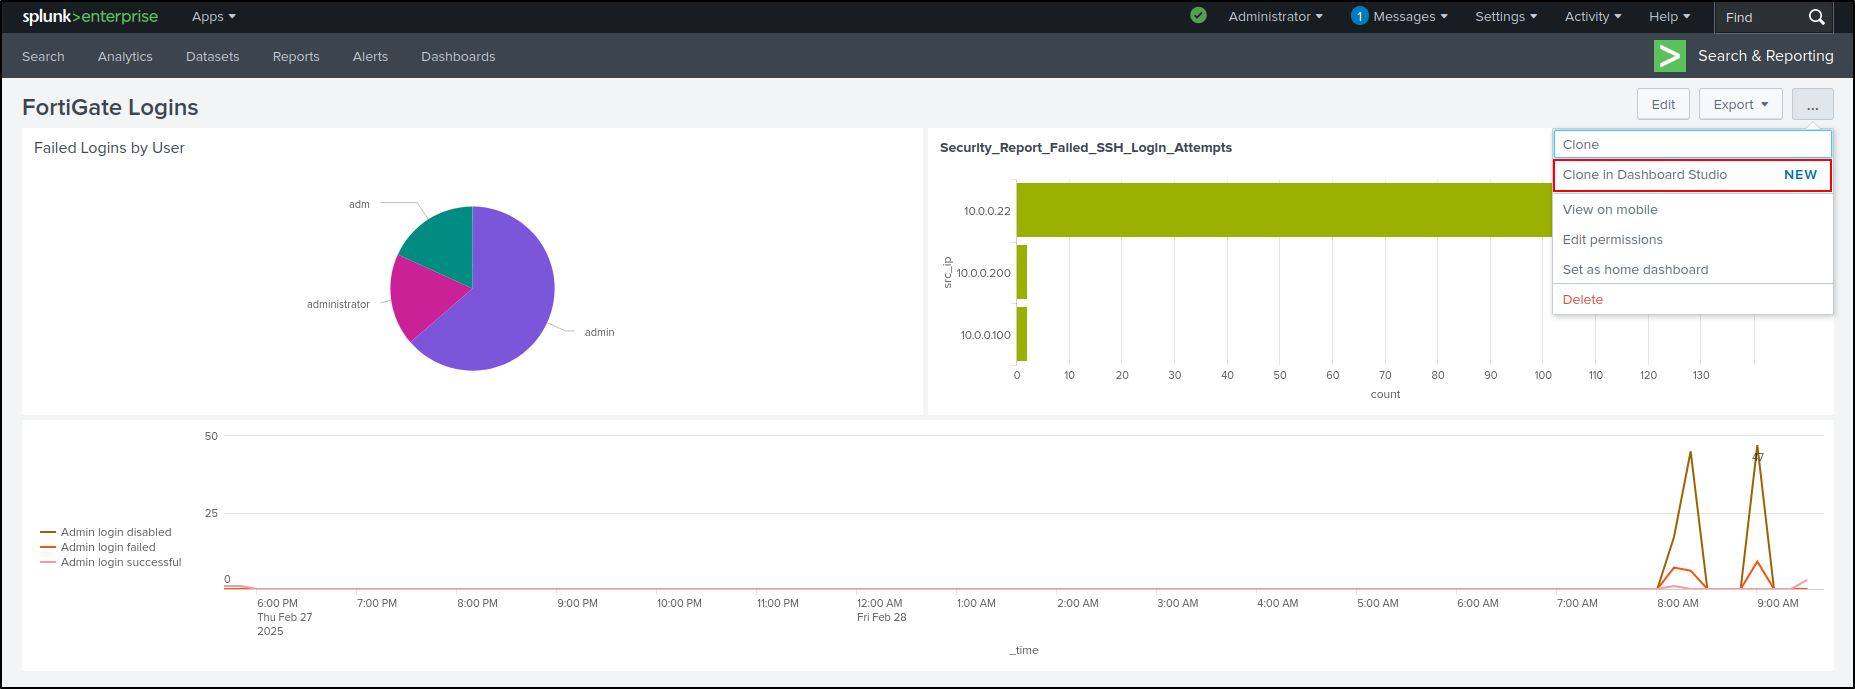
Set Title as FortiGate Logins - Dashboard Studio. Select Grid layout. Click Convert & Save.
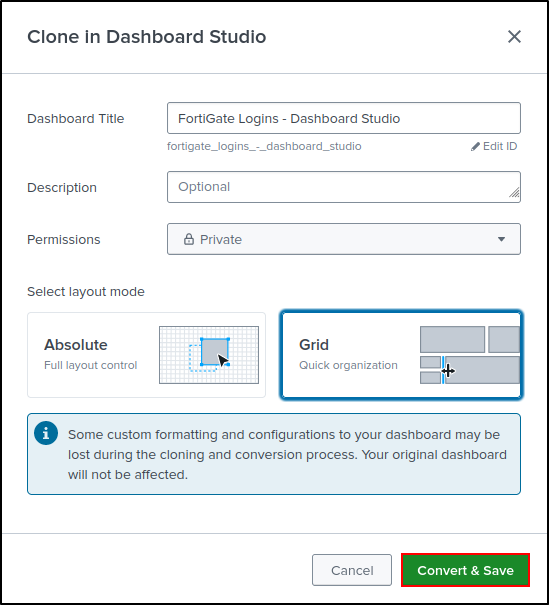
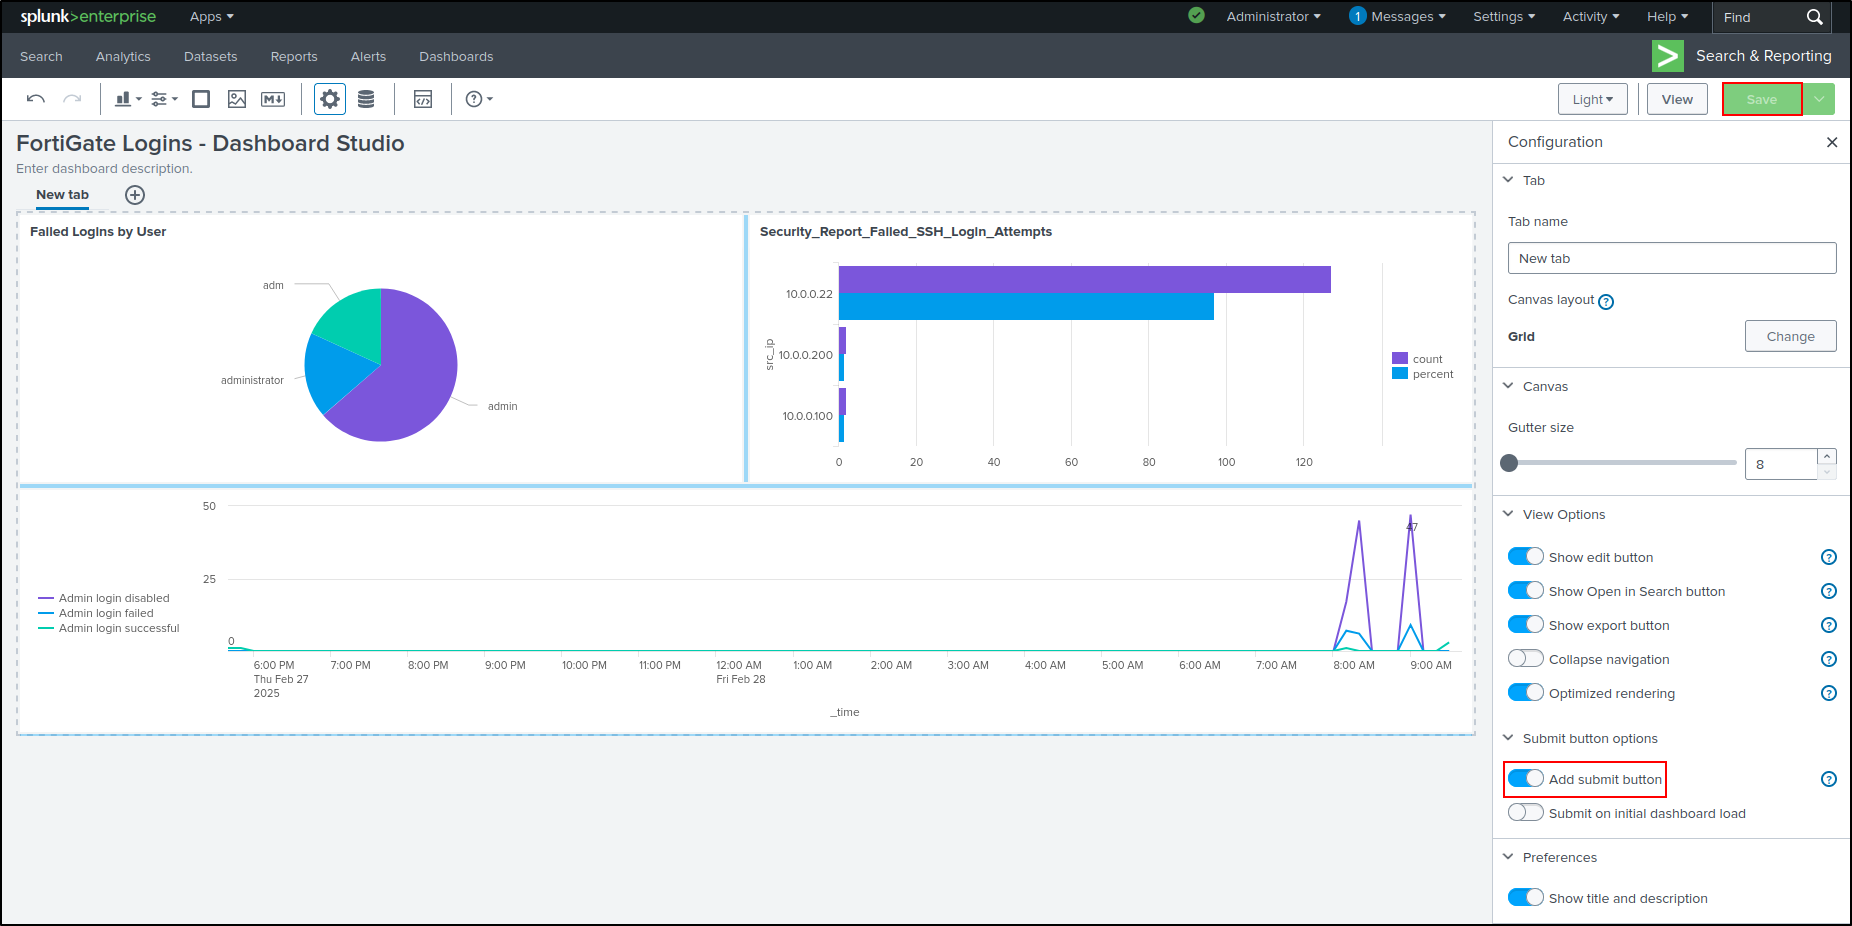
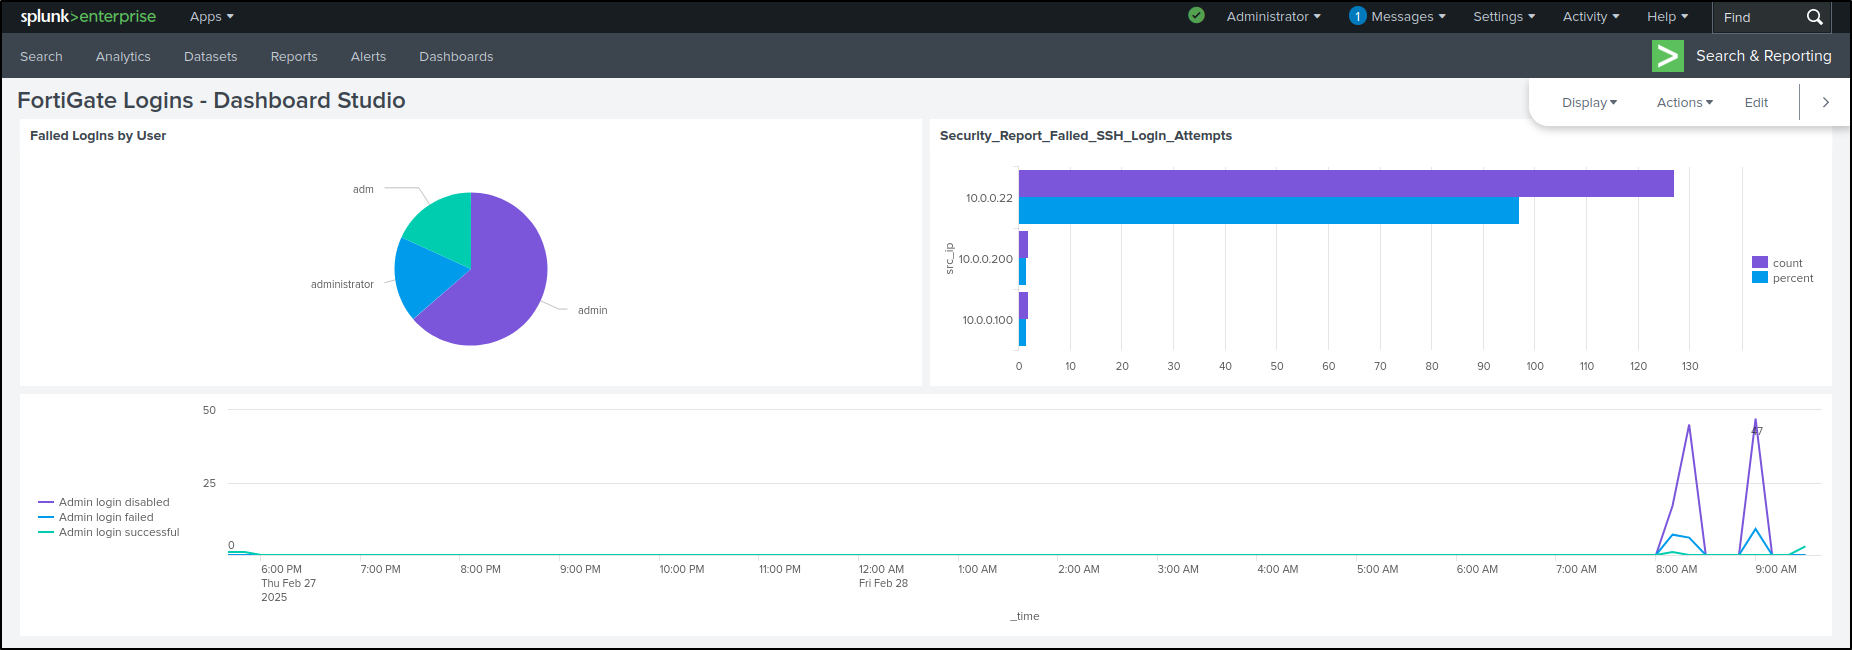
Click Save. If Save button is greyed out, toggle Add submit button then click Save. Click View. We have successfully cloned the dashboard in dashboard studio.
Additional configuration examples are available from the community Splunk scripts repository.