Collect Network Logs
Configure a network device and choose one of the demonstrated FortiGate ingestion paths: SC4S or a direct Splunk UDP input.
Configuring FortiGate
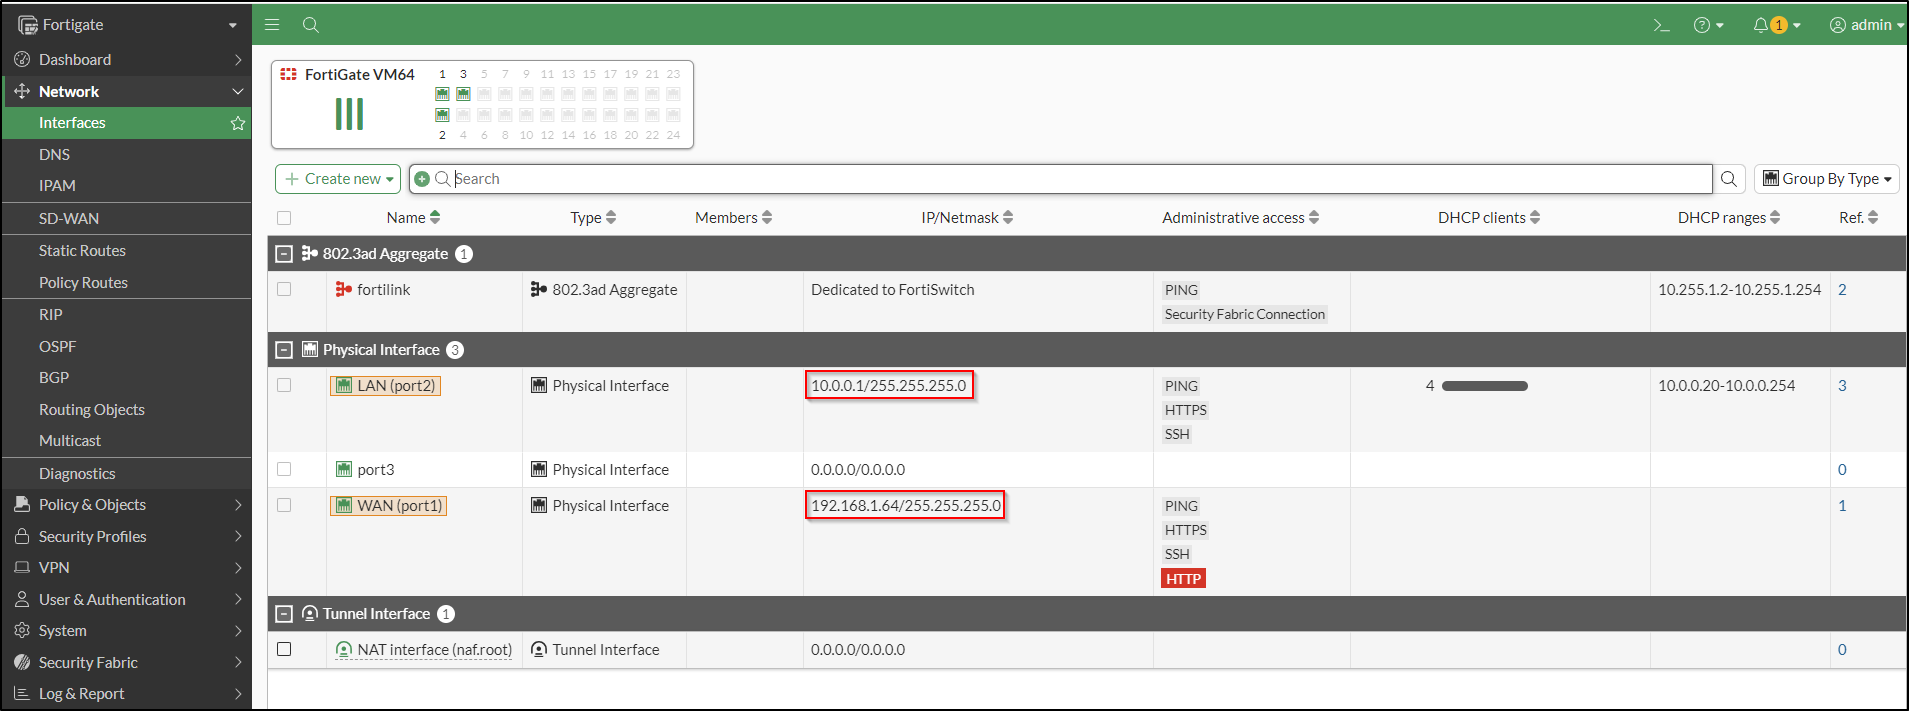
Configure Port 1 as WAN interface and Port 2 as LAN interface. Set up DHCP to automatically assign IP addresses to clients connecting to the LAN.
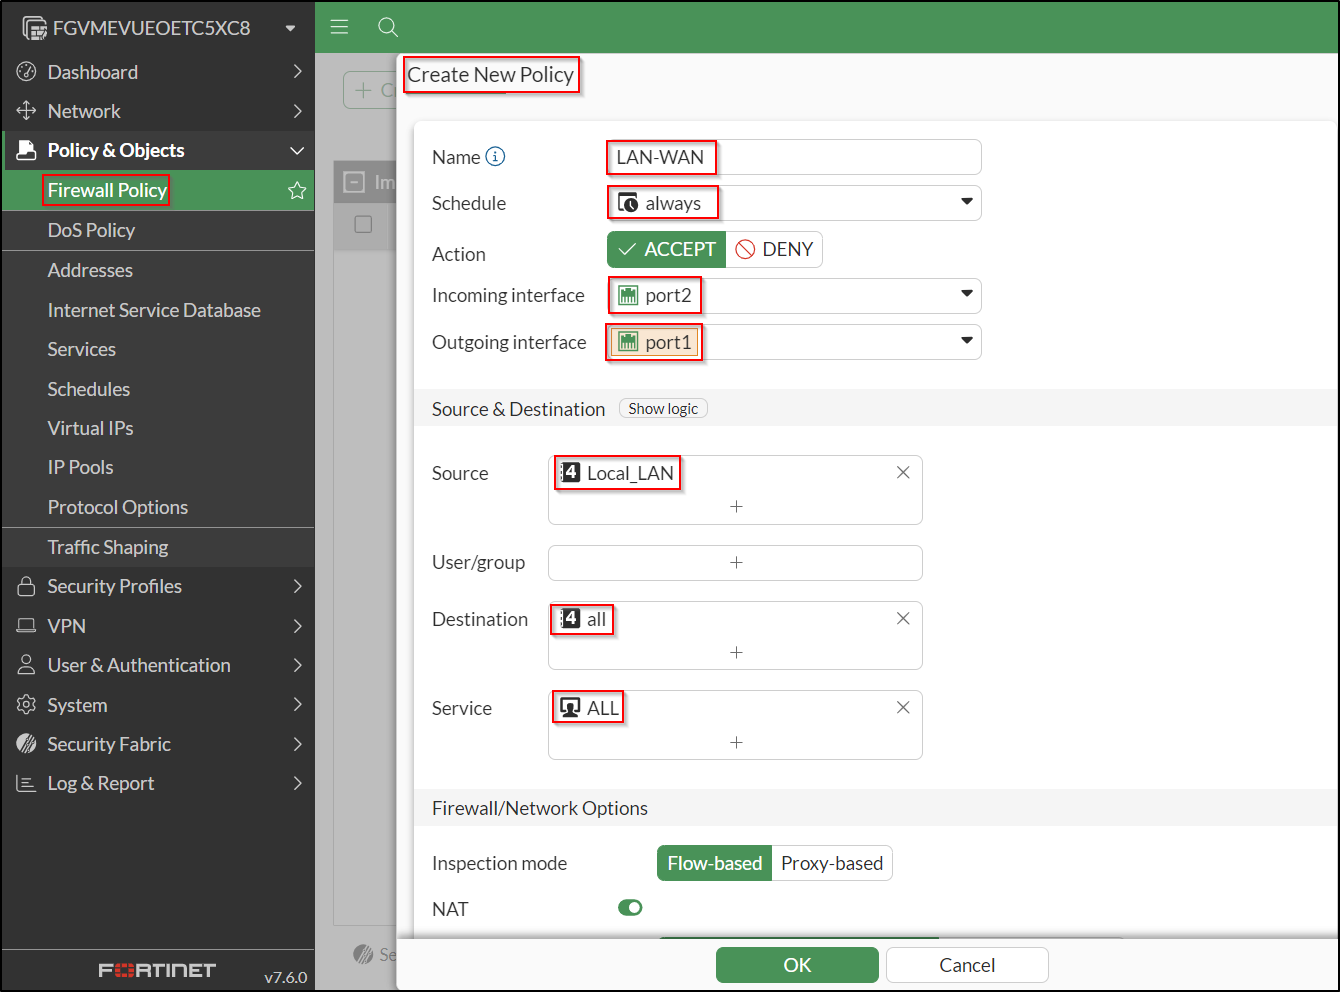
Create a Firewall Policy to allow LAN to WAN. To simulate an air-gapped environment without internet access, the policy has been disabled.

Configuring Syslog Logging on FortiGate
On FortiGate Command-Line Interface (CLI), run the following commands to configure Syslog Server Settings:
config log syslogd setting
    set status enable
    set server <syslog-ng IP>
    set source-ip <FortiGate IP>
    # set port <port number>  (Default port is 514)
    # Verify settings by running "show"
end
Configure Log Memory Filter:
config log memory filter
    set forward-traffic enable
    set local-traffic enable
    set sniffer-traffic disable
    set anomaly enable
    set voip disable
    set multicast-traffic enable
    # Verify settings by running "show full-configuration"
end
Configure Global System Settings:
config system global
    set cli-audit-log enable
    # Verify settings by running "show"
    # Ensure the timezone is correct, e.g., "Pacific/Auckland"
end
Enable Logging for Neighbour Events:
Configuring Syslog Logging on Cisco ISR (Optional)
On Cisco Integrated Services Router’s (ISR) CLI, run the following command to verify Clock and Configure NTP
Enable Syslog Logging:
Verify Logging:
Check Current Logging Configuration:
Set IP Address for VLAN 1 and Test Connectivity:
conf t
interface vlan 1
ip address <IP Address> <Subnet Mask>
no shutdown
exit

# Test connectivity to the syslog server
ping <Syslog Server IP>
Enable Log Sequence Numbers:
conf t
service sequence-numbers
# Assigns sequence numbers to syslog messages in the order events occur
Configure Console Logging:
conf t
line console 0
logging synchronous
# Ensures syslog messages are displayed properly after configuration
end
Ingesting FortiGate Logs
To ingest FortiGate logs into Splunk, you have two options:
| Path | Best suited to | Transport | Expected sourcetypes | Continue |
|---|---|---|---|---|
| Option 1: SC4S | The recommended structured syslog pipeline | FortiGate → syslog → SC4S → HEC | fgt_event, fgt_traffic |
Configure SC4S |
| Option 2: FortiGate app | A simpler PoC without SC4S | FortiGate → UDP input → Splunk | fortigate_event, fortigate_traffic |
Configure the FortiGate app |
Choose one ingestion path
Using both options simultaneously is not recommended. Both are shown here so you can select the path that suits your environment.
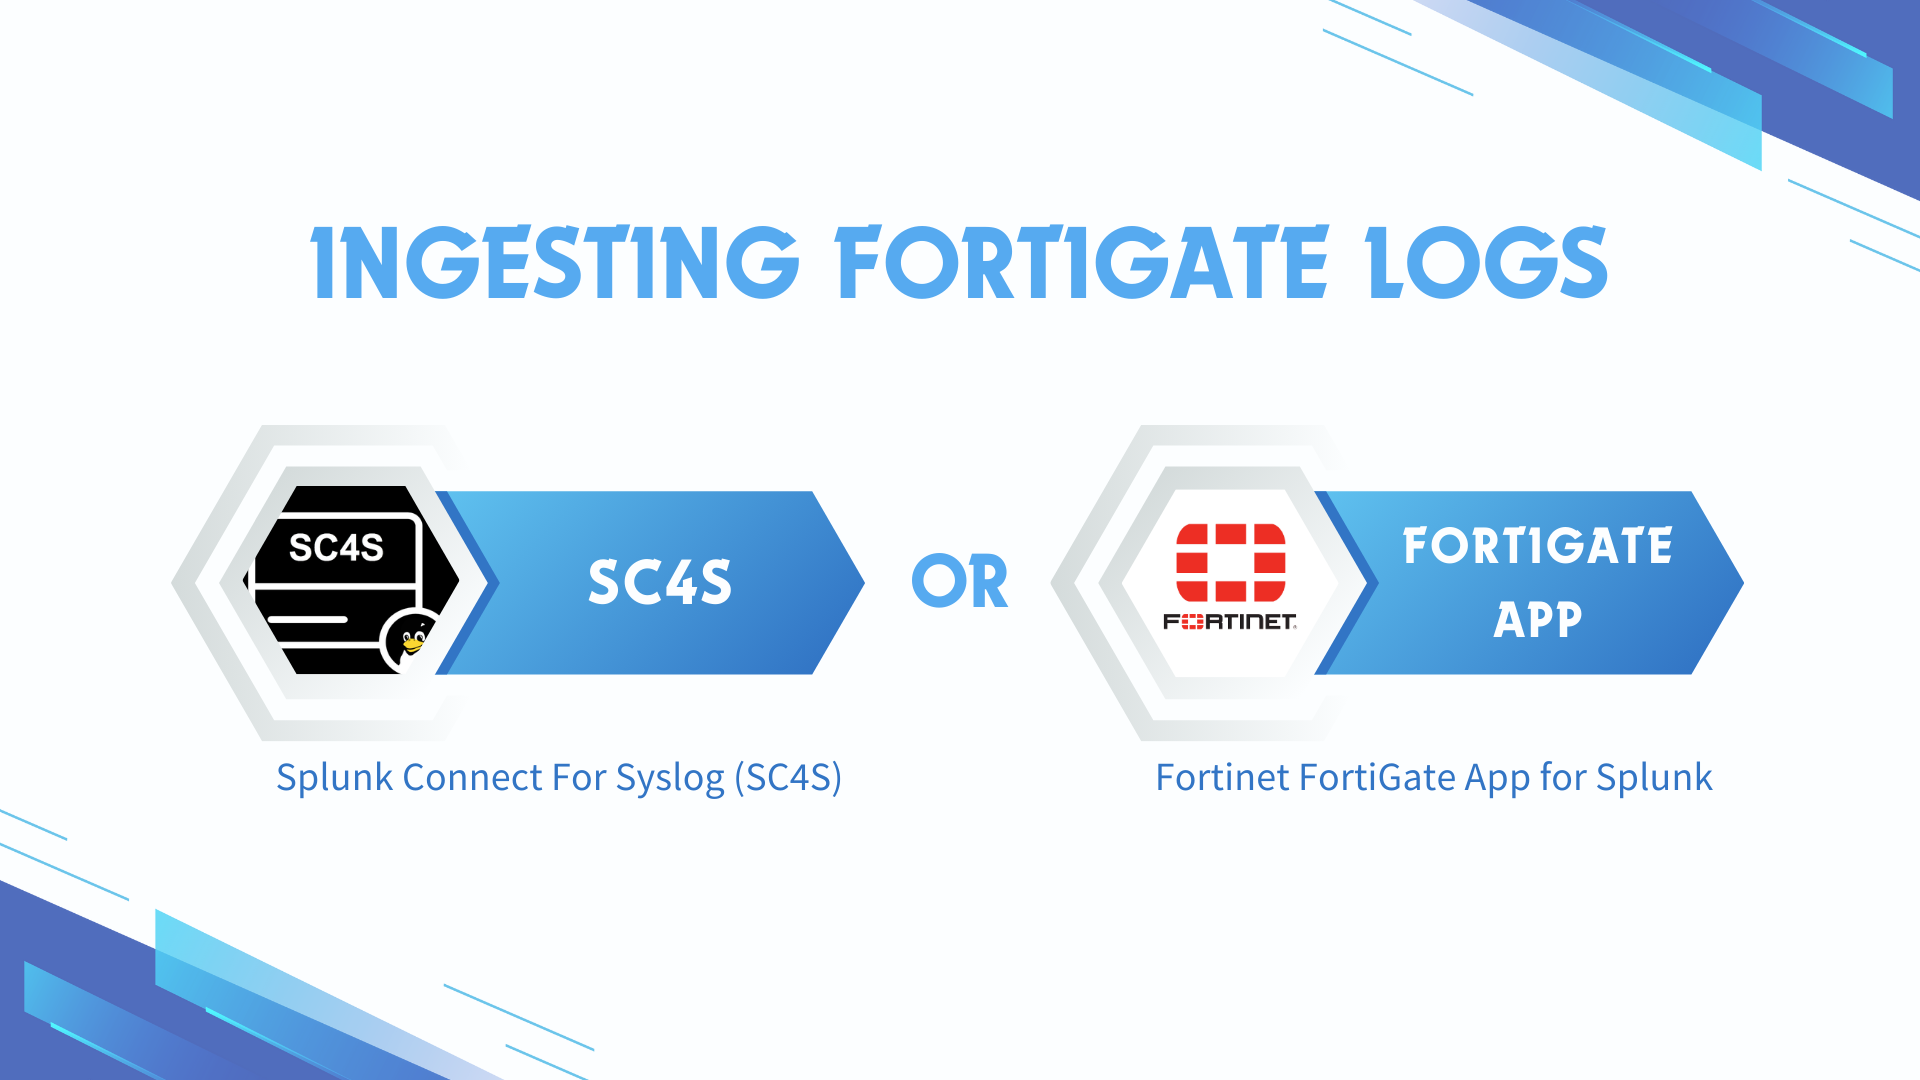
Ingesting FortiGate Logs through SC4S (Option 1)
SC4S is an open source packaged solution for getting data into Splunk. It is based on the syslog-ng Open Source Edition (Syslog-NG OSE) and transports data to Splunk via the Splunk HTTP Event Collector (HEC) rather than writing events to disk for collection by a Universal Forwarder. See the official Splunk Connect for Syslog documentation for supported sources, deployment options, and troubleshooting guidance.
Creating Indexes for SC4S
On the Splunk VM, as the splunk user, create an indexes.conf in the /opt/splunk/etc/system/local directory. Copy and paste the following content. This step will create the default indexes that are used by SC4S. It is important that you do not edit /opt/splunk/etc/system/default/indexes.conf
[default]
lastChanceIndex = main

[email]
homePath   = $SPLUNK_DB/email/db
coldPath   = $SPLUNK_DB/email/colddb
thawedPath = $SPLUNK_DB/email/thaweddb

[epav]
homePath   = $SPLUNK_DB/epav/db
coldPath   = $SPLUNK_DB/epav/colddb
thawedPath = $SPLUNK_DB/epav/thaweddb

[epintel]
homePath   = $SPLUNK_DB/epintel/db
coldPath   = $SPLUNK_DB/epintel/colddb
thawedPath = $SPLUNK_DB/epintel/thaweddb

[_metrics]
datatype=metric
homePath   = $SPLUNK_DB/_metrics/db
coldPath   = $SPLUNK_DB/_metrics/colddb
thawedPath = $SPLUNK_DB/_metrics/thaweddb

[syslogng_fallback]
homePath   = $SPLUNK_DB/syslogng_fallback/db
coldPath   = $SPLUNK_DB/syslogng_fallback/colddb
thawedPath = $SPLUNK_DB/syslogng_fallback/thaweddb

[test]
homePath   = $SPLUNK_DB/test/db
coldPath   = $SPLUNK_DB/test/colddb
thawedPath = $SPLUNK_DB/test/thaweddb

[test2]
homePath   = $SPLUNK_DB/test2/db
coldPath   = $SPLUNK_DB/test2/colddb
thawedPath = $SPLUNK_DB/test2/thaweddb

[infraops]
homePath   = $SPLUNK_DB/infraops/db
coldPath   = $SPLUNK_DB/infraops/colddb
thawedPath = $SPLUNK_DB/infraops/thaweddb

[osnix]
homePath   = $SPLUNK_DB/osnix/db
coldPath   = $SPLUNK_DB/osnix/colddb
thawedPath = $SPLUNK_DB/osnix/thaweddb

[oswin]
homePath   = $SPLUNK_DB/oswin/db
coldPath   = $SPLUNK_DB/oswin/colddb
thawedPath = $SPLUNK_DB/oswin/thaweddb

[oswinsec]
homePath   = $SPLUNK_DB/oswinsec/db
coldPath   = $SPLUNK_DB/oswinsec/colddb
thawedPath = $SPLUNK_DB/oswinsec/thaweddb

[netauth]
homePath   = $SPLUNK_DB/netauth/db
coldPath   = $SPLUNK_DB/netauth/colddb
thawedPath = $SPLUNK_DB/netauth/thaweddb

[netdlp]
homePath   = $SPLUNK_DB/netdlp/db
coldPath   = $SPLUNK_DB/netdlp/colddb
thawedPath = $SPLUNK_DB/netdlp/thaweddb

[netdns]
homePath   = $SPLUNK_DB/netdns/db
coldPath   = $SPLUNK_DB/netdns/colddb
thawedPath = $SPLUNK_DB/netdns/thaweddb

[netfw]
homePath   = $SPLUNK_DB/netfw/db
coldPath   = $SPLUNK_DB/netfw/colddb
thawedPath = $SPLUNK_DB/netfw/thaweddb

[netids]
homePath   = $SPLUNK_DB/netids/db
coldPath   = $SPLUNK_DB/netids/colddb
thawedPath = $SPLUNK_DB/netids/thaweddb

[netipam]
homePath   = $SPLUNK_DB/netipam/db
coldPath   = $SPLUNK_DB/netipam/colddb
thawedPath = $SPLUNK_DB/netipam/thaweddb

[netops]
homePath   = $SPLUNK_DB/netops/db
coldPath   = $SPLUNK_DB/netops/colddb
thawedPath = $SPLUNK_DB/netops/thaweddb

[netproxy]
homePath   = $SPLUNK_DB/netproxy/db
coldPath   = $SPLUNK_DB/netproxy/colddb
thawedPath = $SPLUNK_DB/netproxy/thaweddb

[netwaf]
homePath   = $SPLUNK_DB/netwaf/db
coldPath   = $SPLUNK_DB/netwaf/colddb
thawedPath = $SPLUNK_DB/netwaf/thaweddb

[email]
homePath   = $SPLUNK_DB/email/db
coldPath   = $SPLUNK_DB/email/colddb
thawedPath = $SPLUNK_DB/email/thaweddb

[netlb]
homePath   = $SPLUNK_DB/netlb/db
coldPath   = $SPLUNK_DB/netlb/colddb
thawedPath = $SPLUNK_DB/netlb/thaweddb
In the/opt/splunk/bin directory, restart Splunk Enterprise as the splunk user.
Checkpoint: confirm the SC4S indexes
On the Splunk web interface, navigate to Settings > Indexes. Confirm that the SC4S default indexes have been created. Use the filter search bar to find indexes if needed.
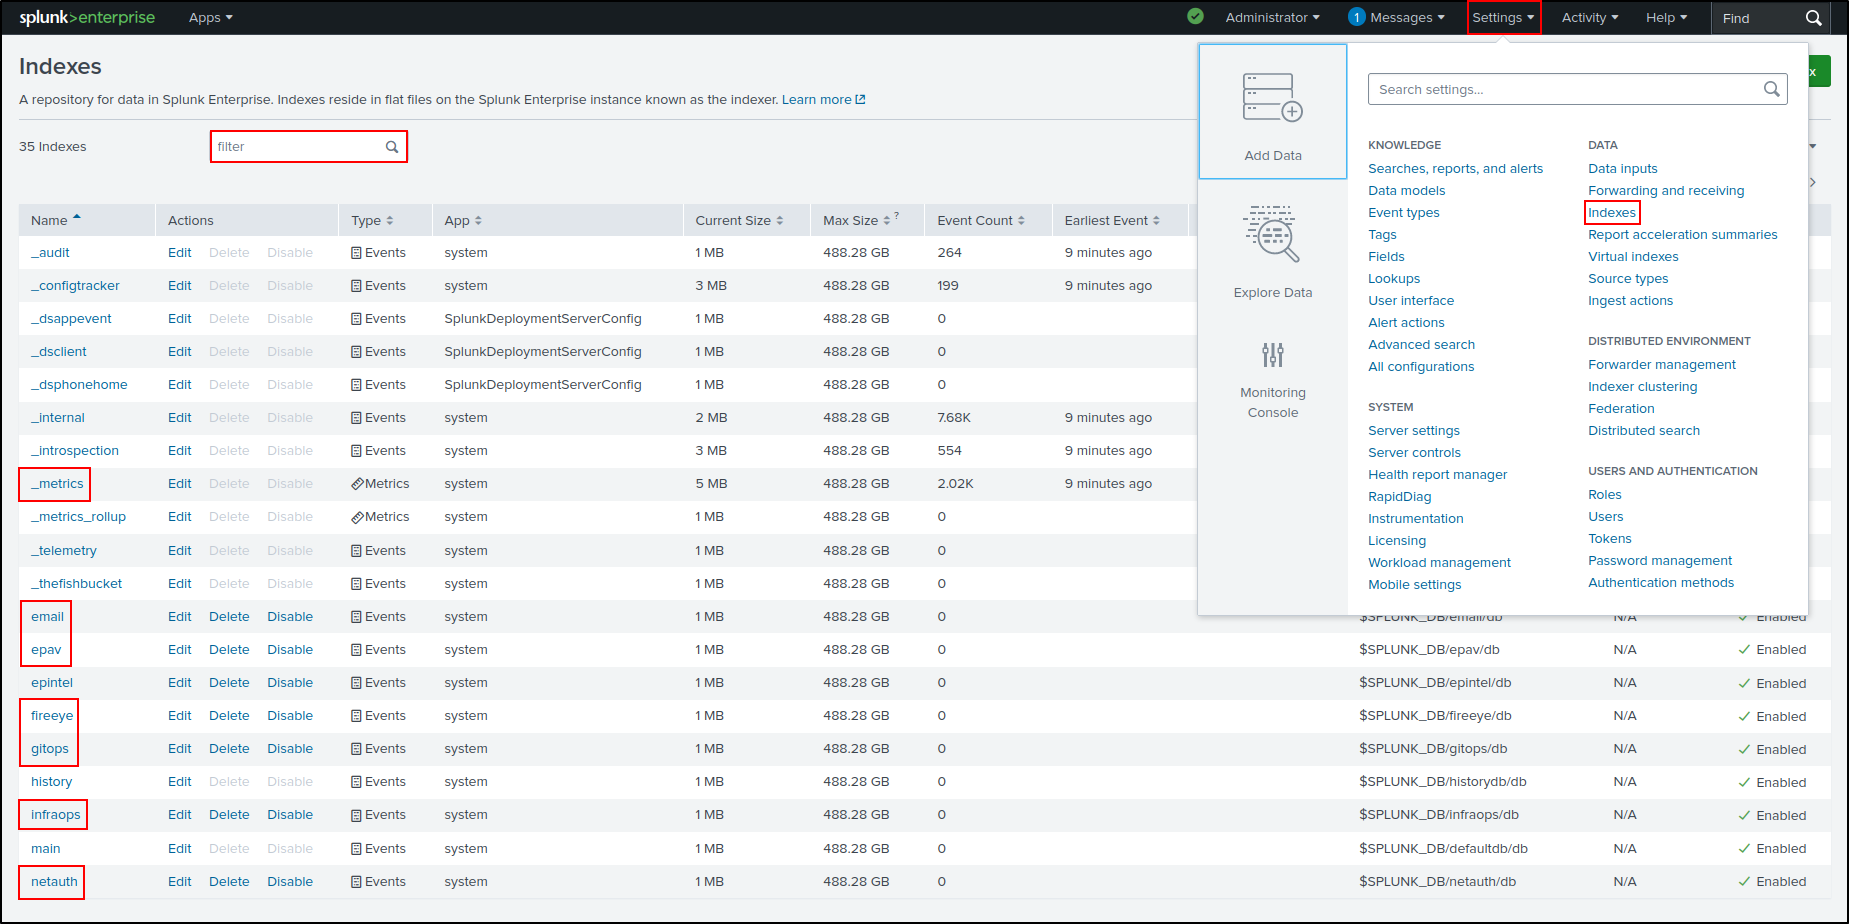
Creating a HEC Token
Lab-only transport setting
The original isolated PoC disabled HEC TLS to simplify certificate handling.
Do not copy that choice across an untrusted or production network. Current
Splunk and SC4S configurations support HTTPS on port 8088; keep certificate
verification enabled when you can establish trust correctly.
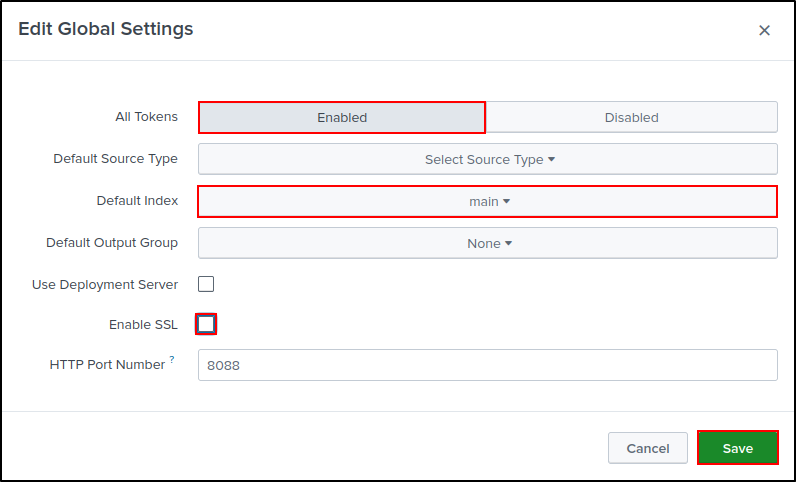
On the Splunk Web UI, navigate to Settings > Data Inputs > HTTP Event
Collector > Global Settings. Select Enabled for All Tokens and set main
as the default index. For an exact reproduction of the isolated PoC, clear
Enable SSL. Leave the HTTP port as 8088, then select Save.
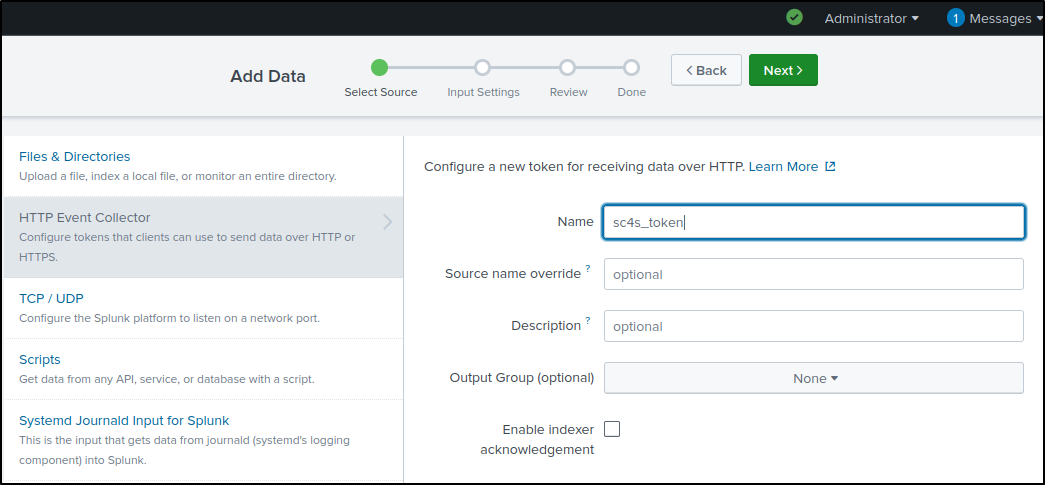
Click New Token, name it 'sc4s_token', and click Next.
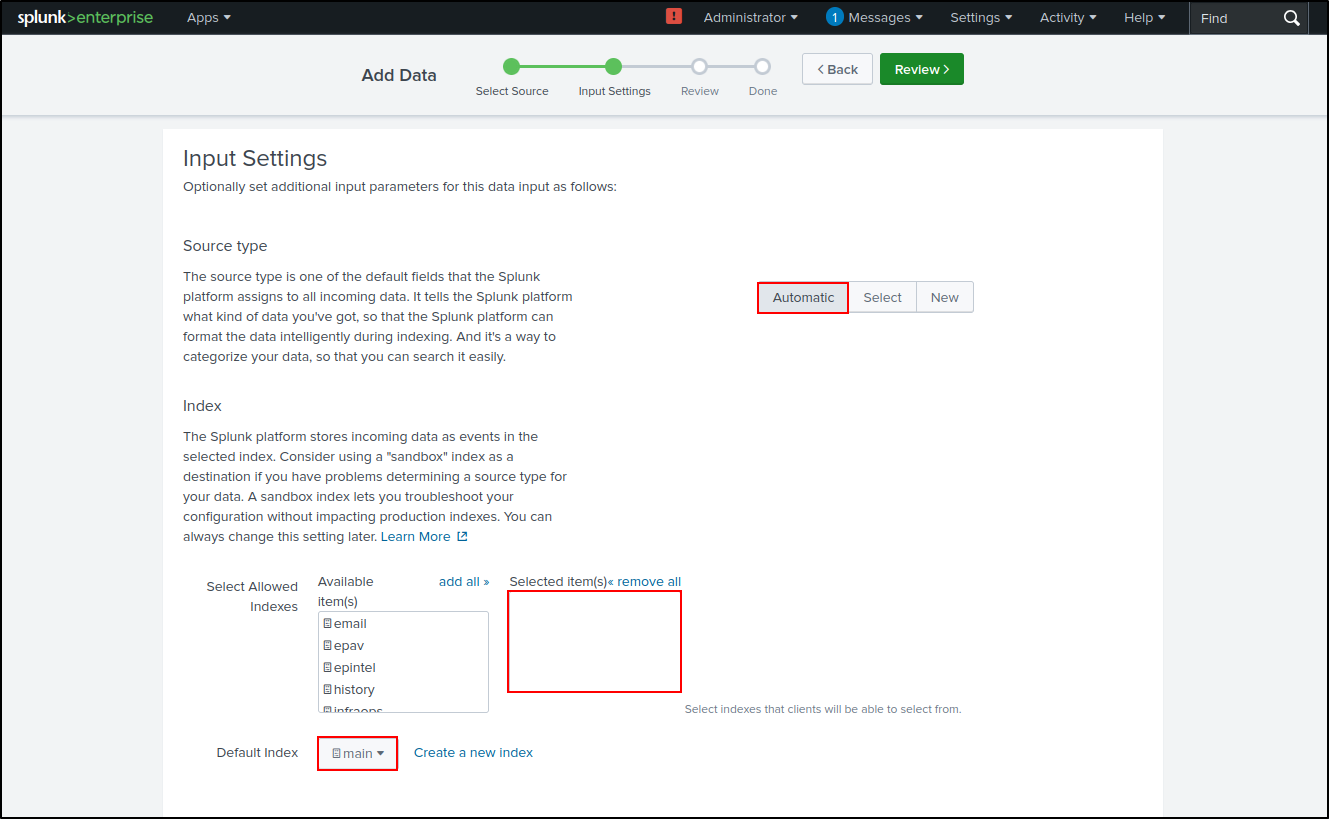
Leave Source Type as Automatic. Leave Selected Allowed Indexes blank. Select main as the Default Index. Click Review, then Submit.
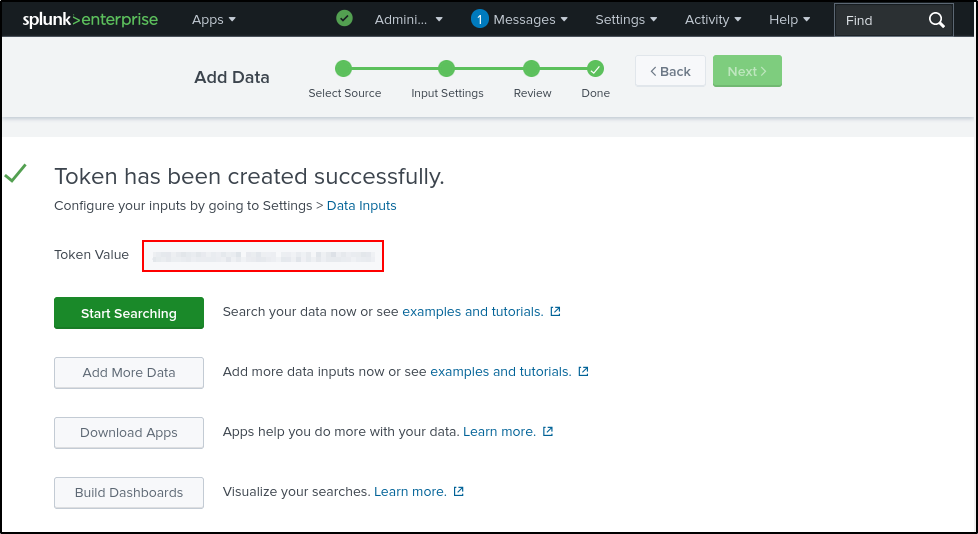
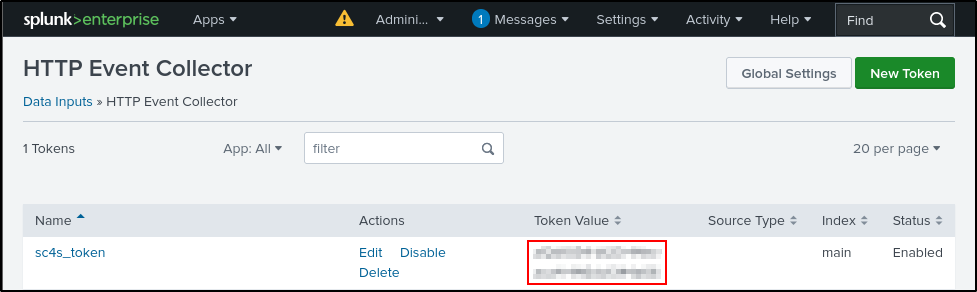
Copy the token value to a secure temporary location; it is a credential and should not appear in screenshots or shared lab notes. You can retrieve it later from Settings > Data Inputs > HTTP Event Collector.
Loading the SC4S Container Image
In a tab, as a standard user, use Docker to load the SC4S container image. Make a note of the container ID and image name. If you are using CentOS, replace docker with podman
Use the container ID to create a local label using docker.
Create the systemd unit file /lib/systemd/system/sc4s.service and copy and paste the following content:
[Unit]
Description=SC4S Container
Wants=NetworkManager.service network-online.target docker.service
After=NetworkManager.service network-online.target docker.service
Requires=docker.service

[Install]
WantedBy=multi-user.target

[Service]
Environment="SC4S_IMAGE=sc4slocal:latest"

# Required mount point for syslog-ng persist data (including disk buffer)
Environment="SC4S_PERSIST_MOUNT=splunk-sc4s-var:/var/lib/syslog-ng"

# Optional mount point for local overrides and configurations; see notes in docs
Environment="SC4S_LOCAL_MOUNT=/opt/sc4s/local:/etc/syslog-ng/conf.d/local:z"

# Optional mount point for local disk archive (EWMM output) files
Environment="SC4S_ARCHIVE_MOUNT=/opt/sc4s/archive:/var/lib/syslog-ng/archive:z"

# Map location of TLS custom TLS
Environment="SC4S_TLS_MOUNT=/opt/sc4s/tls:/etc/syslog-ng/tls:z"

TimeoutStartSec=0

#ExecStartPre=/usr/bin/docker pull $SC4S_IMAGE

# Note: /usr/bin/bash will not be valid path for all OS
# when startup fails on running bash check if the path is correct
ExecStartPre=/usr/bin/bash -c "/usr/bin/systemctl set-environment SC4SHOST=$(hostname -s)"

# Note: Prevent the error 'The container name "/SC4S" is already in use by container <container_id>. You have to remove (or rename) that container to be able to reuse that name.'
ExecStartPre=/usr/bin/bash -c "/usr/bin/docker rm SC4S > /dev/null 2>&1 || true"
ExecStart=/usr/bin/docker run \
        -e "SC4S_CONTAINER_HOST=${SC4SHOST}" \
        -v "$SC4S_PERSIST_MOUNT" \
        -v "$SC4S_LOCAL_MOUNT" \
        -v "$SC4S_ARCHIVE_MOUNT" \
        -v "$SC4S_TLS_MOUNT" \
        --env-file=/opt/sc4s/env_file \
        --network host \
        --name SC4S \
        --rm $SC4S_IMAGE

Restart=on-failure
Configuring IPv4 forwarding
IPv4 forwarding is not enabled by default. IPv4 forwarding must be enabled for container networking.
To check that IPv4 forwarding is enabled:
To enable IPv4 forwarding:
To ensure your changes persist upon reboot, define sysctl settings through files in /usr/lib/sysctl.d/ and /etc/sysctl.d/. To override only specific settings, either add a file with a lexically later name in /etc/sysctl.d/ and put following setting there or find this specific setting in one of the existing configuration files and set the value to 1.
cyber@Splunk:/usr/lib/sysctl.d$ ls
100-custom.conf  10-apparmor.conf  30-tracker.conf  50-bubblewrap.conf  50-pid-max.conf  99-protect-links.conf
Repeat the same steps for /etc/sysctl.d/.
cyber@Splunk:/etc/sysctl.d$ ls
100-custom.conf           10-ipv6-privacy.conf      10-magic-sysrq.conf  10-network-security.conf  10-zeropage.conf  README.sysctl
10-console-messages.conf  10-kernel-hardening.conf  10-map-count.conf    10-ptrace.conf            99-sysctl.conf
Create a Docker volume for SC4S disk buffer and state files.
Create directories to be used as a mount point for local overrides and configurations:
Create the environment file /opt/sc4s/env_file and replace the HEC URL and
token. Use HTTPS and a certificate trusted by the SC4S host:
SC4S_DEST_SPLUNK_HEC_DEFAULT_URL=https://10.0.0.100:8088
SC4S_DEST_SPLUNK_HEC_DEFAULT_TOKEN=<HEC_TOKEN>
# Keep TLS verification enabled. Add the issuing CA to the SC4S trust store.
Restrict the environment file because it contains the HEC token:
Lab-only HTTP exception
Plain HTTP exposes the HEC token and event data in transit. Use
http://127.0.0.1:8088 only when SC4S and Splunk share one isolated host
and the traffic never leaves the loopback interface. Do not use HTTP merely
to work around certificate errors.
Testing SC4S
Enable and start SC4S. Verify SC4S is active and running (exit with q).
sudo systemctl daemon-reload
sudo systemctl enable sc4s
sudo systemctl start sc4s
sudo systemctl status sc4s
Check Docker logs for errors:
#Example Output
SC4S_ENV_CHECK_HEC: Splunk HEC connection test successful to index=main for sourcetype=sc4s:fallback...
SC4S_ENV_CHECK_HEC: Splunk HEC connection test successful to index=main for sourcetype=sc4s:events...
syslog-ng checking config
sc4s version=3.30.0
starting goss
starting syslog-ng
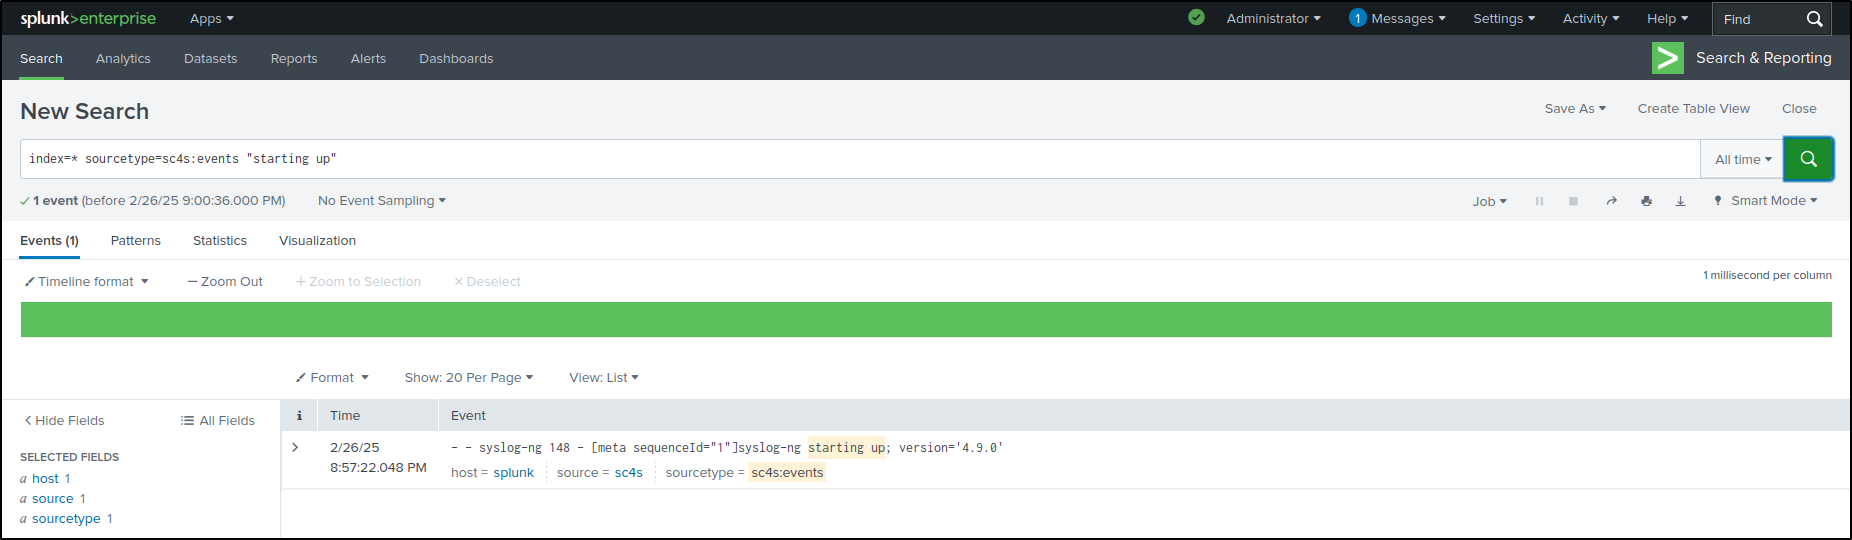
Search on Splunk for successful installation of SC4S. Make sure to select “All time.”
Send sample data to UDP port 514:
Search in Splunk to verify successful receipt of sample data on UDP port 514:
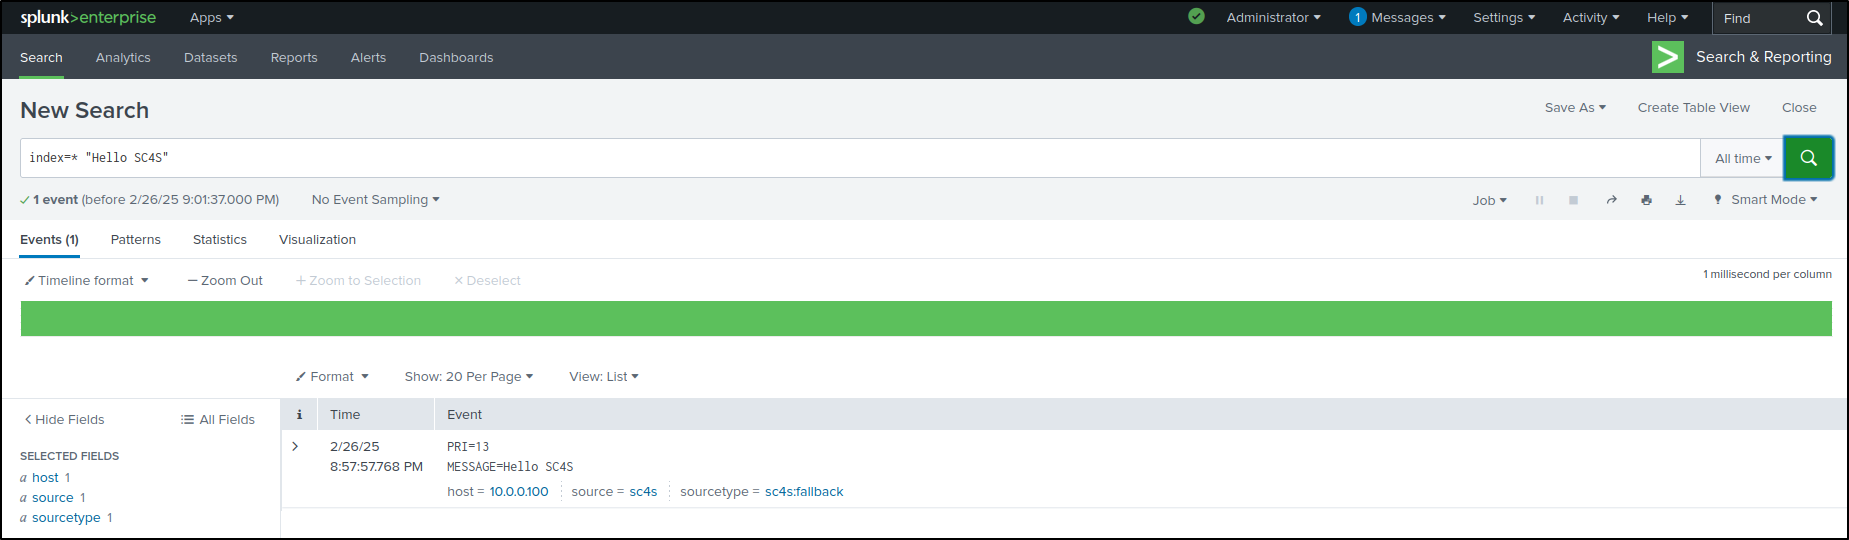
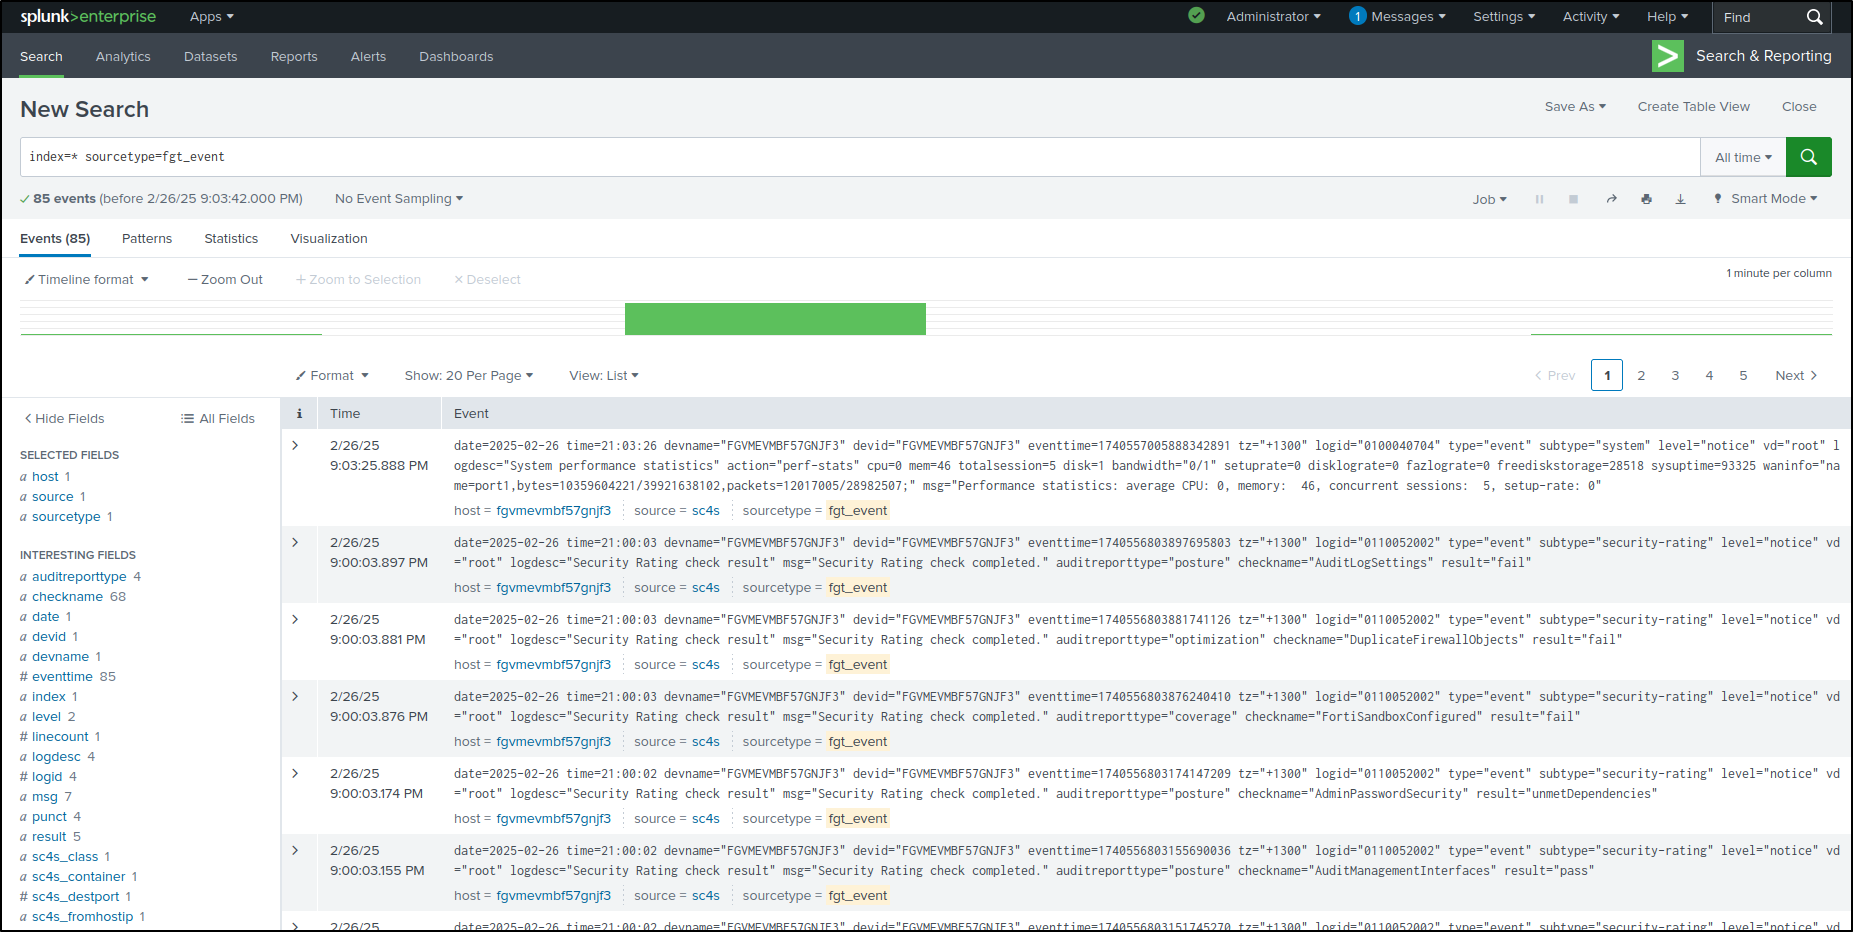
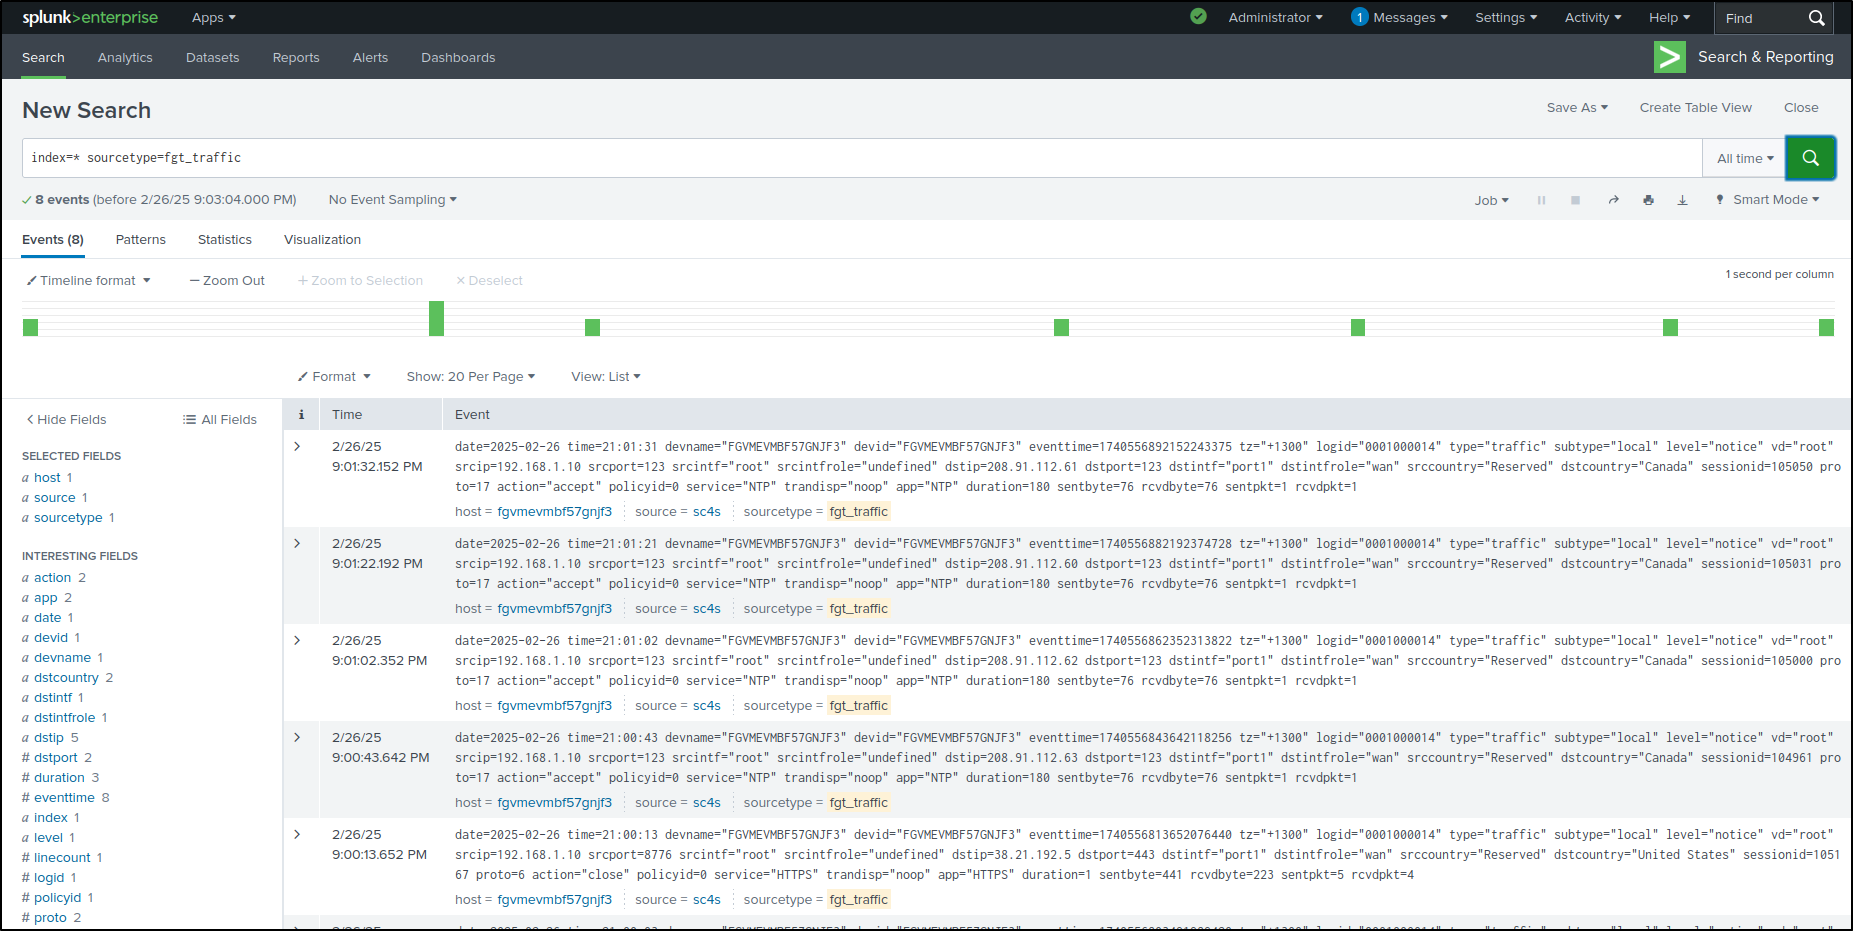
Earlier, we configured FortiGate to send logs on UDP port 514. Since SC4S is configured to receive logs on UDP port 514, we should now see FortiGate logs. Verify that SC4S is receiving FortiGate event and traffic logs with source sc4s. It may take some time for the logs to appear.
Ingesting FortiGate Logs through FortiGate App (Option 2)
PoC alternative
This direct UDP input is included because it was demonstrated in the PoC. UDP does not confirm delivery and can lose events during interruption or resource pressure. Prefer the SC4S path when you need buffering and a more structured ingestion pipeline.
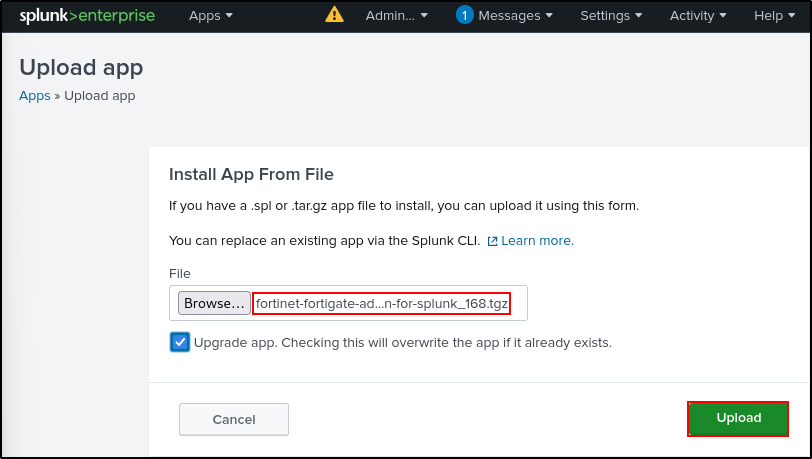
If SC4S does not work for your environment, another option to ingest FortiGate logs on Splunk is through FortiGate App. On Splunk web UI, navigate to Manage Apps, then Install from file. Upload the FortiGate App (tar archive) from ~/splunk-offline/apps directory. Check the upgrade box.
Adding UDP Data Input
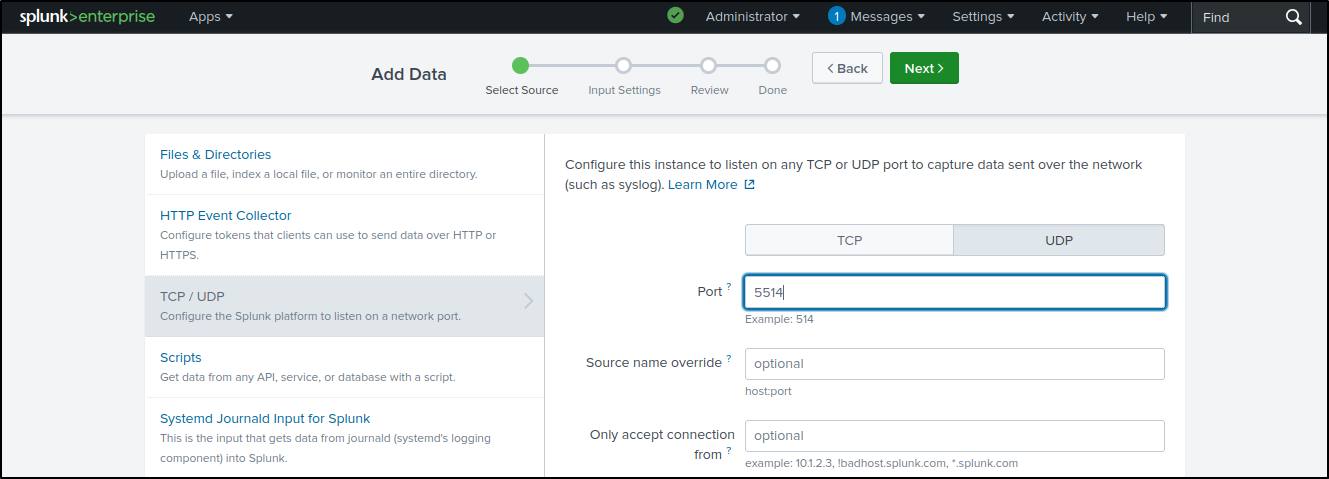
Navigate to Settings > Data Inputs > UDP in Splunk Web. Select New Local
UDP, enter port 5514, and retain the remaining defaults. The PoC uses 5514
because SC4S already listens on 514; if SC4S is not installed, you may use
514 instead.
For Source type, search and select fortigate_log .
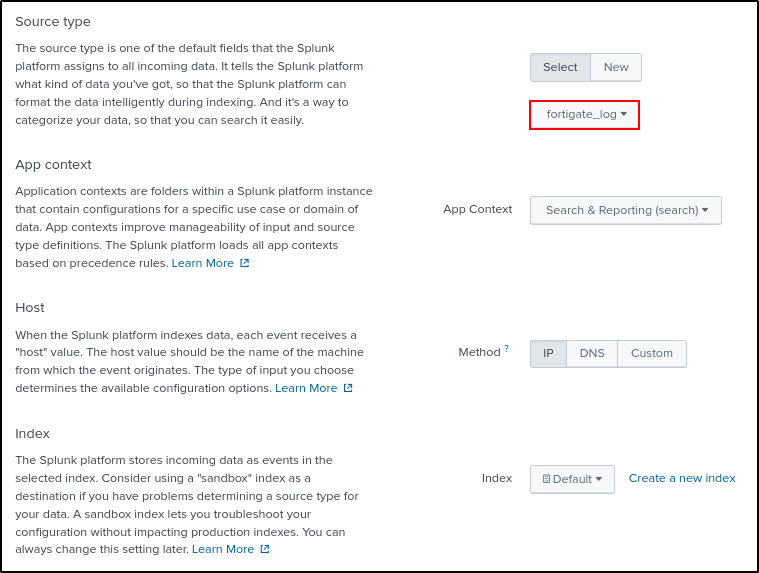
Click Review and Submit. If you get the error UDP 514 is not available use other UDP port (e.g. 5514). Restart Splunk Enterprise as the splunk user for the change to take effect.
Configuring Syslog Logging on FortiGate (UDP 5514)
Configure FortiGate to send syslog to port 5514 by running the following command. Ensure you enter the correct port number. When prompted, confirm the port number.
FGVMEVMBF57GNJF3 # config log syslogd setting

FGVMEVMBF57GNJF3 (setting) # set port 5514

FGVMEVMBF57GNJF3 (setting) # show
config log syslogd setting
    set status enable
    set server "10.0.0.100"
    set port 5514
    set source-ip "10.0.0.1"
end

FGVMEVMBF57GNJF3 (setting) # end
Port 5514 is different from default port 514.
Confirm to use port 5514 instead?
Do you want to continue? (y/n)y

Port set to 5514

FGVMEVMBF57GNJF3 #
Testing FortiGate App
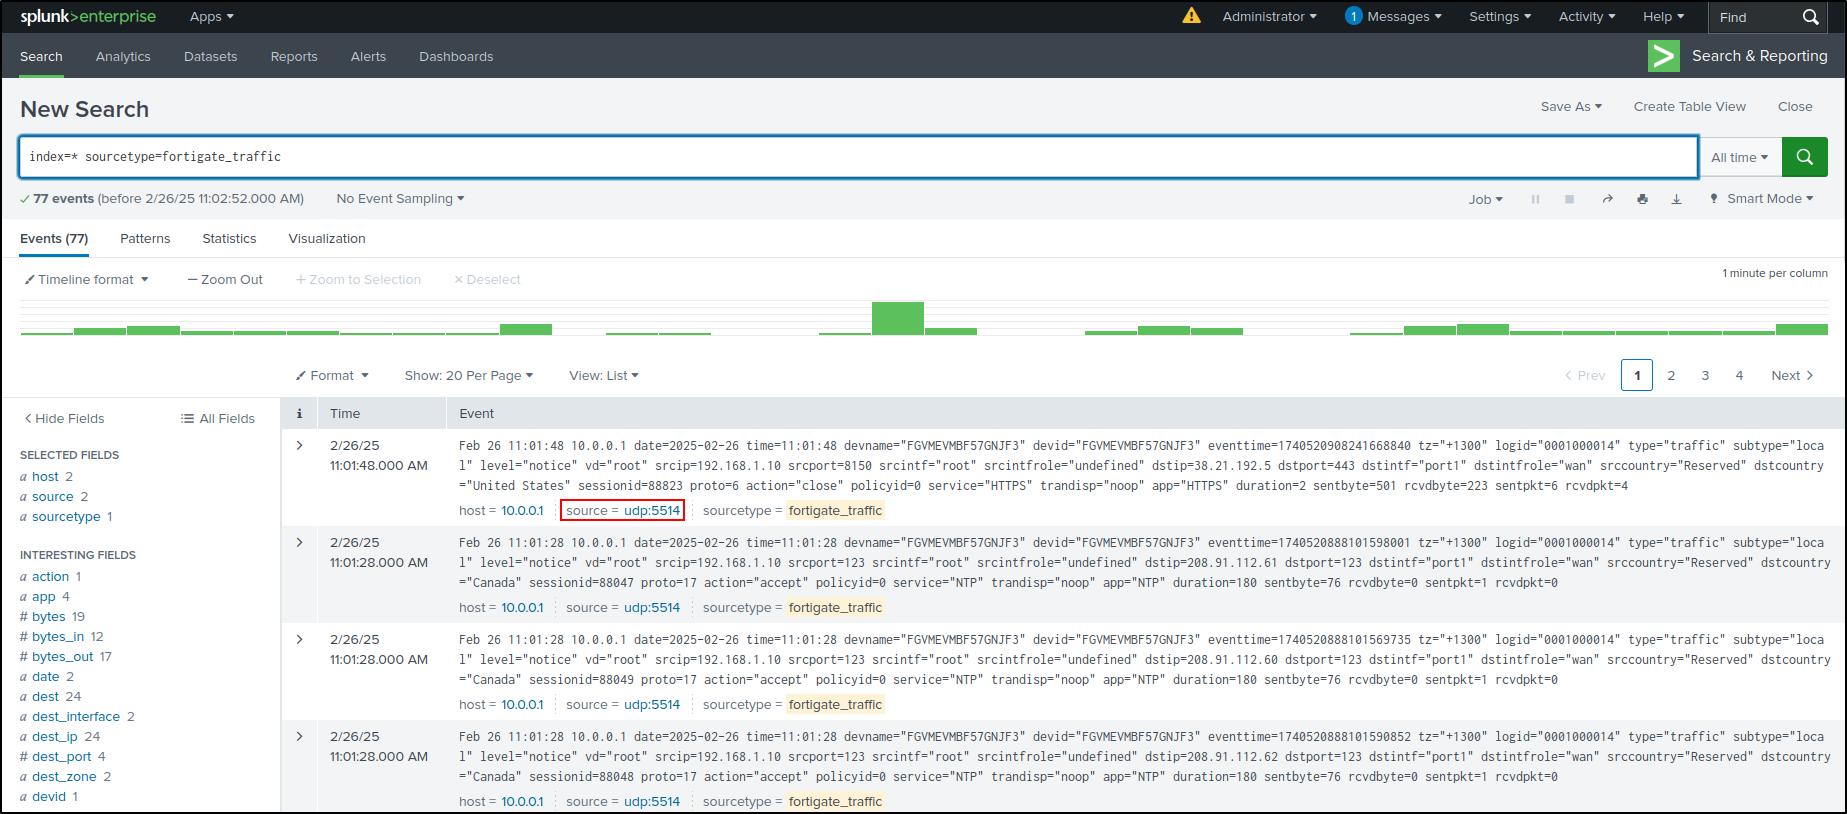
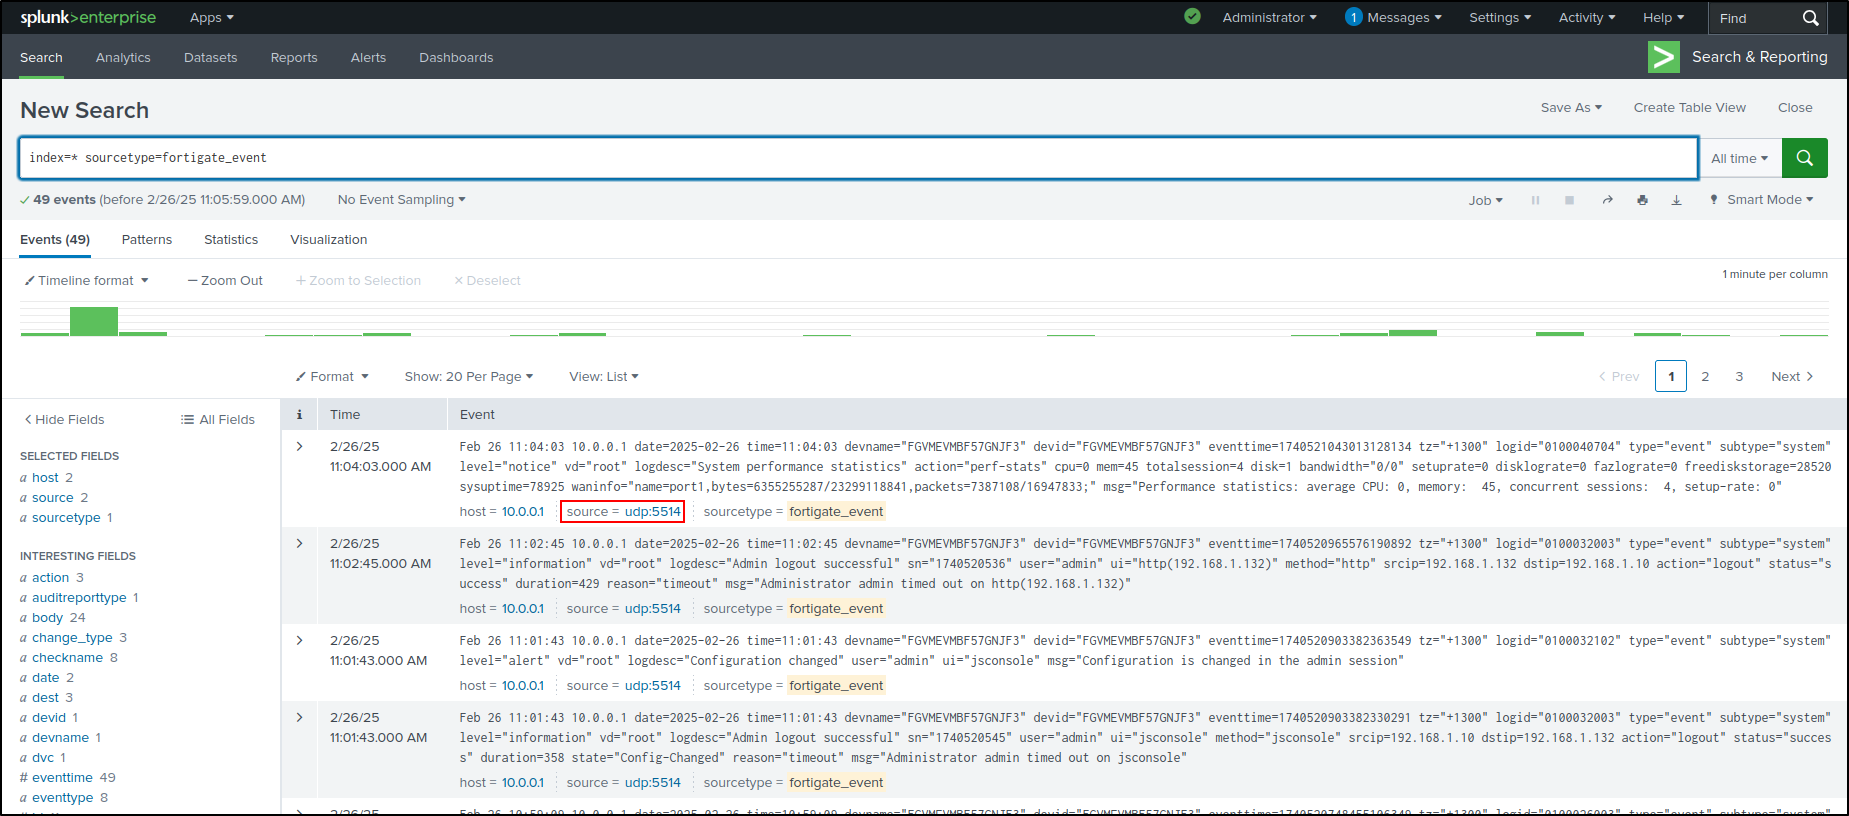
Navigate to Search & Reporting in Splunk Web. Search for index=* and
confirm that fortigate_traffic and fortigate_event appear as sourcetypes.
Verify that the most recent event came from the 5514 UDP input. If new events
still use the SC4S source, confirm that you selected only one ingestion path and
review the active inputs before restarting Splunk.
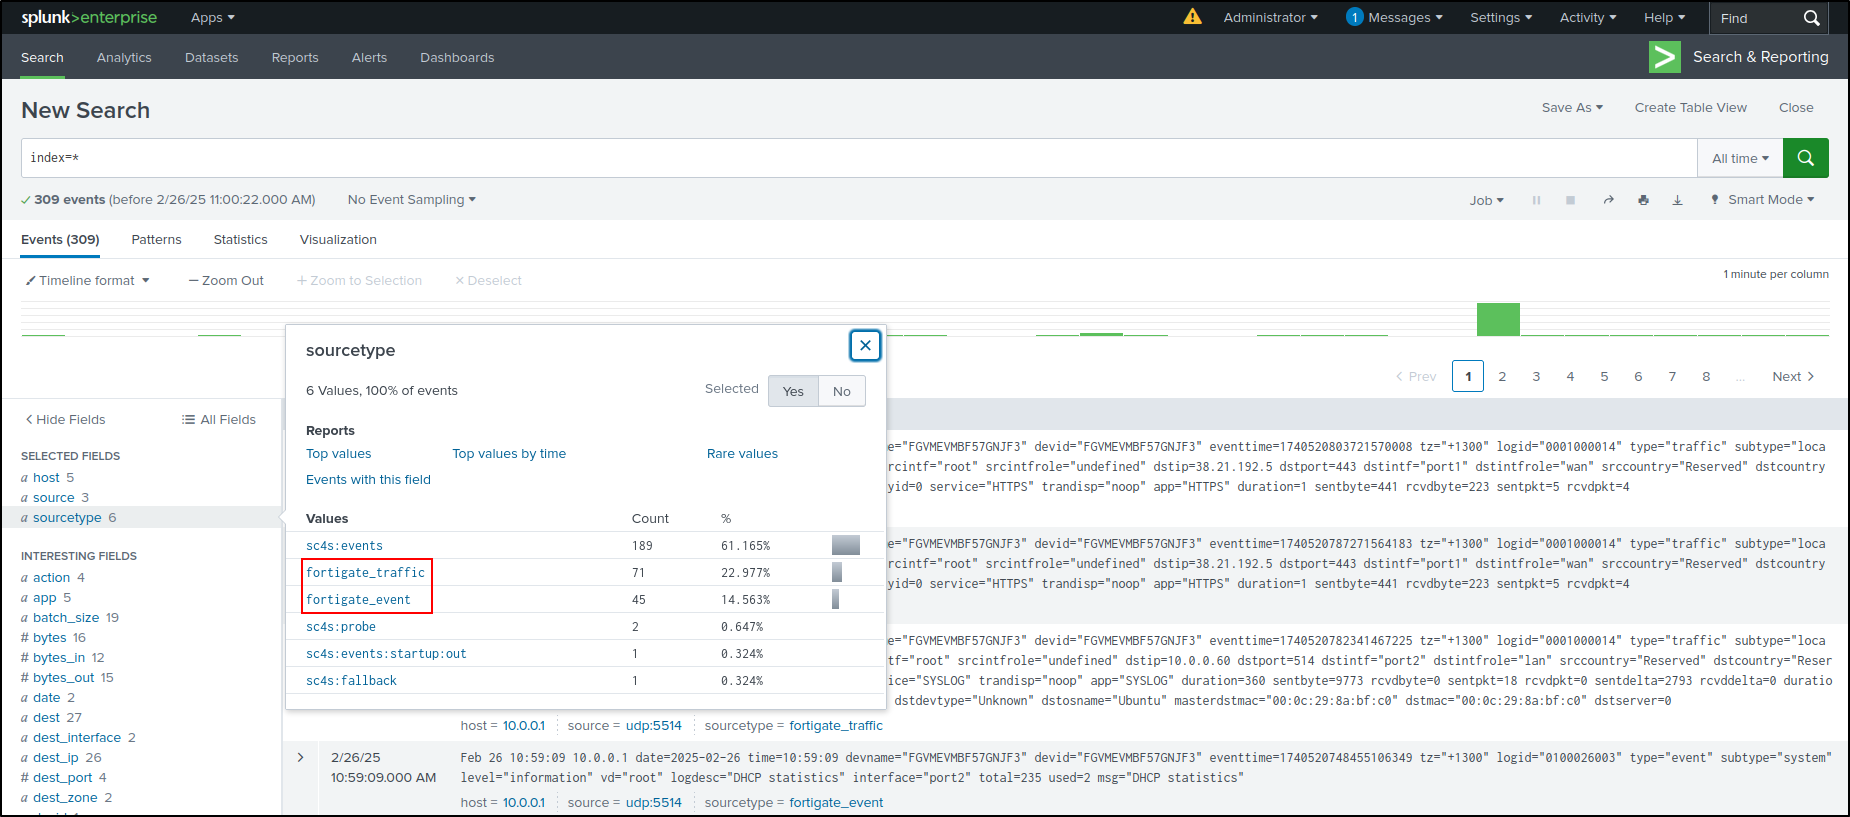
Search for index=* sourcetype=fortigate_traffic and
index=* sourcetype=fortigate_event. Verify that the most recent events have
source udp:5514 (the exact source label may differ by Splunk version).