Integrate Network IDS
Collect Snort or Suricata alerts through a Wazuh agent and verify that useful IDS fields reach the dashboard.
IDS alert path
Verify each boundary in order. A Wazuh parsing problem cannot be diagnosed until the IDS has produced the expected local alert and the agent can read its file.
Choose one integration path
Select the path that matches the IDS already operating on your sensor. Both paths finish in the same place: a locally verified IDS alert represented by useful fields in Wazuh.
Recommended path
Suricata and EVE JSON
Use Suricata when the sensor already produces structured EVE JSON. Wazuh can
read /var/log/suricata/eve.json using the json log format, preserving useful
signature, address, protocol, and classification fields.
- InputEVE JSON
- Wazuh format
json - Best forStructured investigation fields
Alternative path
Snort 3 alert output
Use Snort 3 when it is the established sensor. First confirm that Snort writes the selected alert format to a stable file, then configure the Wazuh agent with the matching log format and file location.
- InputSnort alert file
- Wazuh format
snort-full - Best forExisting Snort 3 deployments
Choose before configuring
Complete one path end to end before adding the other. This keeps file permissions, log formats, test evidence, and troubleshooting unambiguous.
Keep interface names such as <NETWORK_INTERFACE> and sensor addresses environment-specific.
Detailed IDS procedures
The complete Snort 3 and Suricata configuration, agent collection, test commands, expected evidence, and dashboard screenshots are retained below.
Integrate Snort 3
Install Wazuh agent on a Linux host where Snort3 is installed. Edit Snort’s configuration:
Uncomment alert_full and add file=true
---------------------------------------------------------------------------
-- 7. configure outputs
---------------------------------------------------------------------------

-- event logging
-- you can enable with defaults from the command line with -A <alert_type>
-- uncomment below to set non-default configs
--alert_csv = { }
--alert_fast = {file=true}
alert_full = {file=true}
--alert_sfsocket = { }
--alert_syslog = { }
--unified2 = { }
Edit the /var/ossec/etc/ossec.conf file of Wazuh agent and add the new localfile entry:
Make sure indentation is correct.
<localfile>
  <log_format>snort-full</log_format>
  <location>/var/log/snort/alert_full.txt</location>
</localfile>
Restart the Wazuh agent.
Run Snort3 with the following parameters:
Note: Snort3 is currently configured to read local.rules for demonstration purposes.
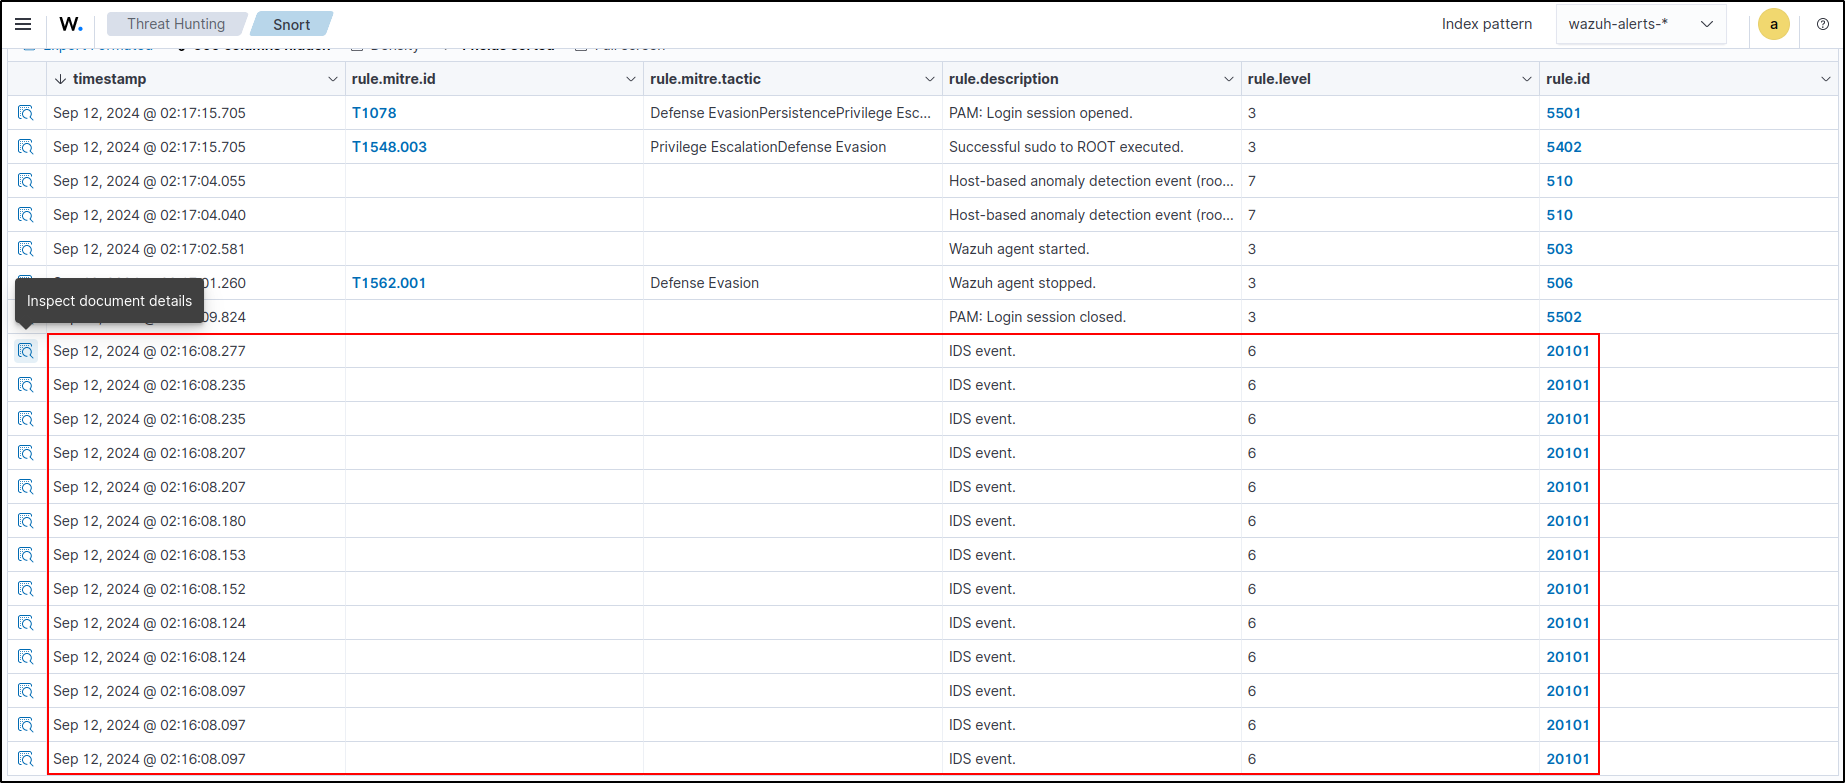
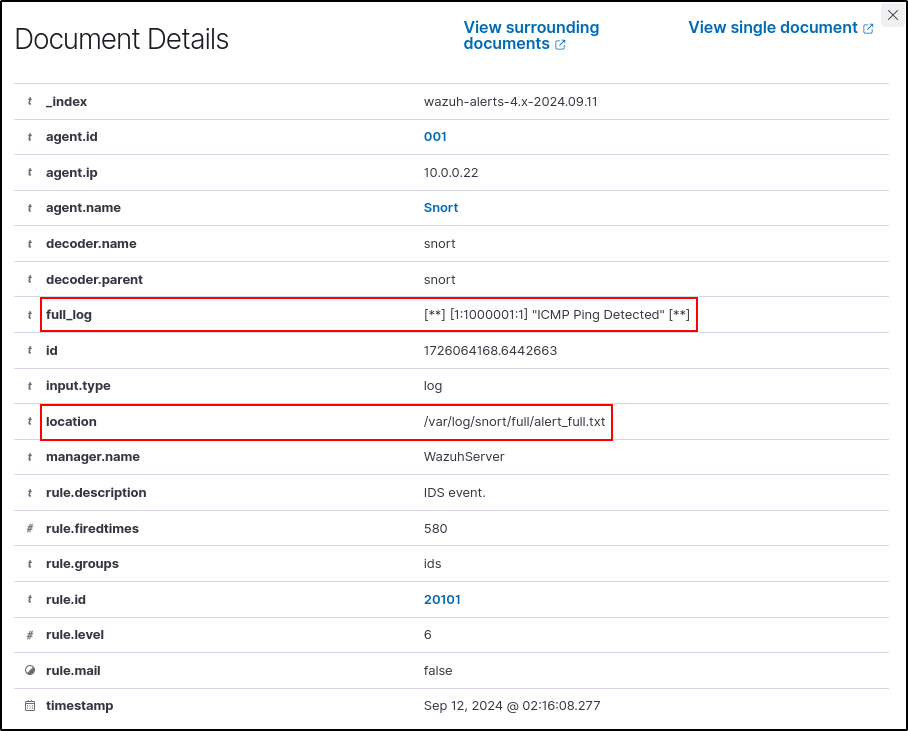
Execute ping to 10.0.0.22 (Snort3 VM) from another host. Verify alert_full.txt is generated
On Wazuh dashboard, verify IDS Event alerts are generated and it points to alert_full.txt
Integrate Suricata
Install Wazuh agent on a Linux host where Suricata is installed. Changes the permissions of all files in the Suricata’s /rules/ directories:
Modify Suricata settings in the /etc/suricata/suricata.yaml file and set the following variables:
vars:
  # more specific is better for alert accuracy and performance
  address-groups:
    HOME_NET: "[10.0.0.0/24]"
...
community-id: true
...
af-packet:
    - interface: ens32
      cluster-id: 99
      cluster-type: cluster_flow
      defrag: yes
      use-mmap: yes
...
# Cross platform libpcap capture support
pcap:
  - interface: ens32
interface represents the network interface you want to monitor. Replace the value with the interface name of the Ubuntu endpoint. For example, ens32
Restart the Suricata service:
Add the following configuration to the /var/ossec/etc/ossec.conf file of the Wazuh agent. This allows the Wazuh agent to read the Suricata logs file:
<ossec_config>
  <localfile>
    <log_format>json</log_format>
    <location>/var/log/suricata/eve.json</location>
  </localfile>
</ossec_config>
Restart the Wazuh agent to apply the changes:
Run the controlled test
Use a local deterministic rule instead of depending on an external test site.
Create /etc/suricata/rules/wazuh-lab.rules on the sensor:
alert http any any -> $HOME_NET any (msg:"WAZUH LAB deterministic HTTP test"; flow:to_server,established; http.uri; content:"/wazuh-lab-test"; sid:1000001; rev:1;)
Add wazuh-lab.rules to the rule-files list in suricata.yaml, then validate
the complete Suricata configuration before restarting:
From another isolated lab host, request the unique path from an HTTP server
inside $HOME_NET:
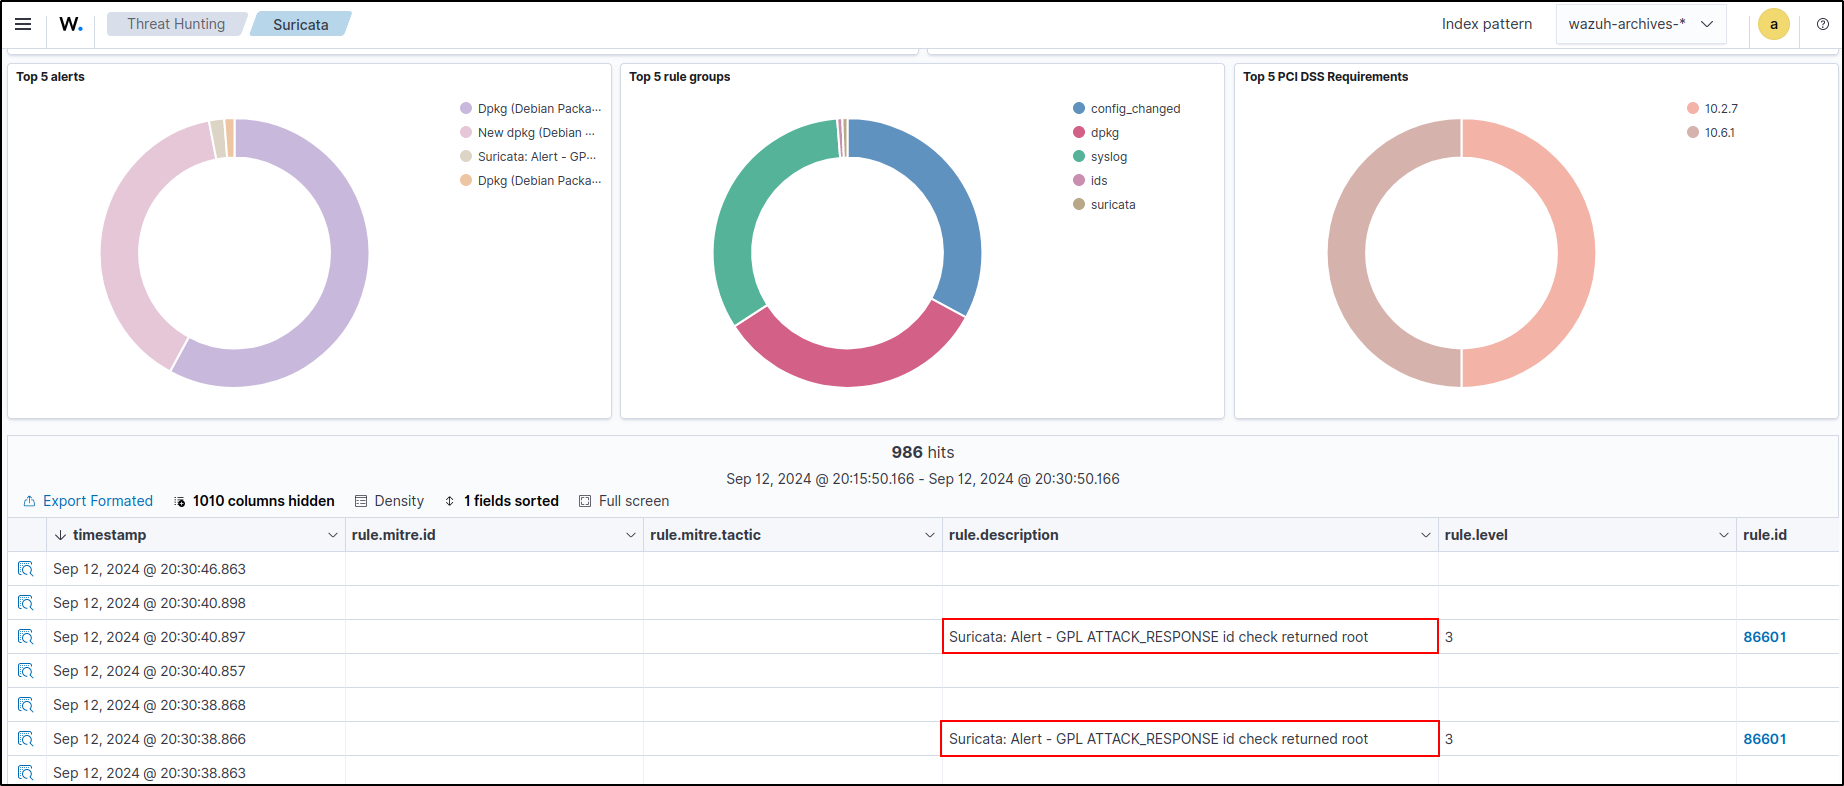
Confirm SID 1000001 first in /var/log/suricata/eve.json, then find the same
event in Wazuh and verify its timestamp, sensor, source, destination, signature,
and severity fields. Remove wazuh-lab.rules and its rule-files entry after
the exercise if they are no longer required.
Validate the pipeline
Generate the local, benign HTTP fixture in the detailed Suricata procedure, or an equivalent locally defined Snort rule. Do not rely on an external test site.
Checkpoint: connect IDS evidence to Wazuh
Confirm the IDS alert exists locally first. Then find the corresponding Wazuh event and verify its sensor, source, destination, signature, classification, severity, and timestamp fields. If the local alert exists but Wazuh has no event, troubleshoot file permissions, log format, location, and agent status.