Capture and Inspect Traffic
Capture authorised traffic and use Wireshark statistics and display filters to understand the packets, protocols, endpoints, and conversations it contains.
Capture only authorised traffic
Packet captures can contain credentials, personal data, and confidential communications. Capture and inspect traffic only on systems and networks you own or are explicitly authorised to test.
Start and stop a capture
Once installation is complete, open Wireshark. It will display the network interfaces attached to your computer.
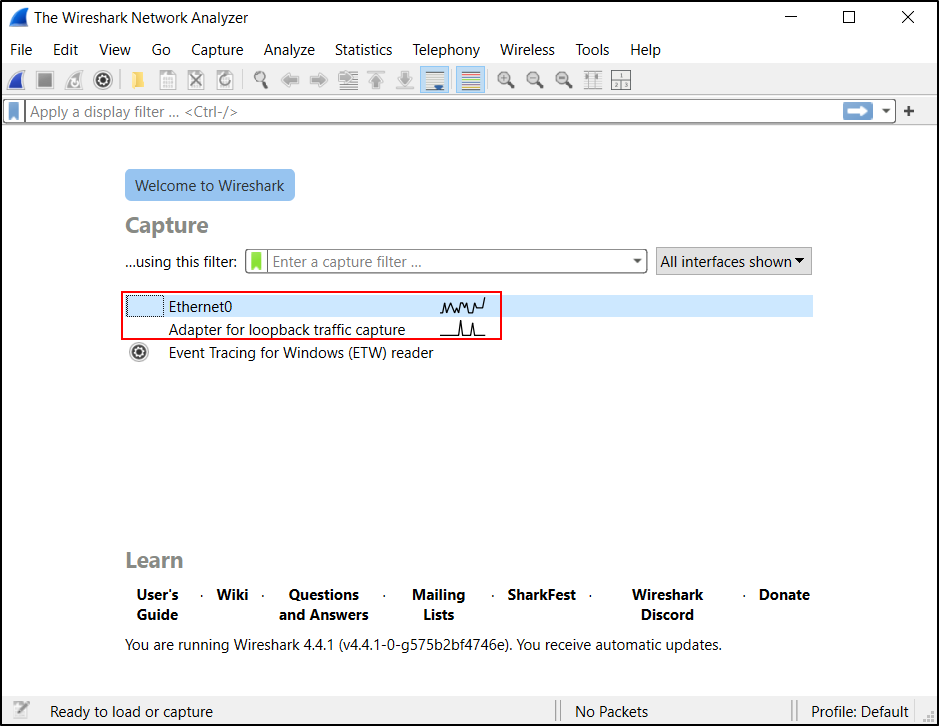
For this demonstration, double-click the loopback interface. Wireshark immediately starts capturing traffic that applications on the same host exchange through the loopback interface. To inspect traffic to or from other systems, select the active Ethernet or Wi-Fi interface instead.
You can stop the traffic capture by clicking the stop button.
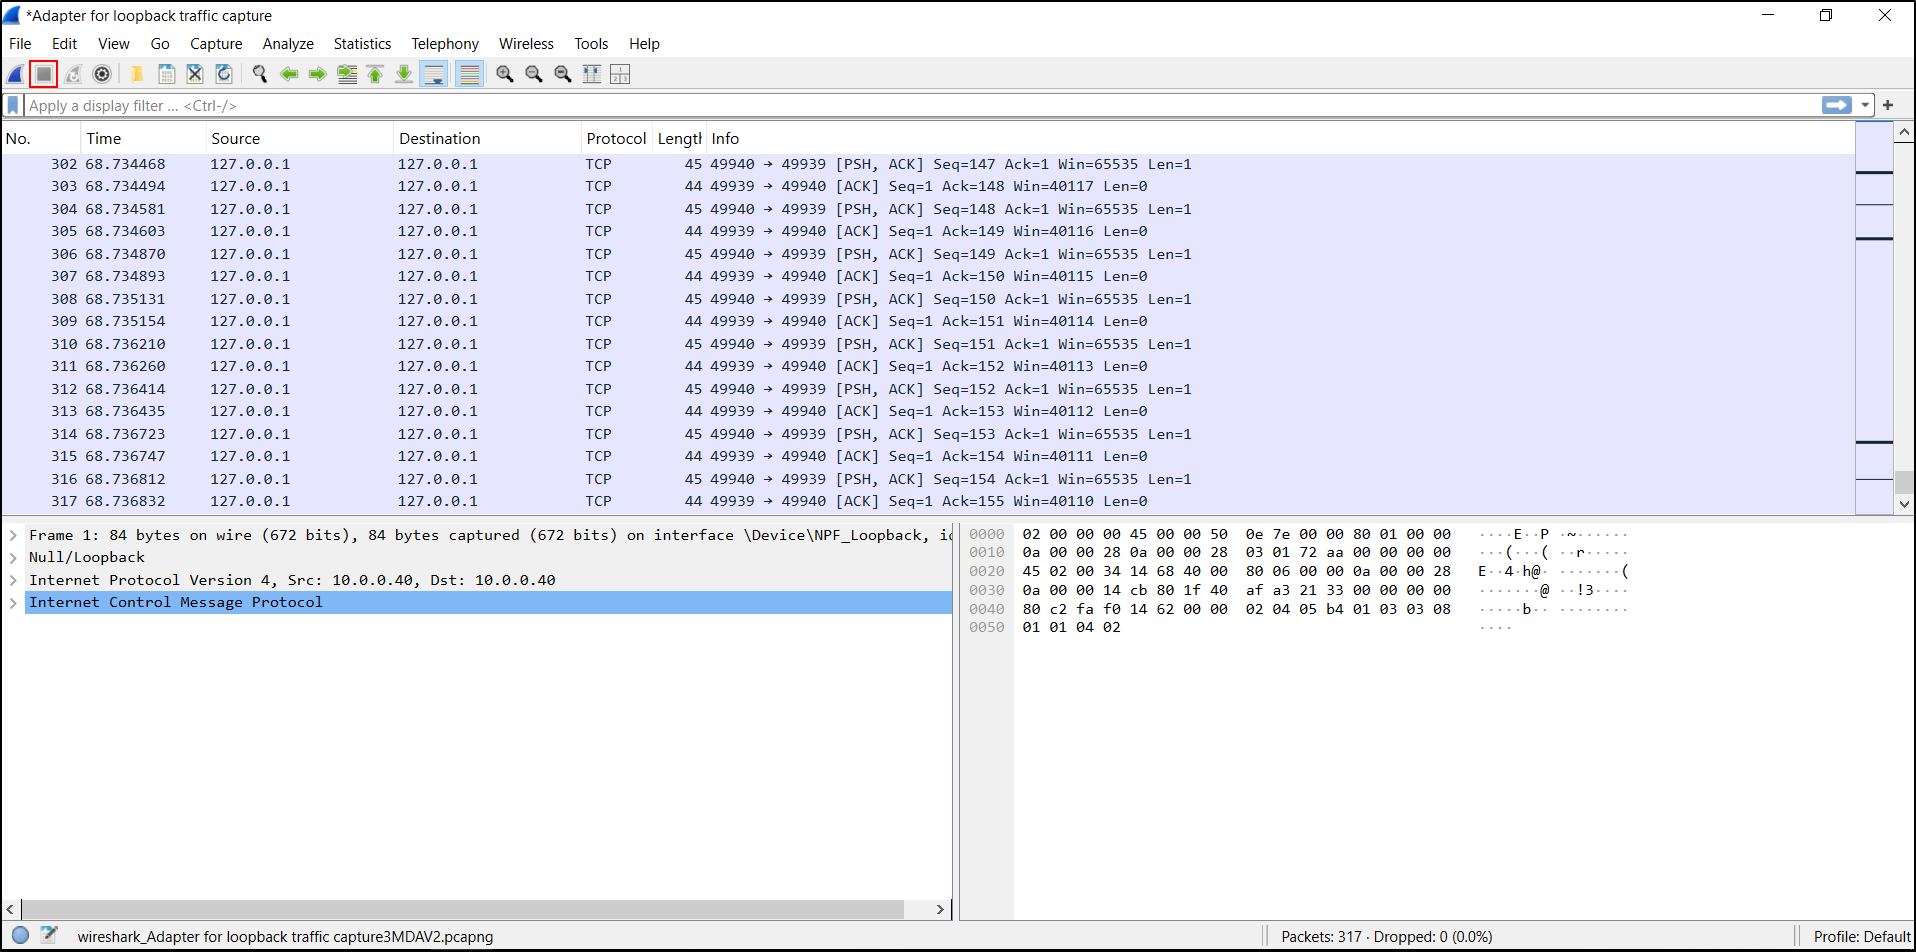
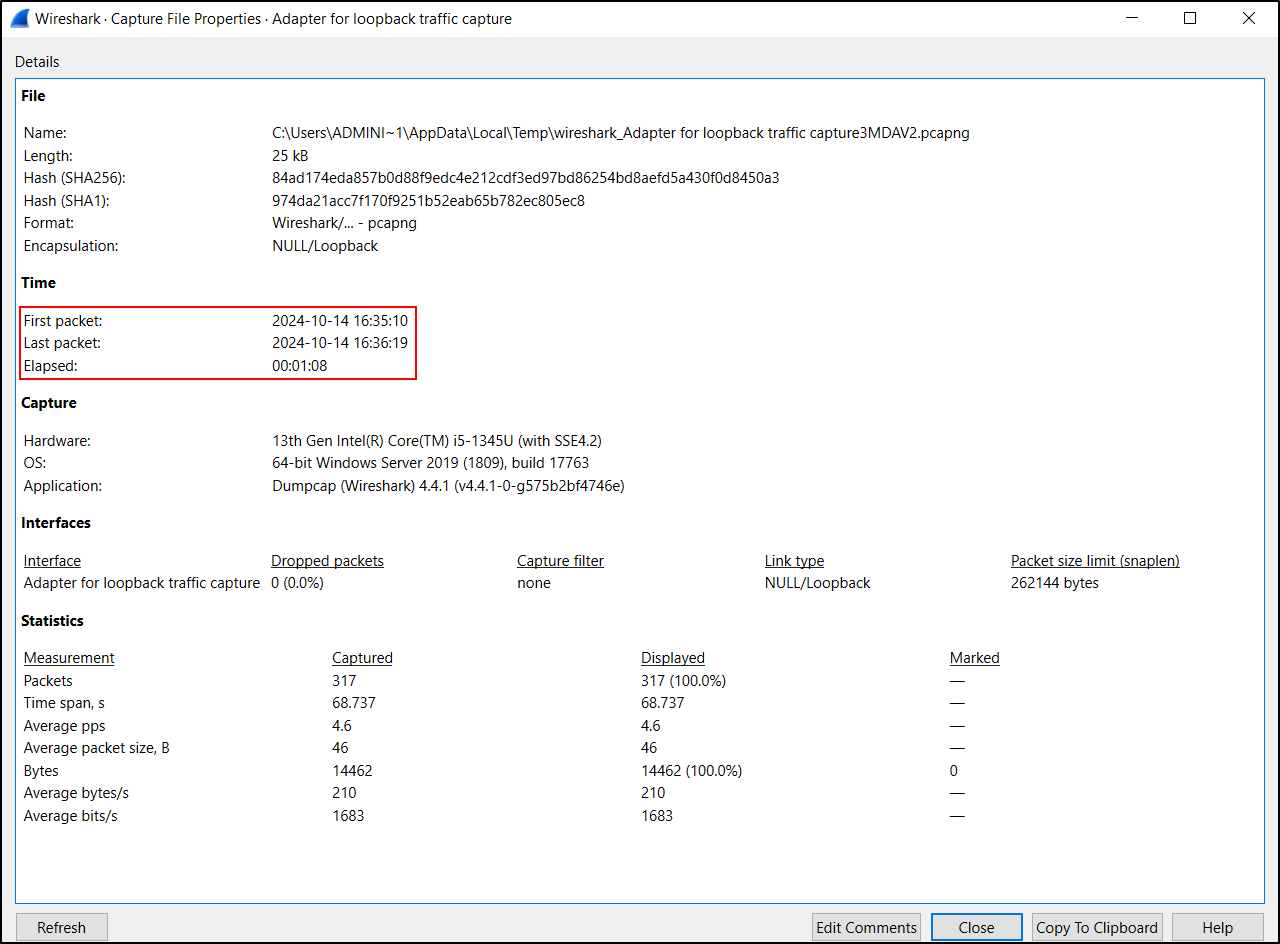
From the menu, select Statistics → Capture File Properties. You can see the times of the first and last packets and the elapsed capture time.
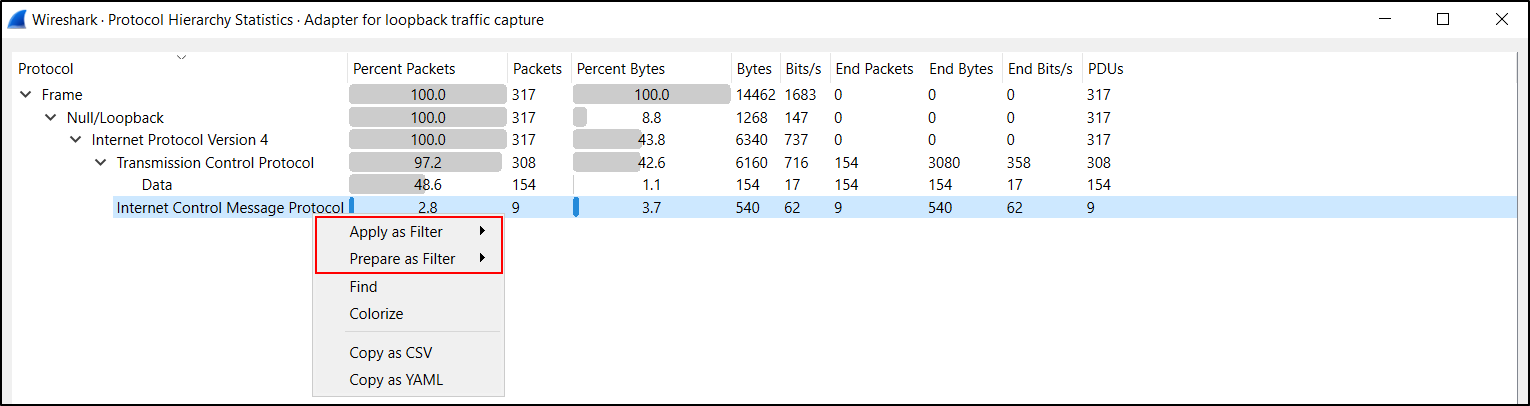
To view the protocol hierarchy, select Statistics → Protocol Hierarchy. Wireshark presents a list of protocols found in the PCAP.

Right-click a selected value to apply it immediately as a display filter or prepare a filter for further editing.
To view conversations, select Statistics → Conversations, then select the IPv4 tab. This summarizes communication between pairs of hosts.
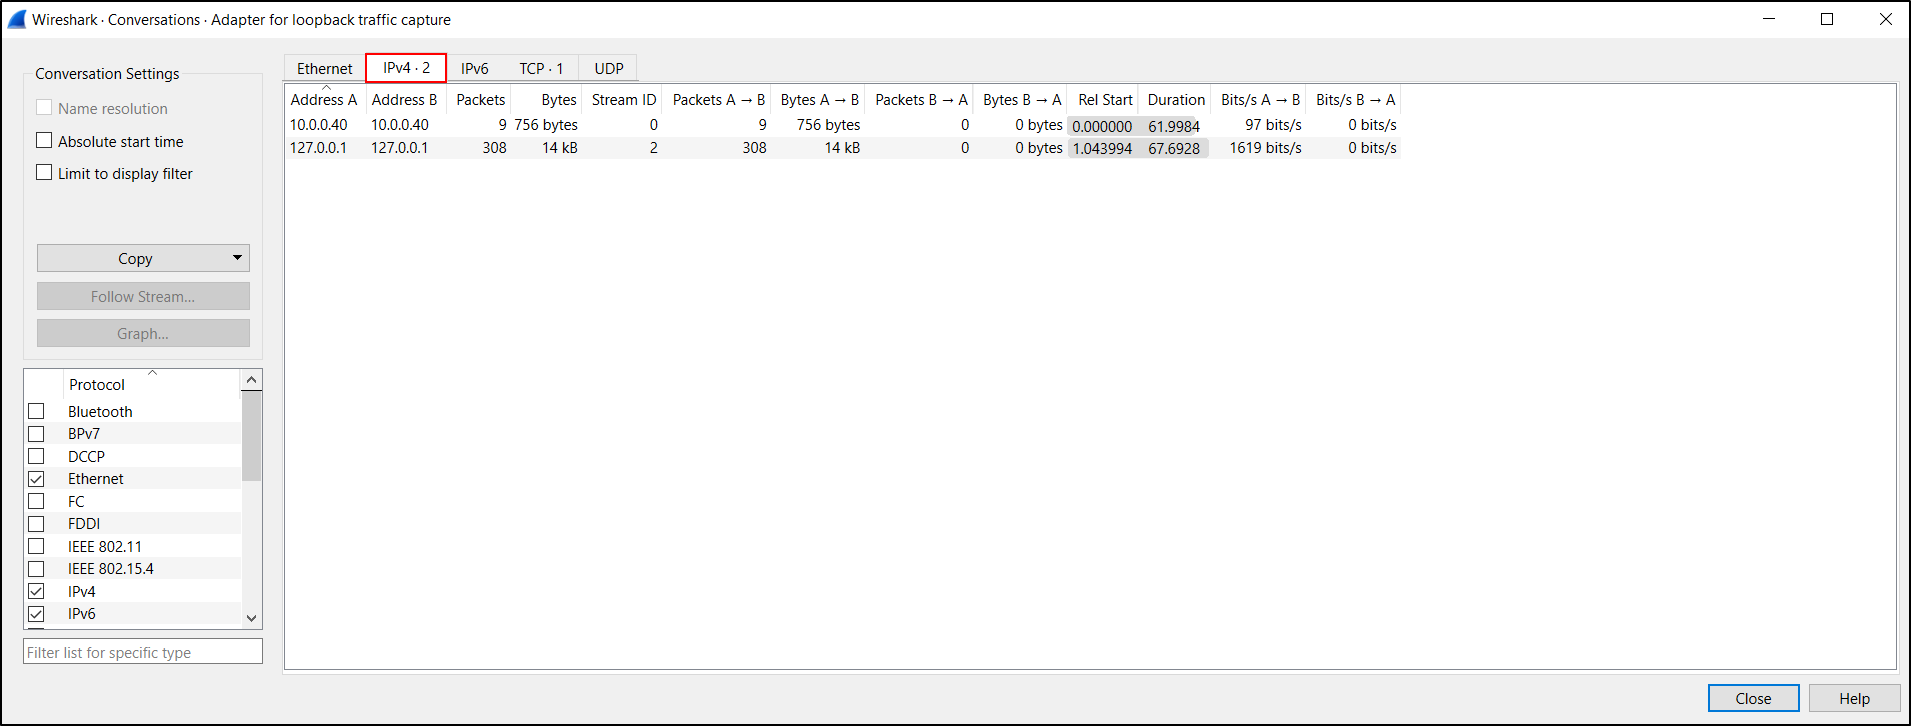
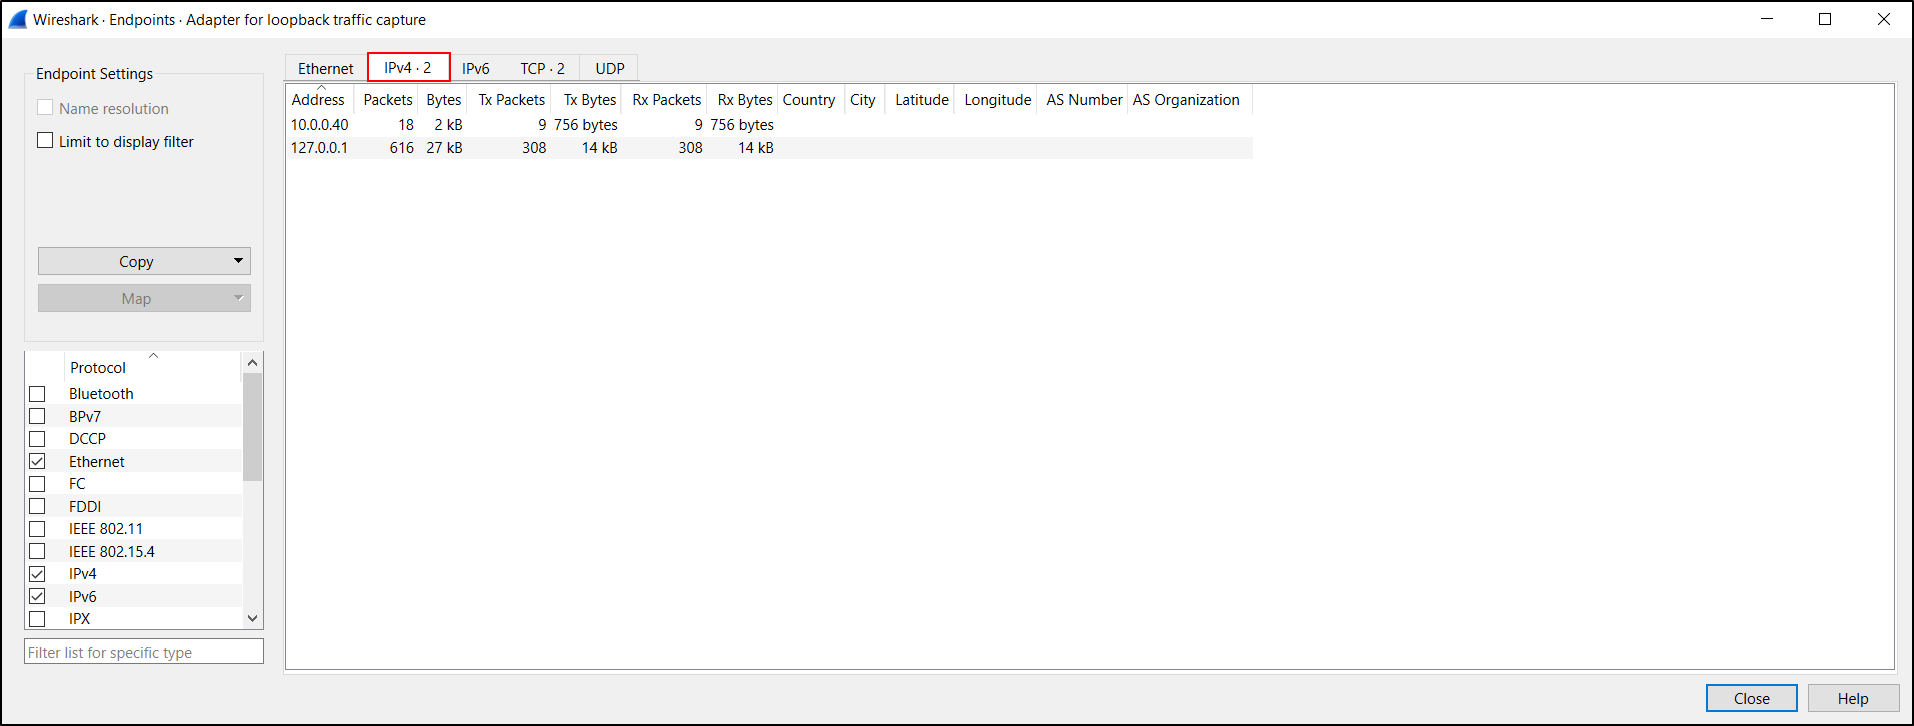
To view endpoints, select Statistics → Endpoints, then select the IPv4 tab. This identifies the IPv4 endpoints present in the PCAP.
Capture checkpoint
This journey is complete when Wireshark opens, lists the expected interfaces, and can start and stop a test capture. If no interfaces appear, check the Npcap installation and the permissions of the current account.