Explore Analyst Tools
Learn which Security Onion interface to use for each common analyst task.
Choose the right tool
| Goal | Primary tool | Expected outcome |
|---|---|---|
| Check platform health | Grid | Required nodes and services are healthy |
| Review detections | Alerts | An alert receives a supported disposition |
| Preserve an investigation | Cases | Evidence, observables, and notes are retained |
| Search telemetry | Hunt | A hypothesis is tested against relevant data |
| Review trends | Dashboards | Activity is summarised visually |
| Examine network evidence | PCAP | Packet evidence supports or challenges the finding |
| Decode an artifact | CyberChef | The transformation and output are recorded |
| Assess ATT&CK coverage | Navigator | Detection coverage and gaps are identified |
Detailed tool walkthrough
Introduction to Security Onion
This documentation is based on content from the Security Onion Essentials course by Security Onion Solutions. Some examples have been adapted to reflect my lab setup, which uses Standalone mode instead of Evaluation mode.
Analyst Tools
Overview
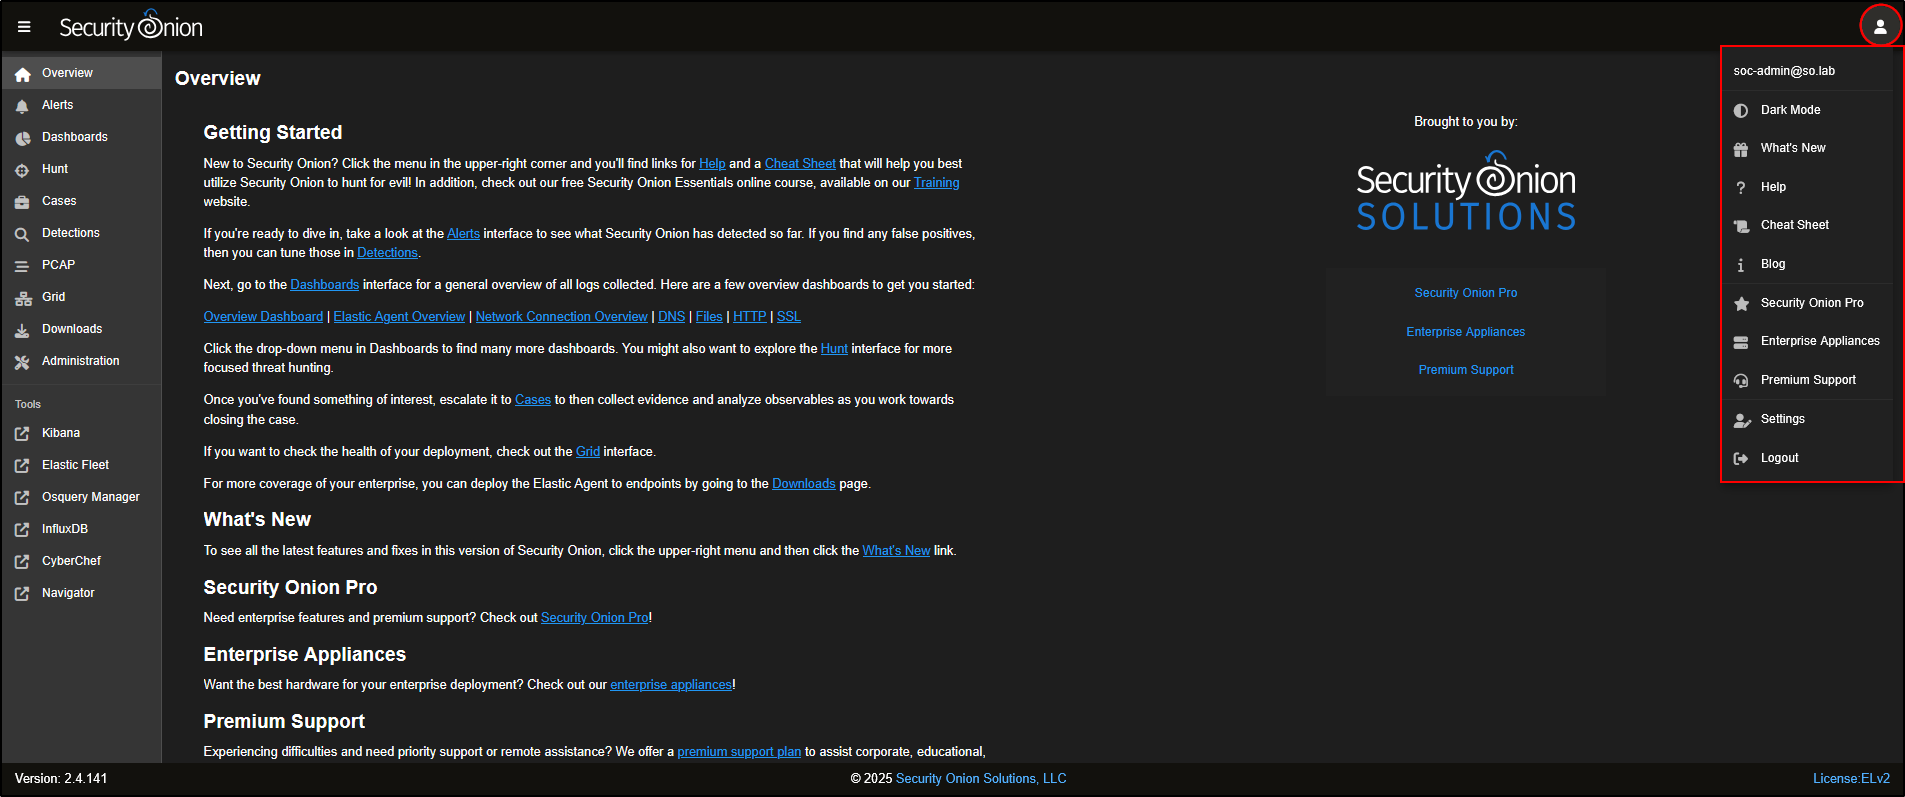
On the Overview page, you’ll find a silhouette icon in the top-right corner of the SOC interface. Clicking this opens up options like Dark Mode, the Cheat Sheet, the Blog, and your Account Settings.
Tip: Both the Cheat Sheet and the Security Onion documentation are available offline, so you can still access them even without an internet connection.
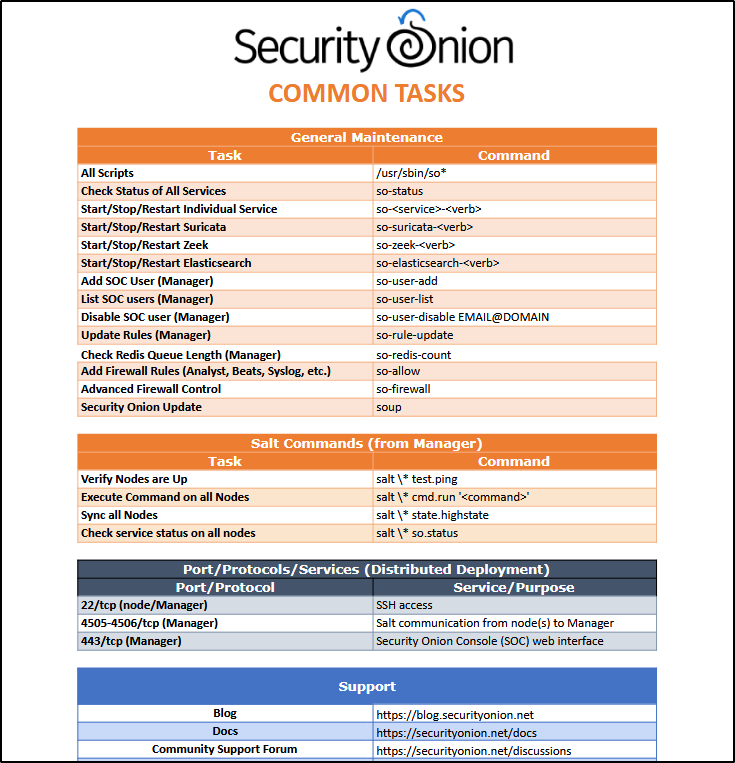
The Cheat Sheet is a handy reference that lists commonly used commands for day-to-day tasks in Security Onion.
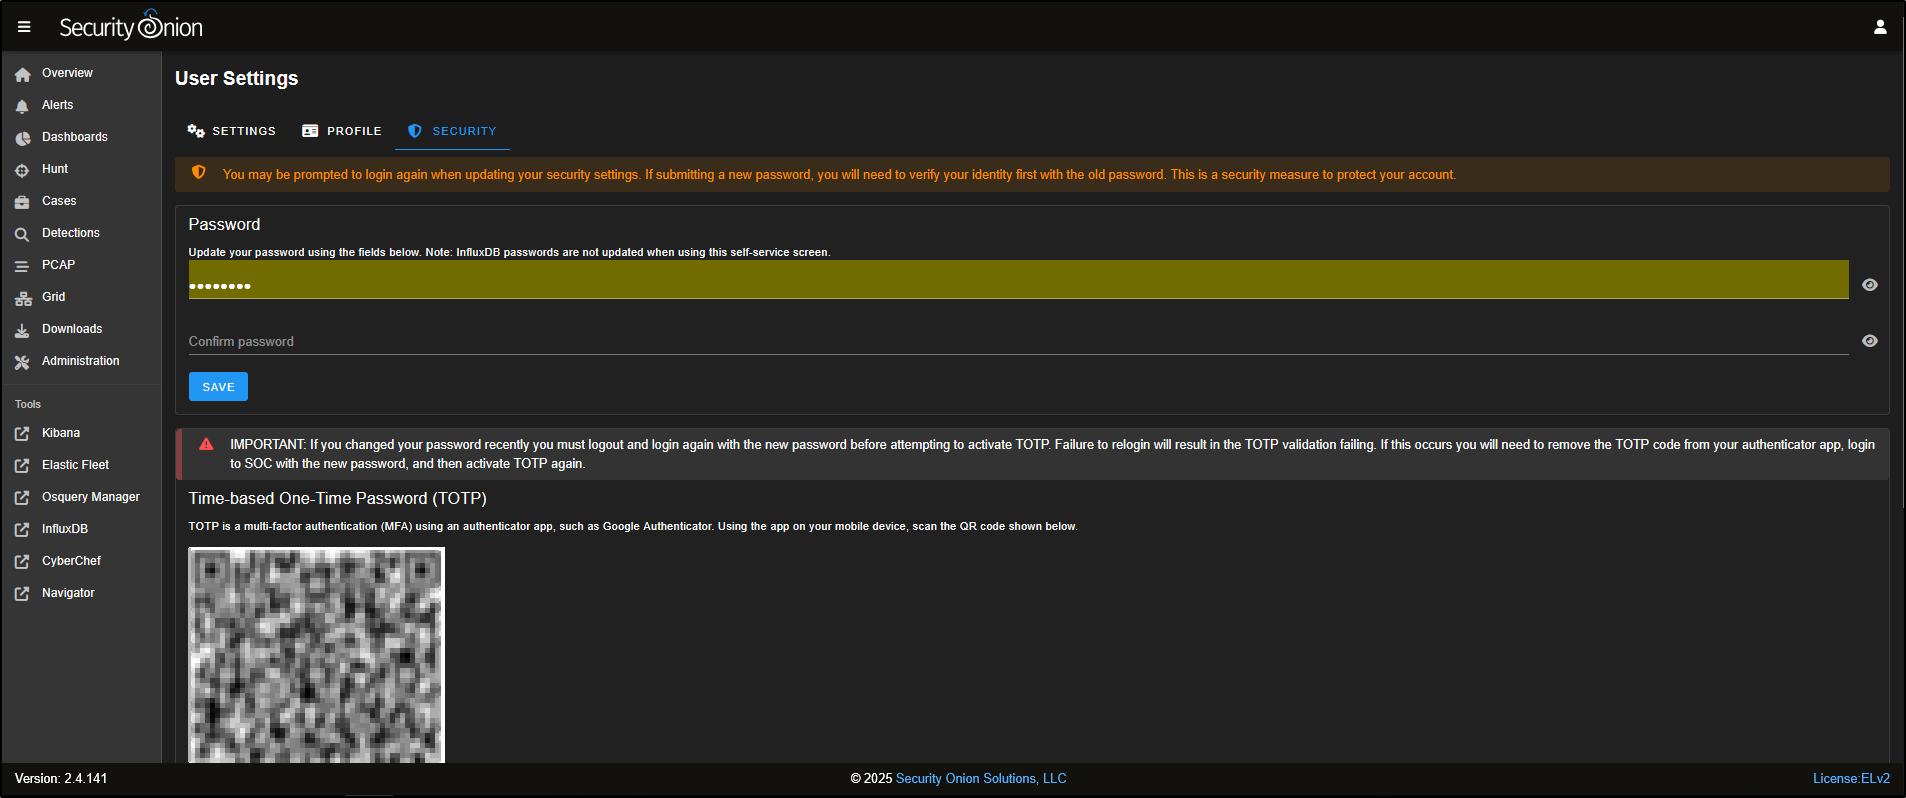
In the Account Settings menu, go to the Security tab to update your password or set up Multi-Factor Authentication (MFA) using Time-based One-Time Passwords (TOTP).
Grid
The Grid displays all the nodes that have been deployed in your Security Onion setup. In this example, there is only one node (so-standalone) listed.
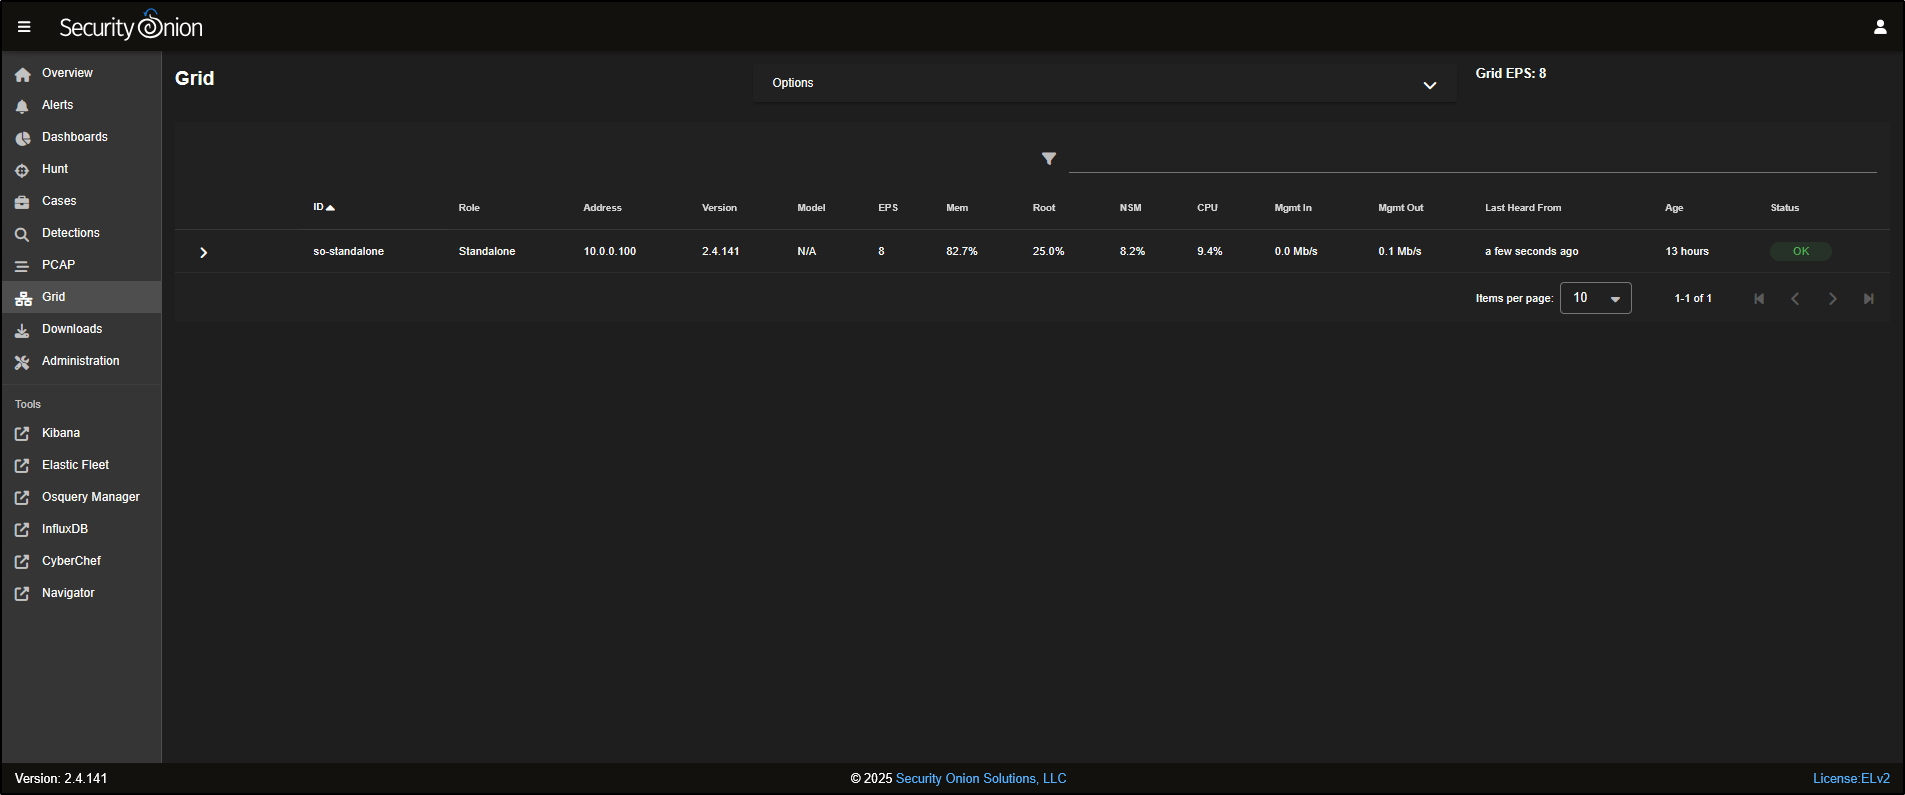
Clicking on the node will reveal more information, including the status of the node itself and the containers running on it.
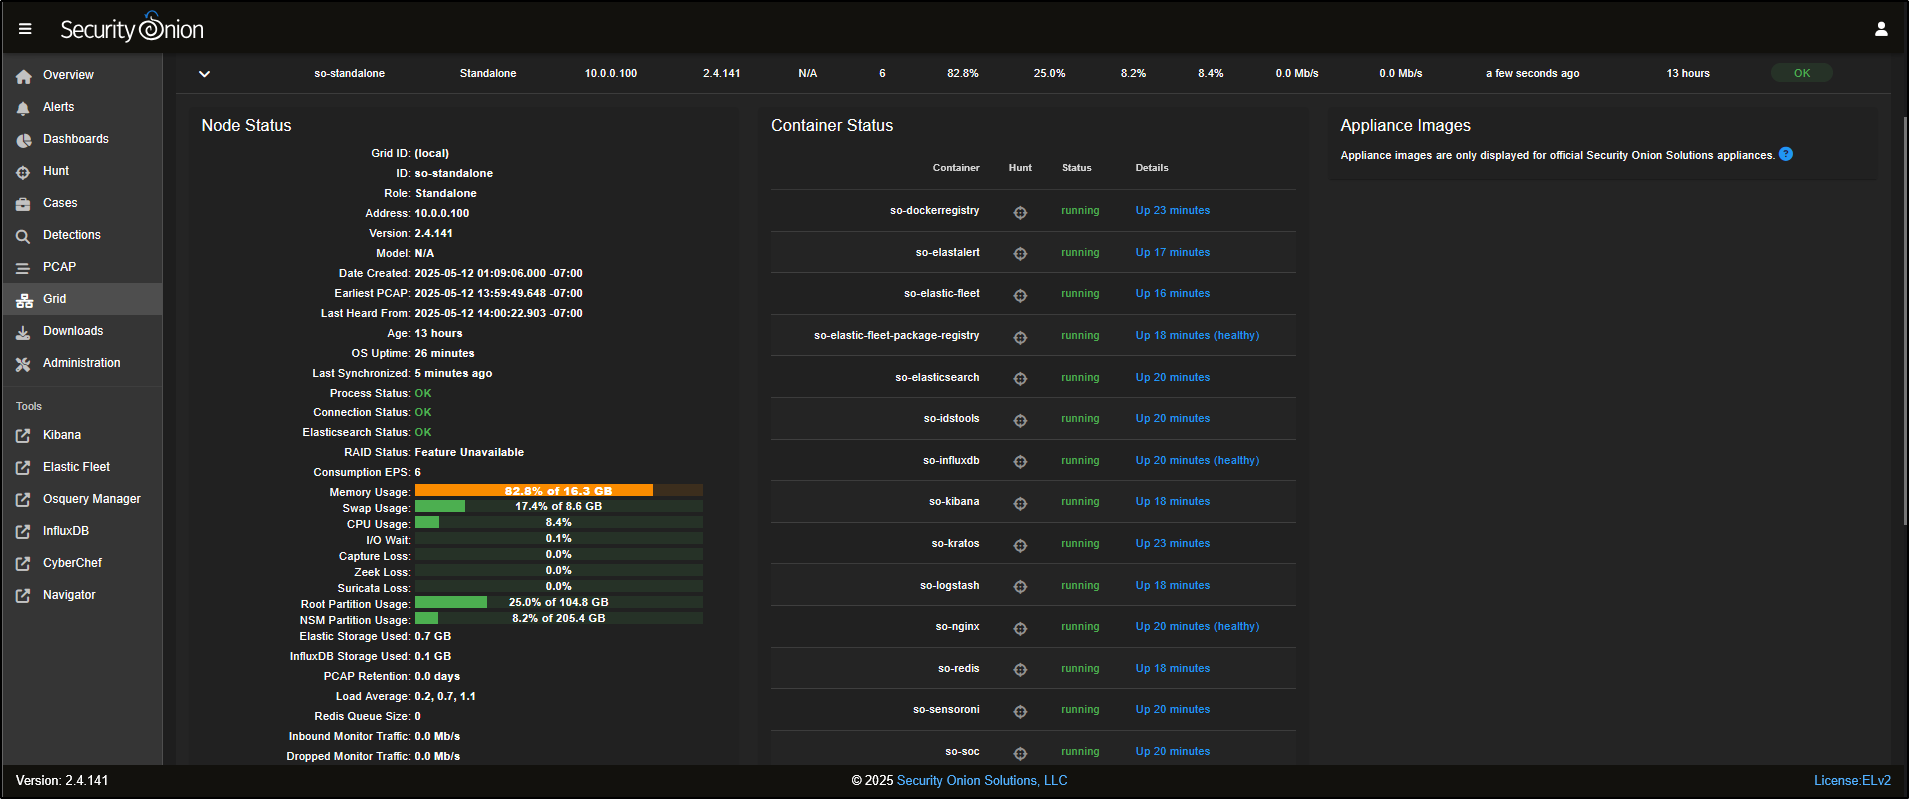
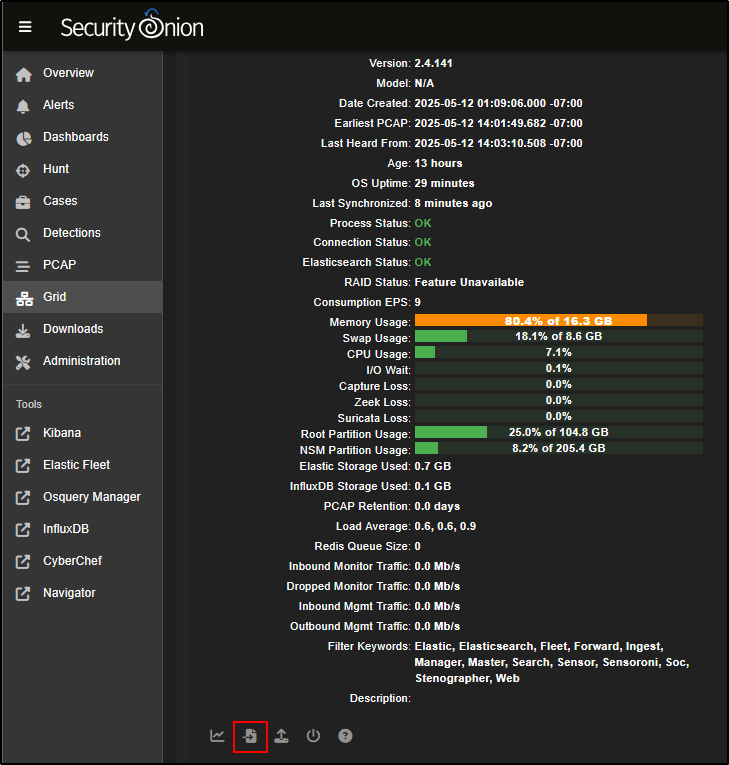
At the bottom of the Node Status panel, you’ll see five icons. From right to left:
- The help icon opens documentation for the Grid interface.
- The power button lets you reboot the node.
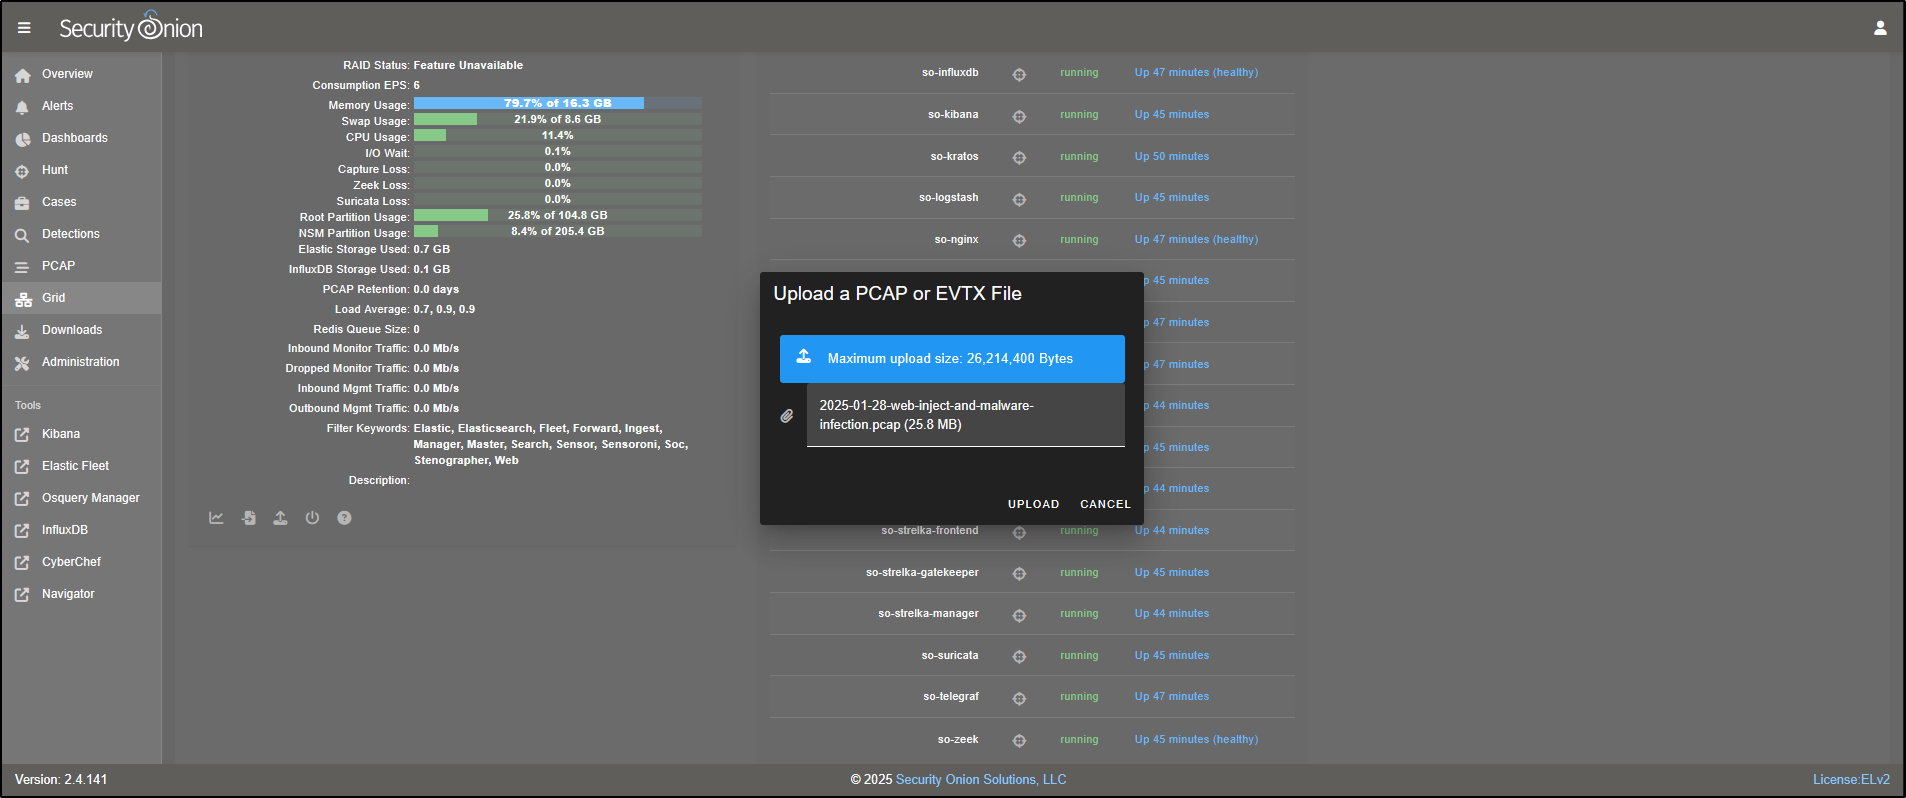
- The upload icon allows you to manually import files such as PCAPs or EVTX logs.
- The test data icon lets you simulate sample alerts and logs.
- The node status icon gives a detailed overview of the node’s current state.
Click the test data icon to load example data into Security Onion for testing.
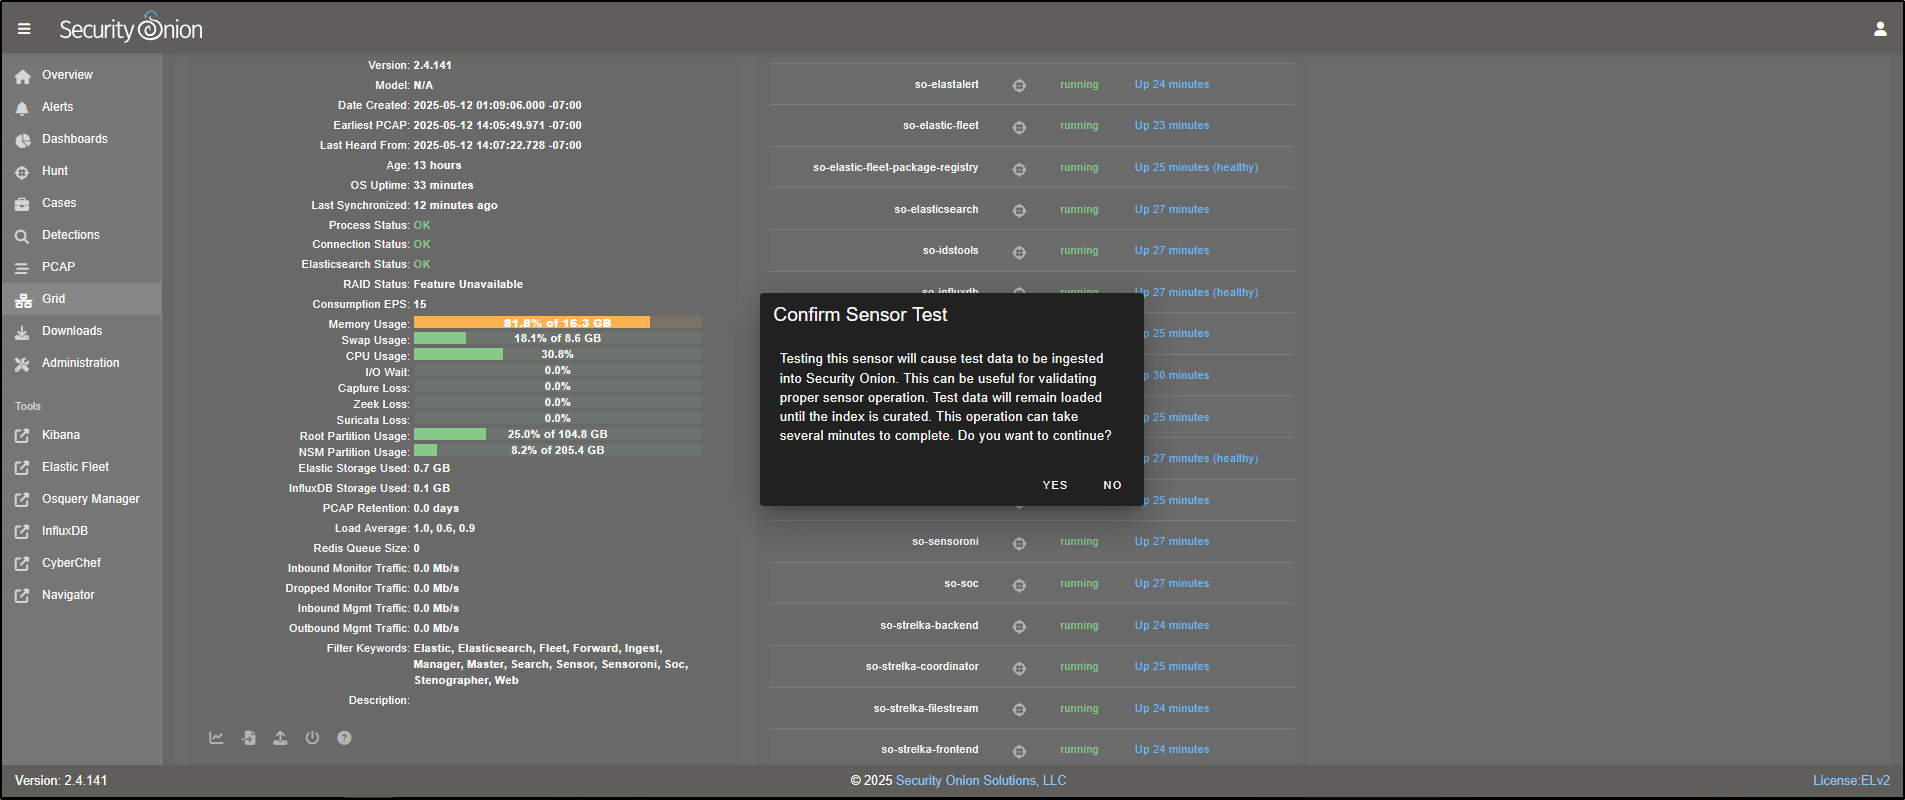
This will load sample test data into Security Onion for demonstration purposes. When prompted, click Yes to proceed. Please note that this can take several minutes to complete.
If you would like to import your own PCAP, download a sample, for example, **2025-01-28-web-inject-and-malware-infection.pcap. Then click the upload** icon and select the PCAP file to upload it into Security Onion.
Alerts
Go to the Alerts tab in the SOC interface. This is where you will find alerts for suspicious or potentially malicious activities in your environment.
It does not matter whether the alert comes from a Suricata, Sigma, or Yara rule. If the alert is triggered, it will show up here. By default, alerts are grouped by rule name. For example, you might see 11 alerts under the rule ET P2P BitTorrent Peer Sync.
Emerging Threats (ET) is a well-known set of intrusion detection rules. It is developed and maintained by the community (and by Proofpoint for the commercial version) and helps detect a wide variety of network-based threats.
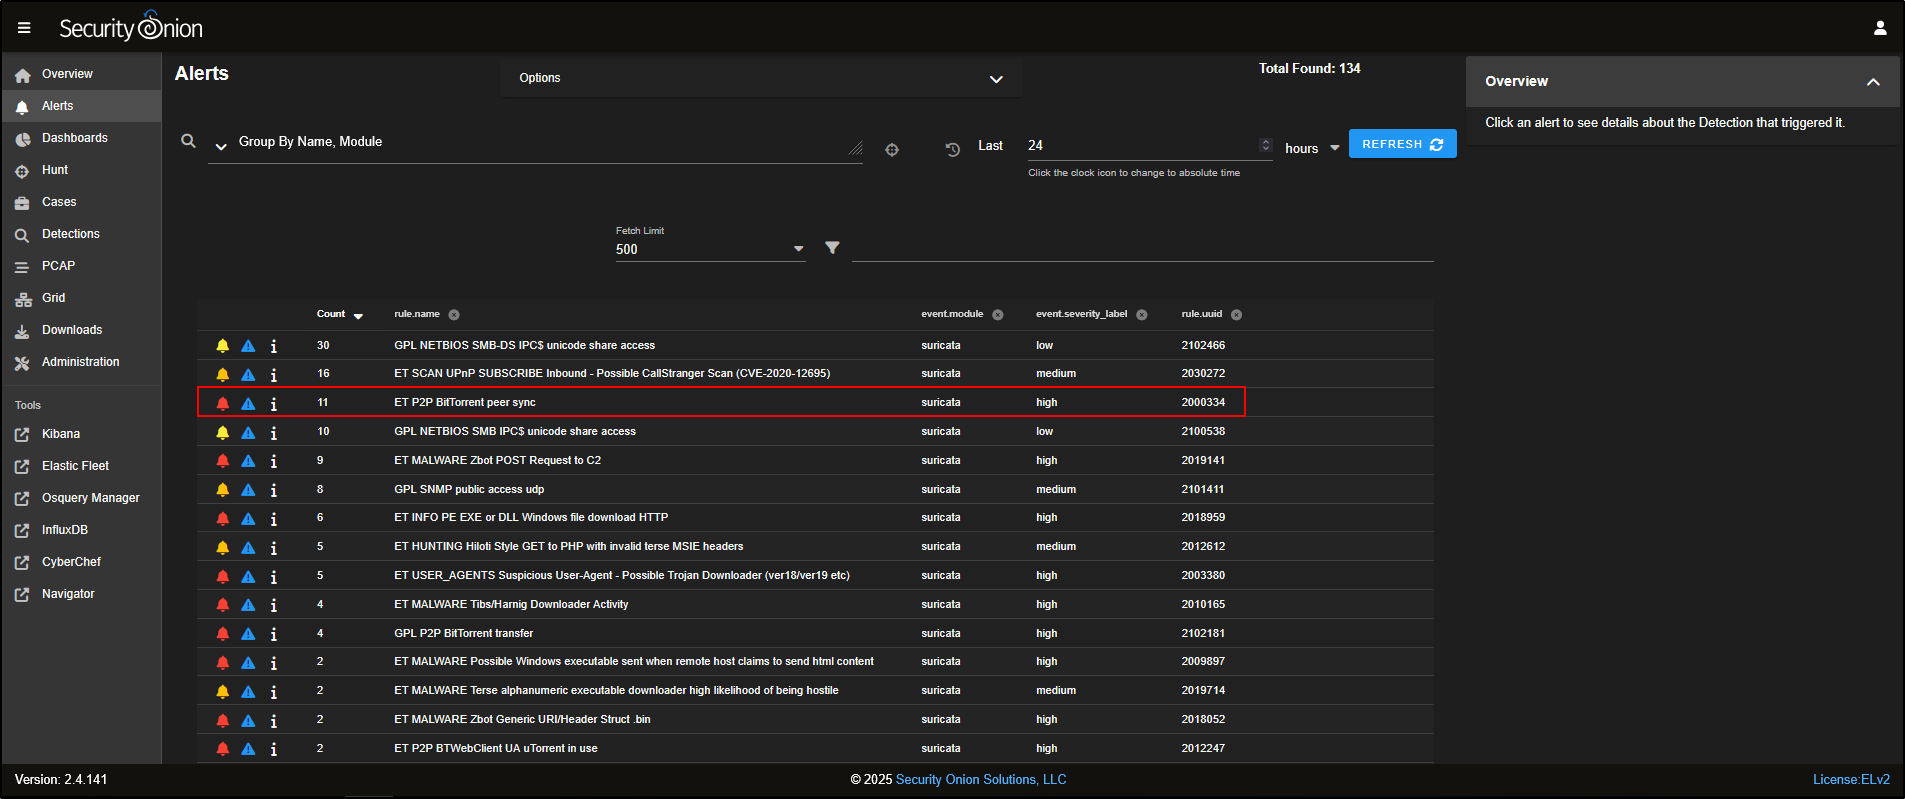
To look more closely at individual alerts, click on the number next to the rule name.
You will also see a few icons next to each alert:
- The bell icon is used to acknowledge the alert - this hides it from the main view but does not delete it.
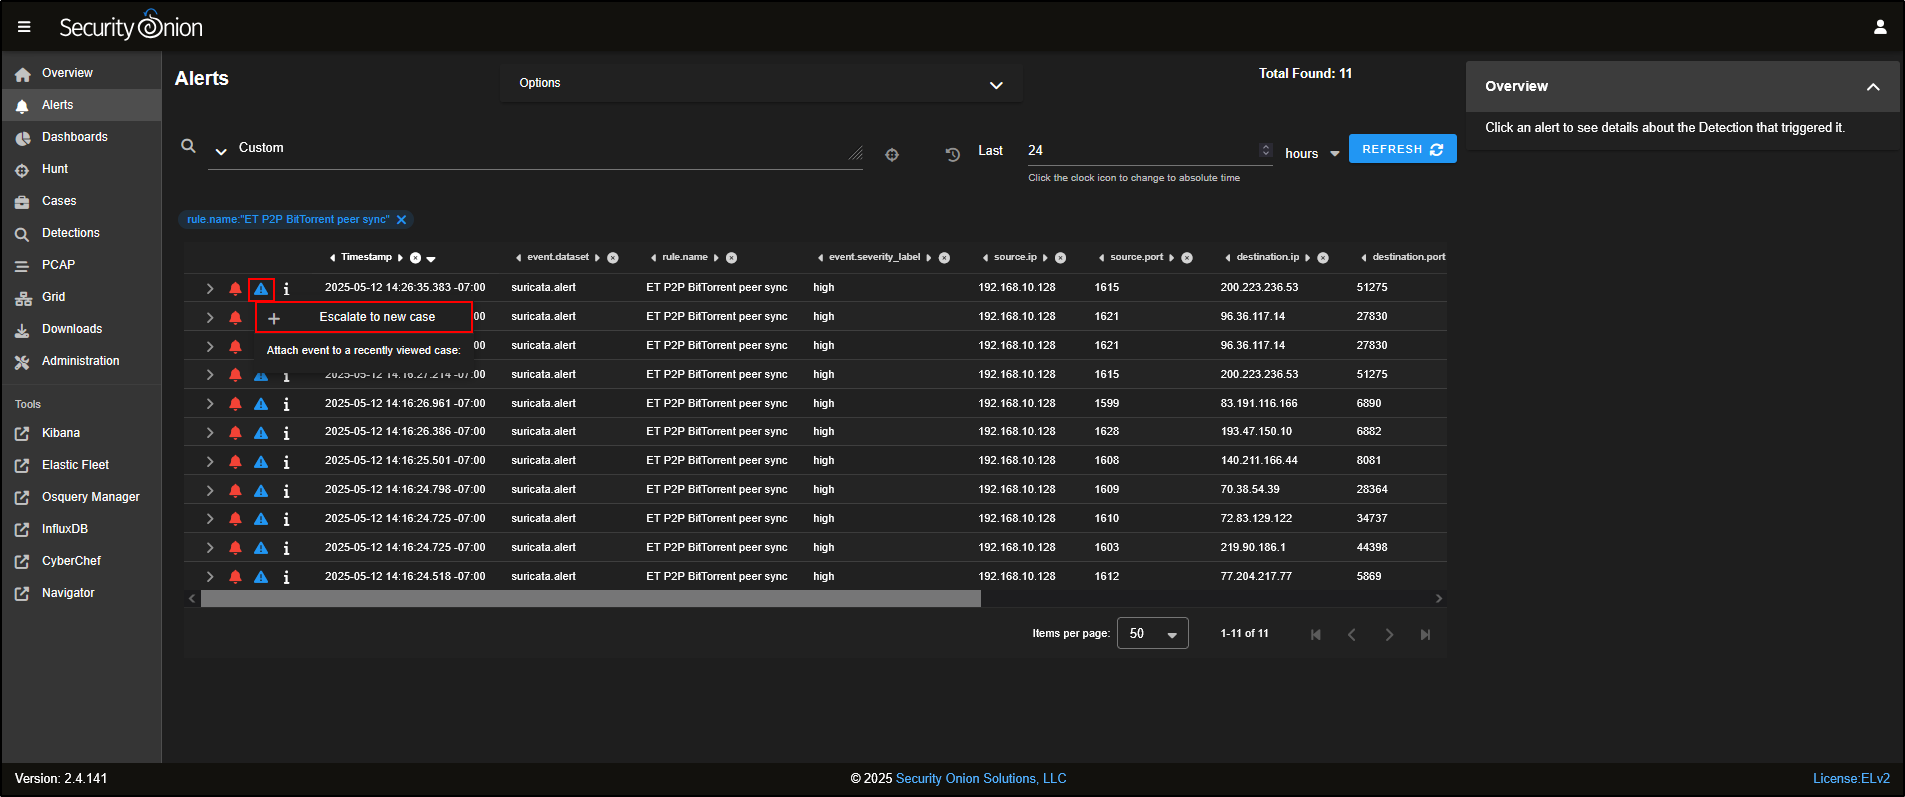
- The triangle icon is used to escalate the alert into a case for further investigation.
To escalate, simply click the triangle and choose Escalate to new case.
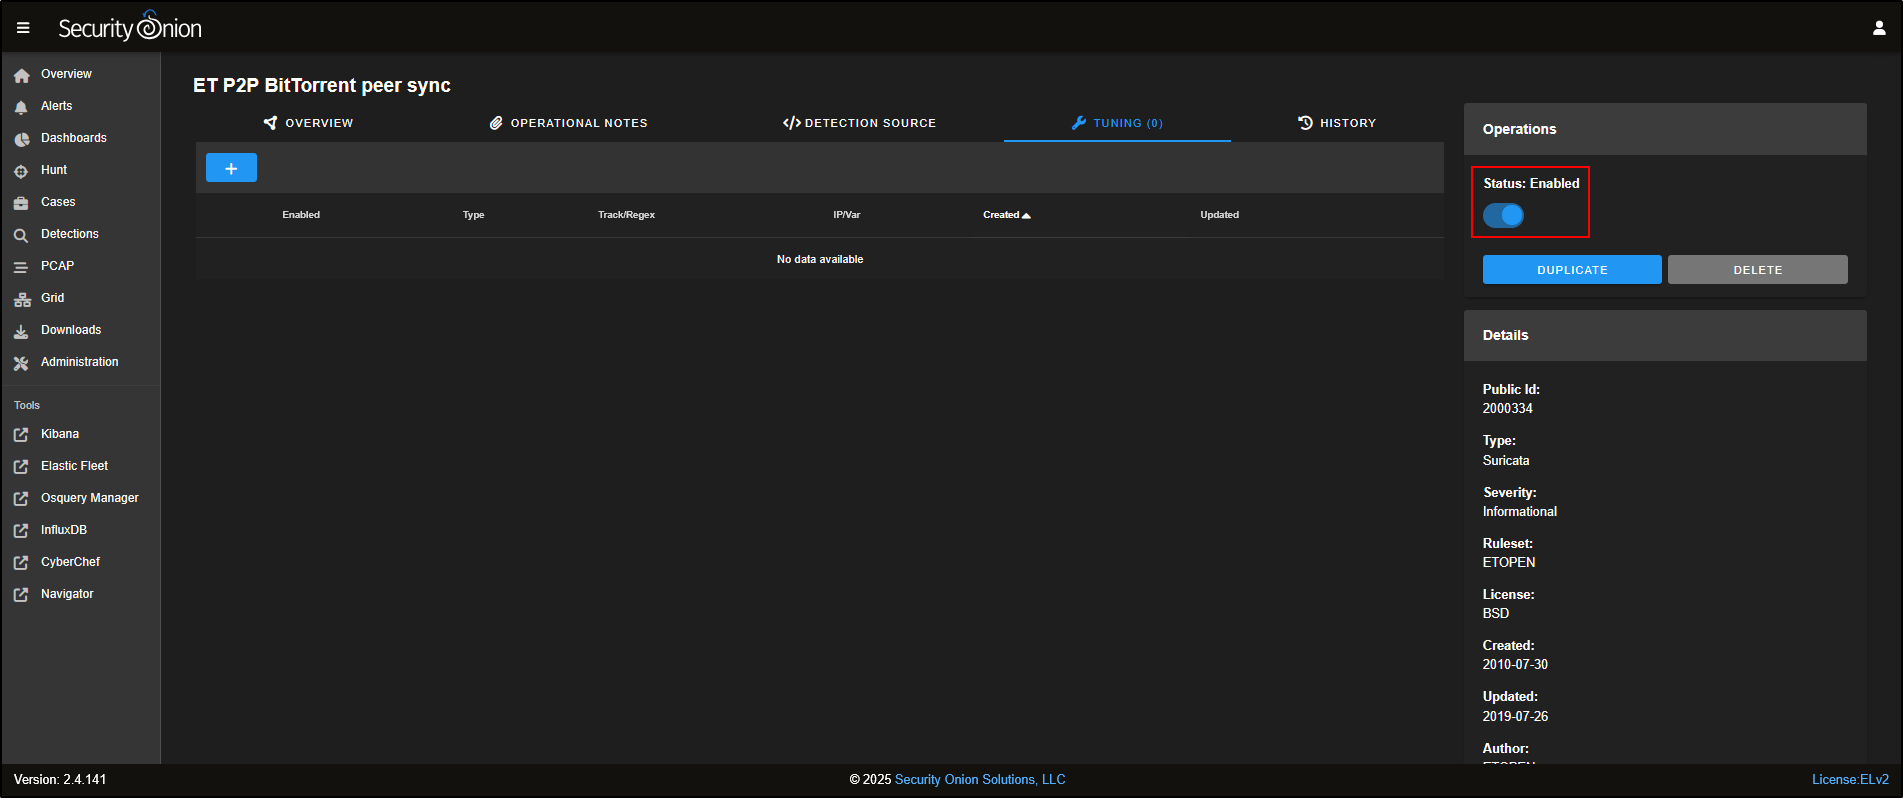
You can also fine-tune how a rule behaves by clicking on the rule name and selecting Tune Detection from the menu.
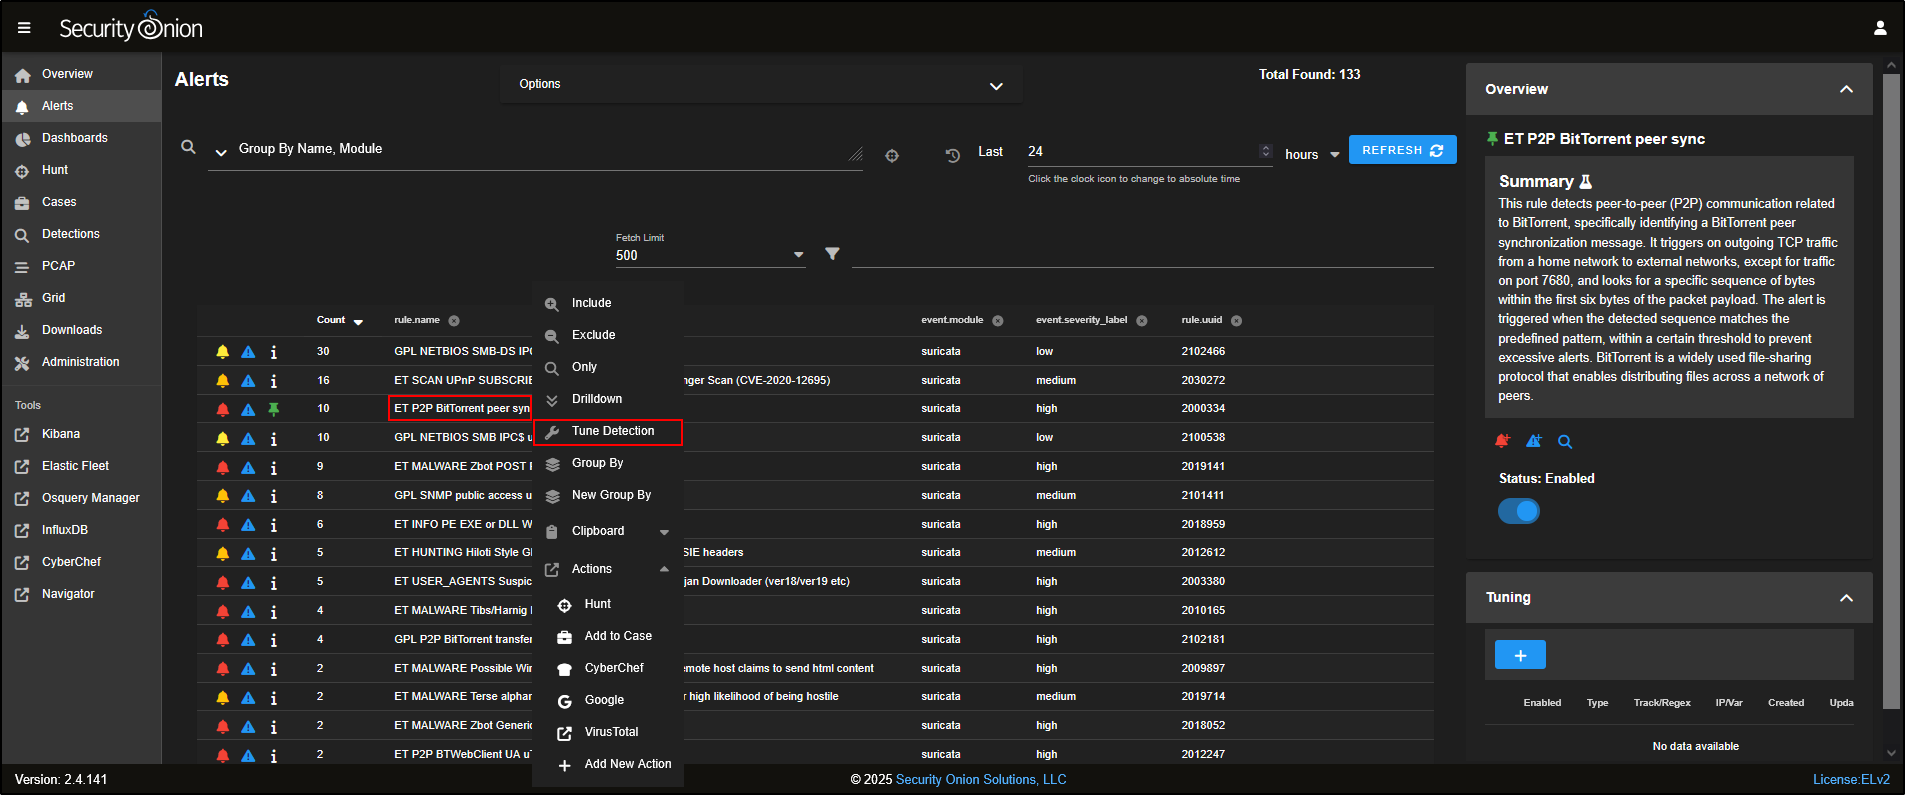
This opens the Tune Detection page, where you can enable or disable the rule, or adjust its settings to better suit your environment.
Cases
Go to the Cases tab in the SOC interface. You will see any cases that have been created, usually named after the alert that was escalated.
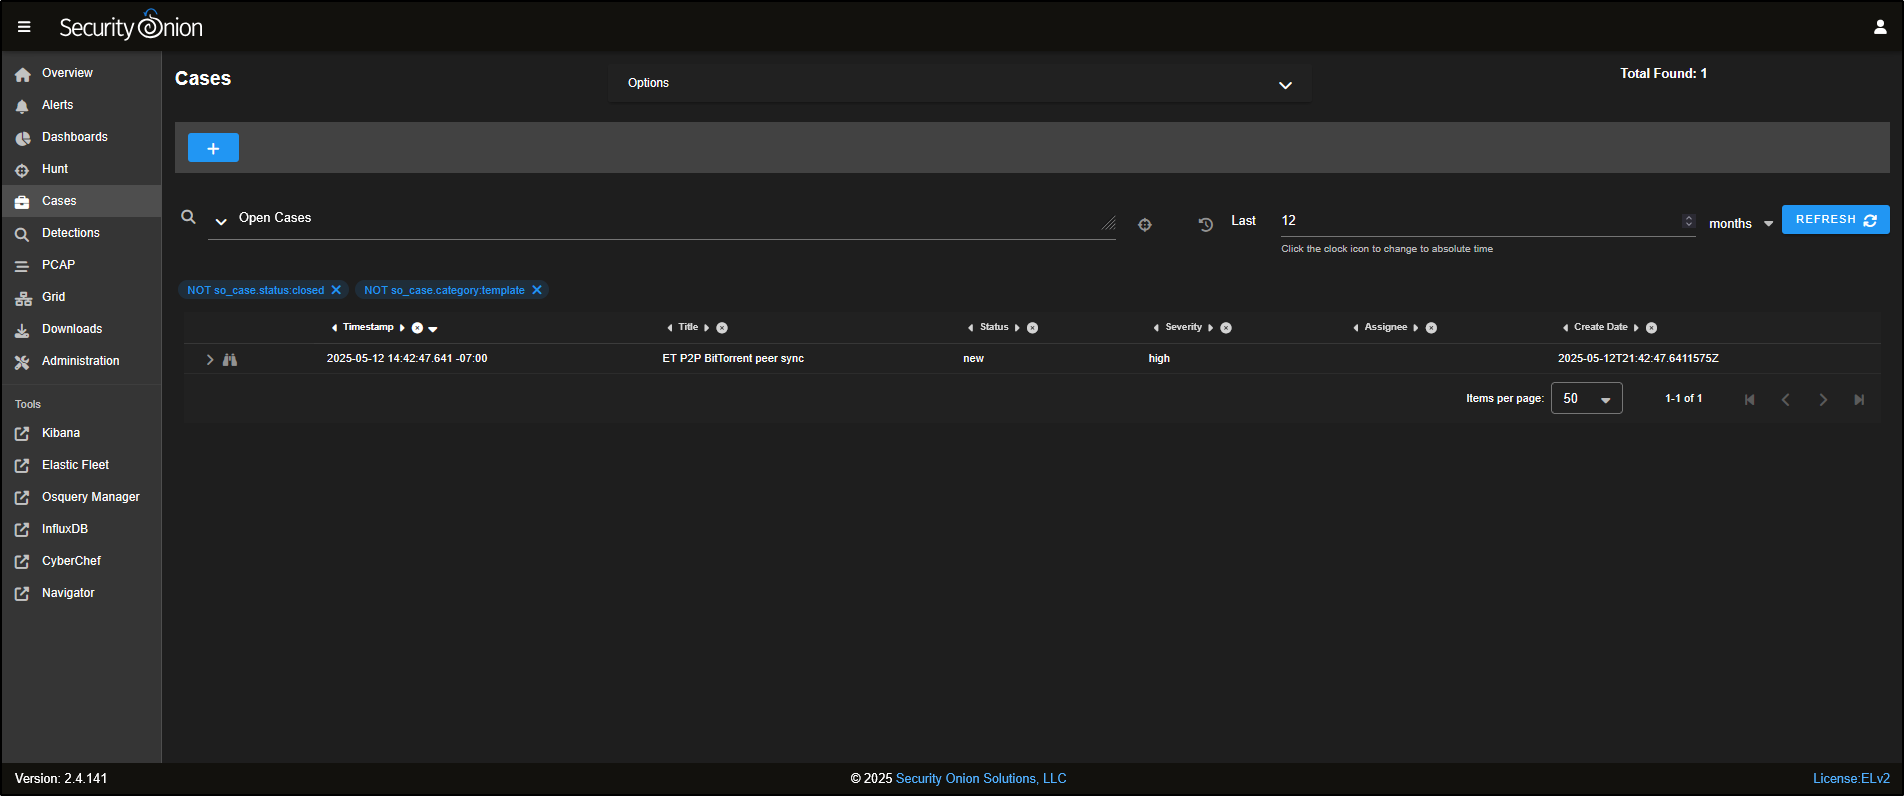
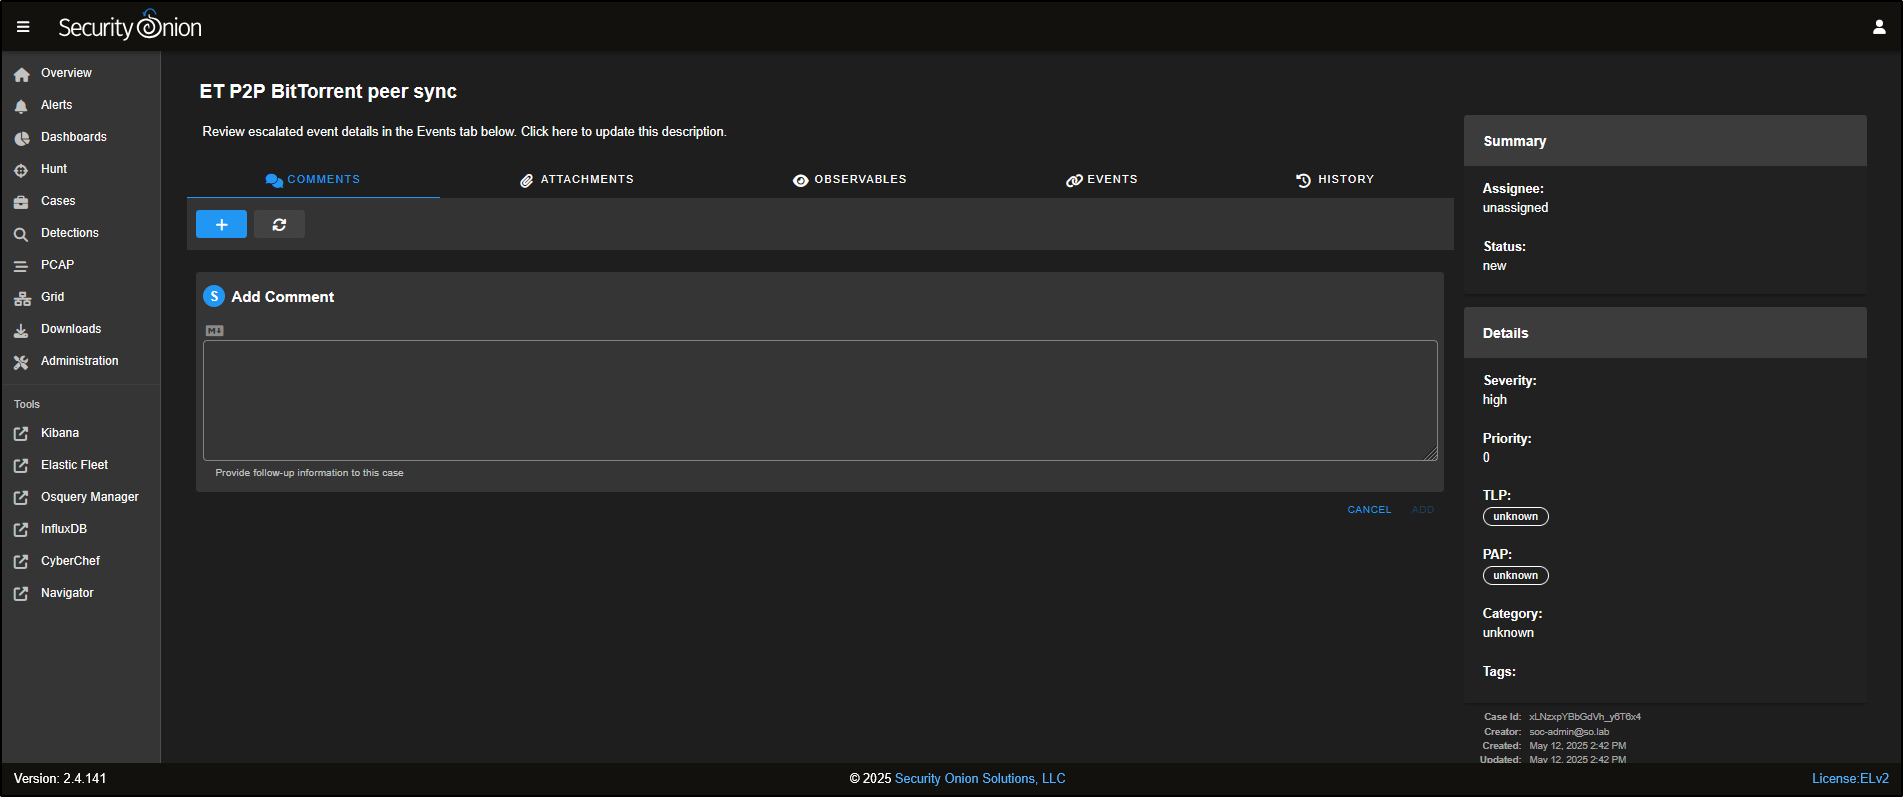
As you investigate, you can record notes and observations to track what triggered the alert. Click on the binoculars icon to open the case and add your comments or findings.
Hunt
Head over to the Hunt tab in the SOC interface. The Hunt tool is built to be a fast, flexible workspace for analysts to dig into data during investigations.
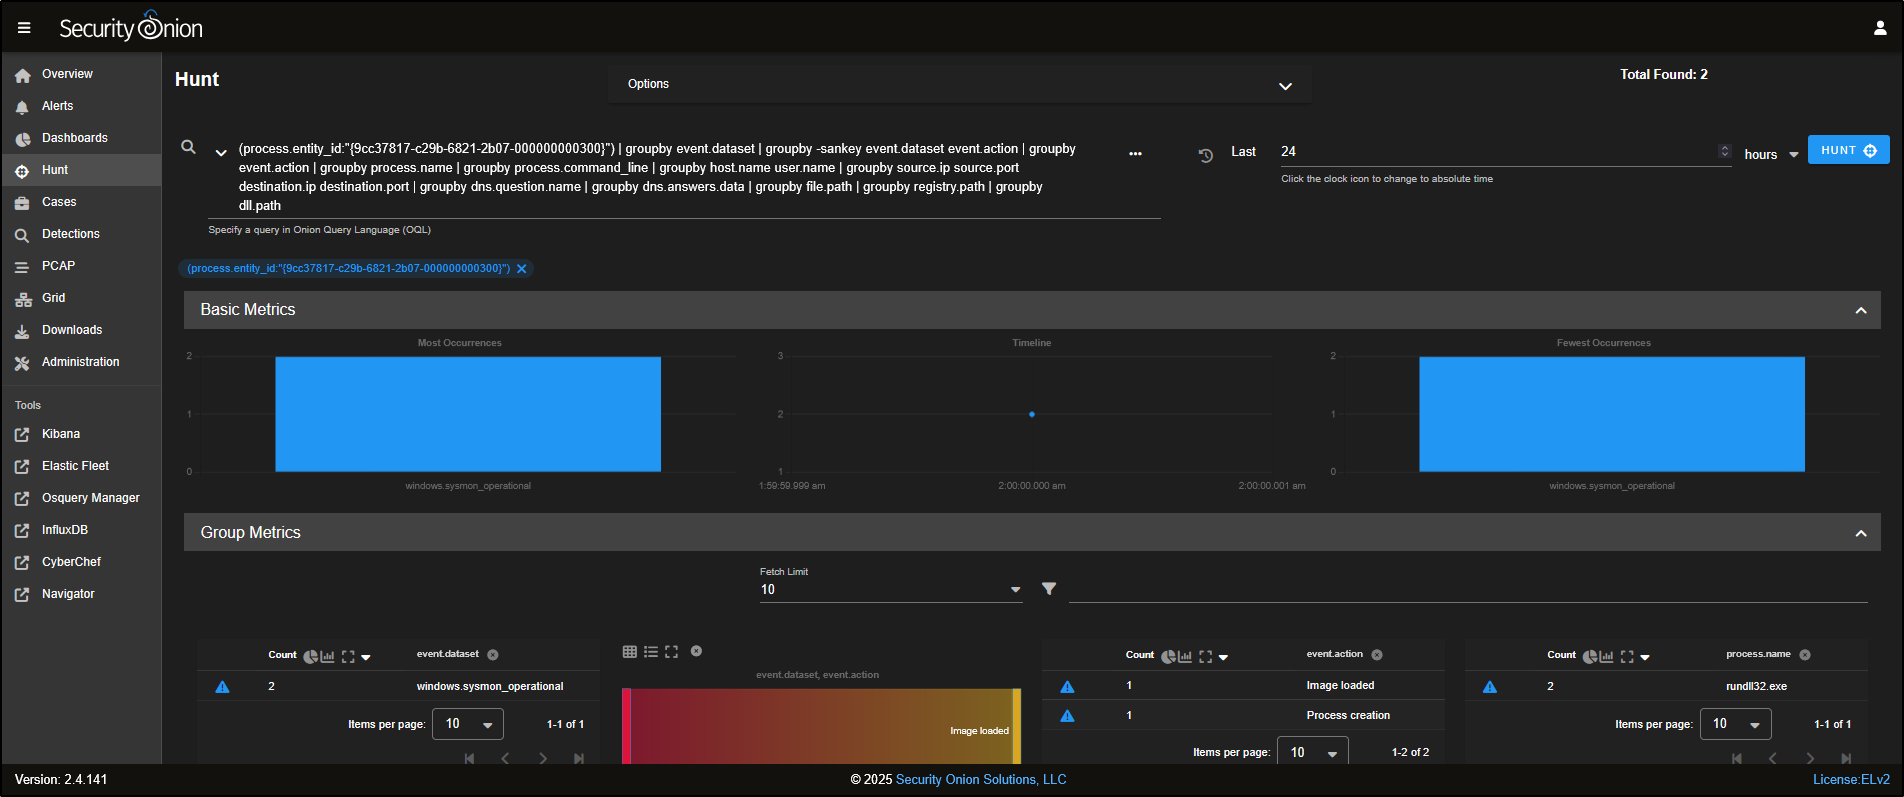
At the top of the Hunt page, you will find a query box, along with a list of prebuilt queries you can use straight away. You can also create your own custom queries tailored to your environment and use cases.
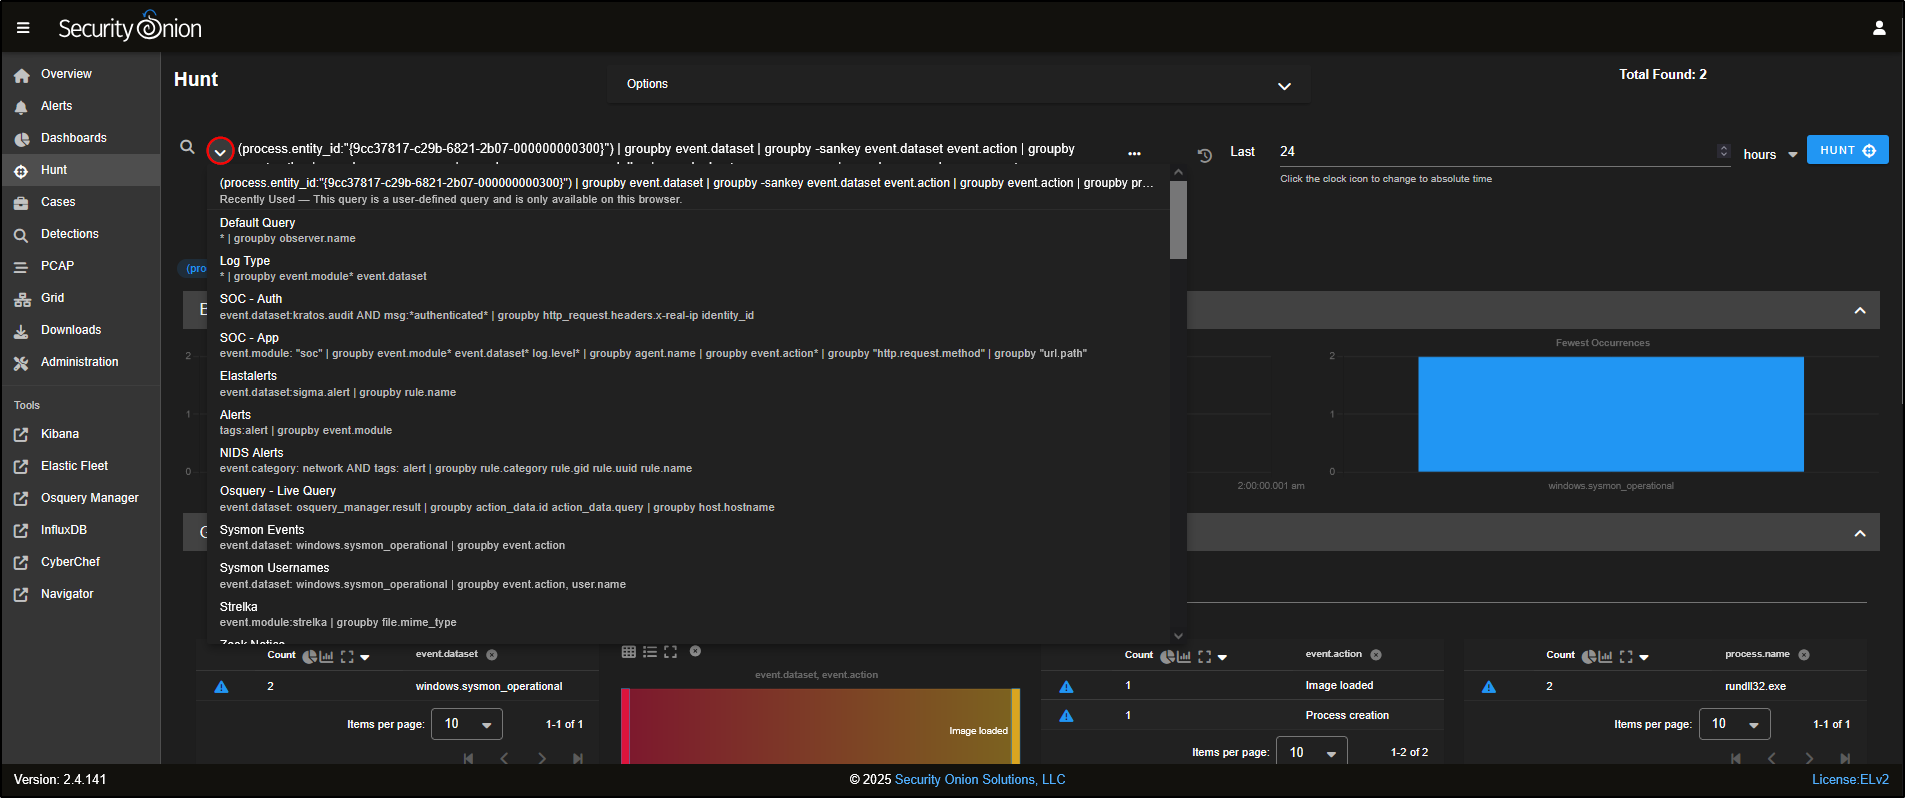
For example, the Log Type query shows all the different types of logs that Security Onion has collected. These logs are grouped into datasets based on the type of data and its source.
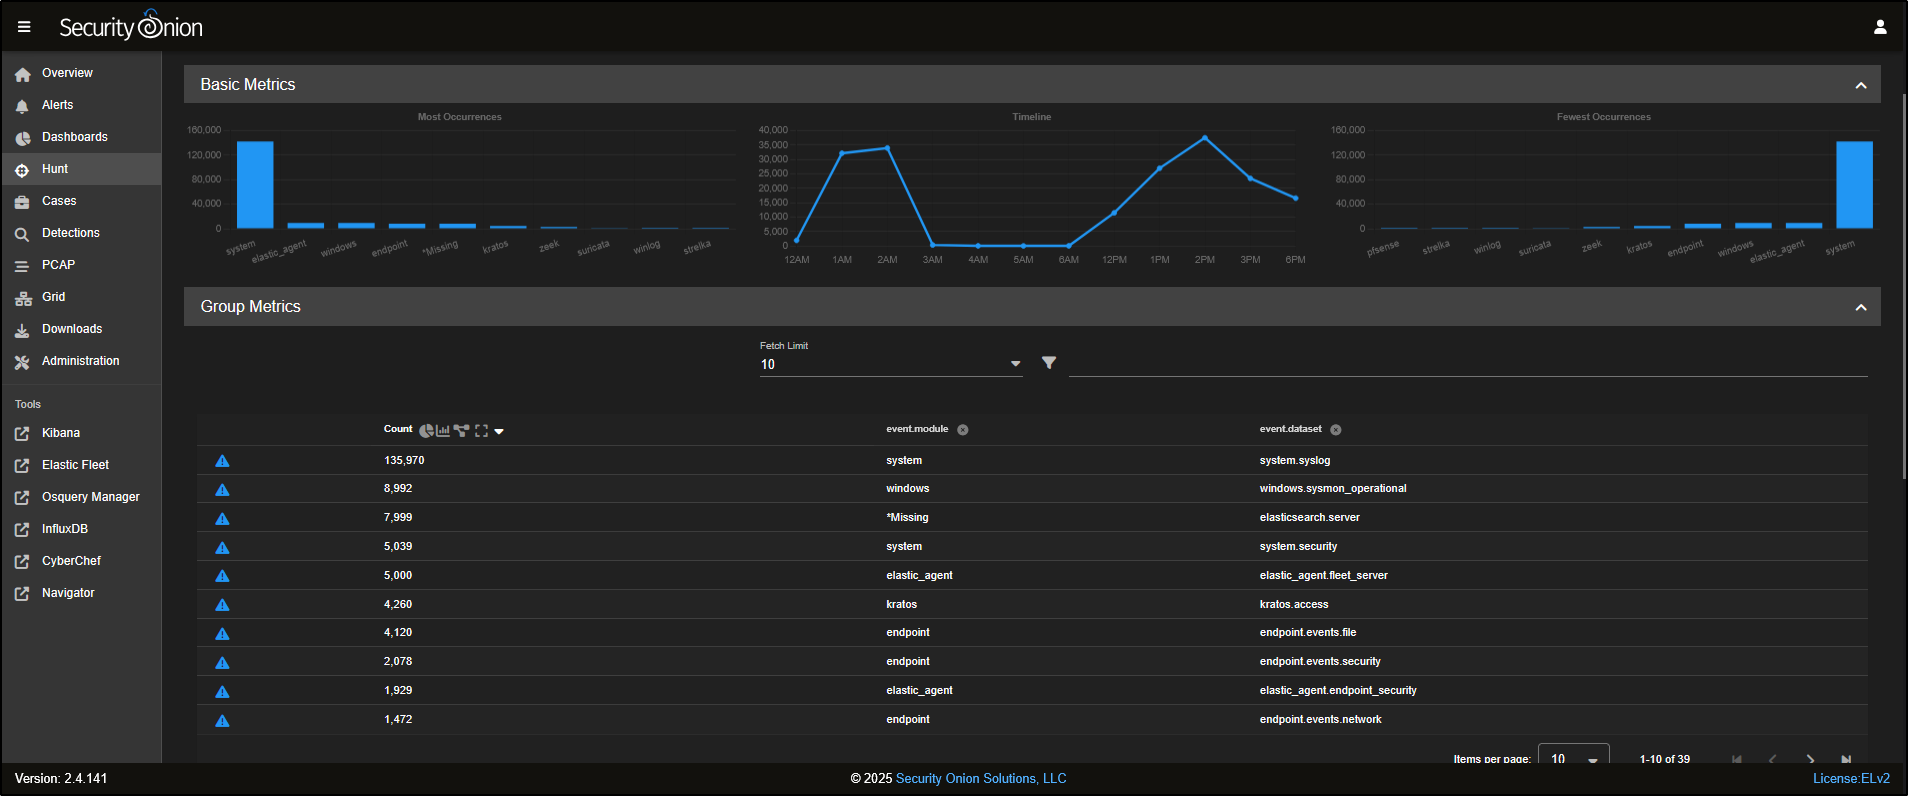
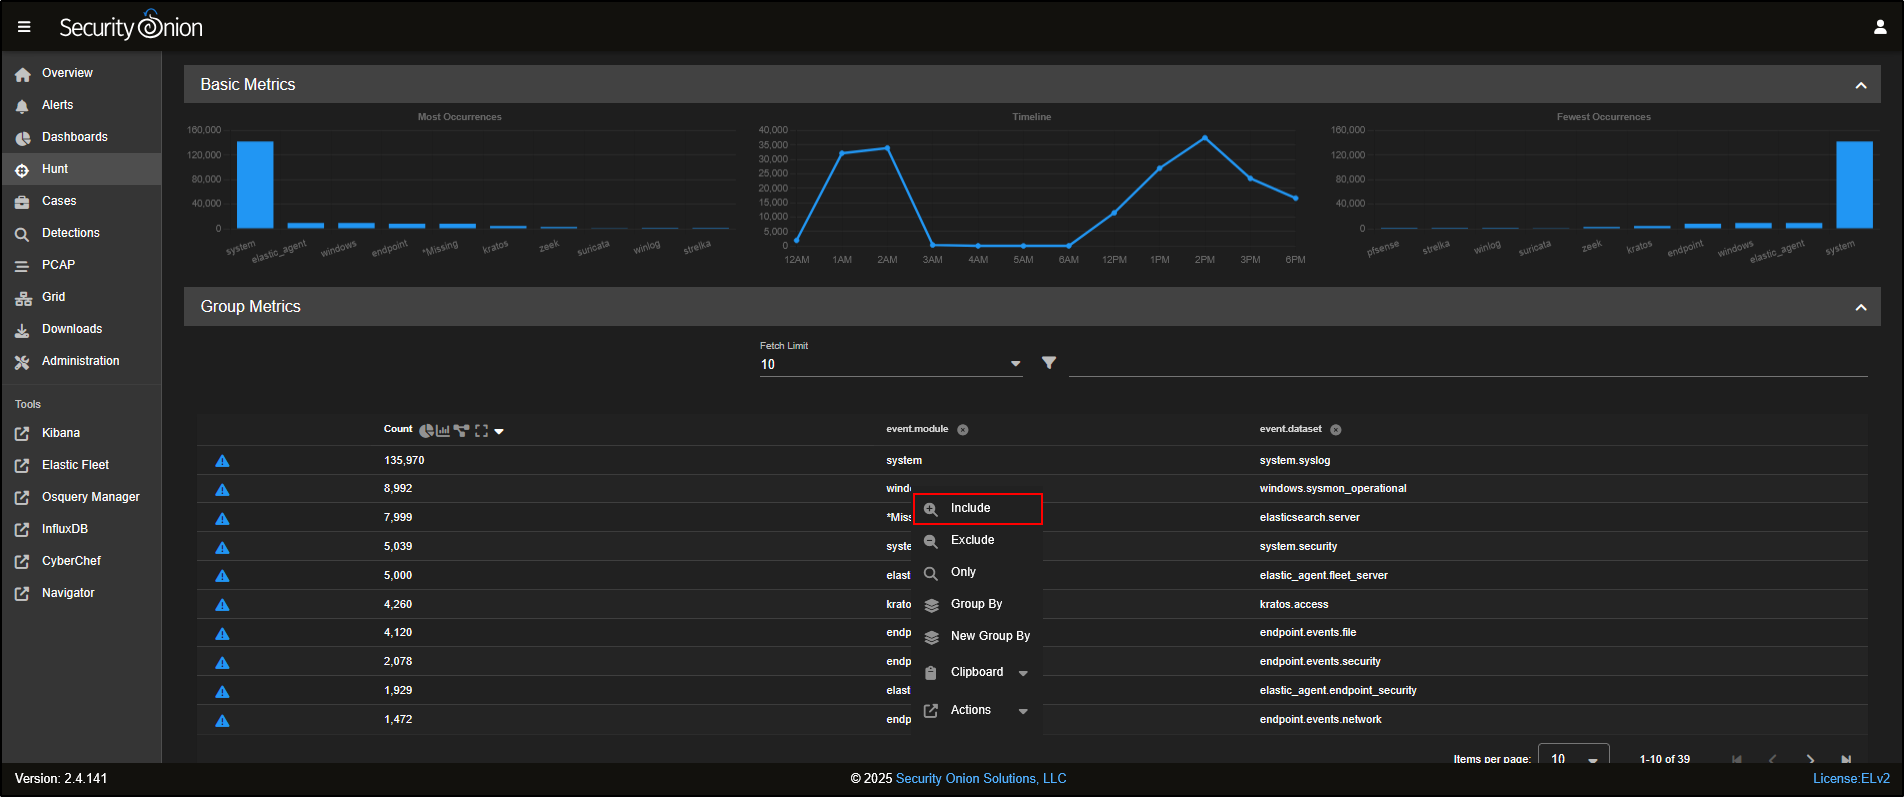
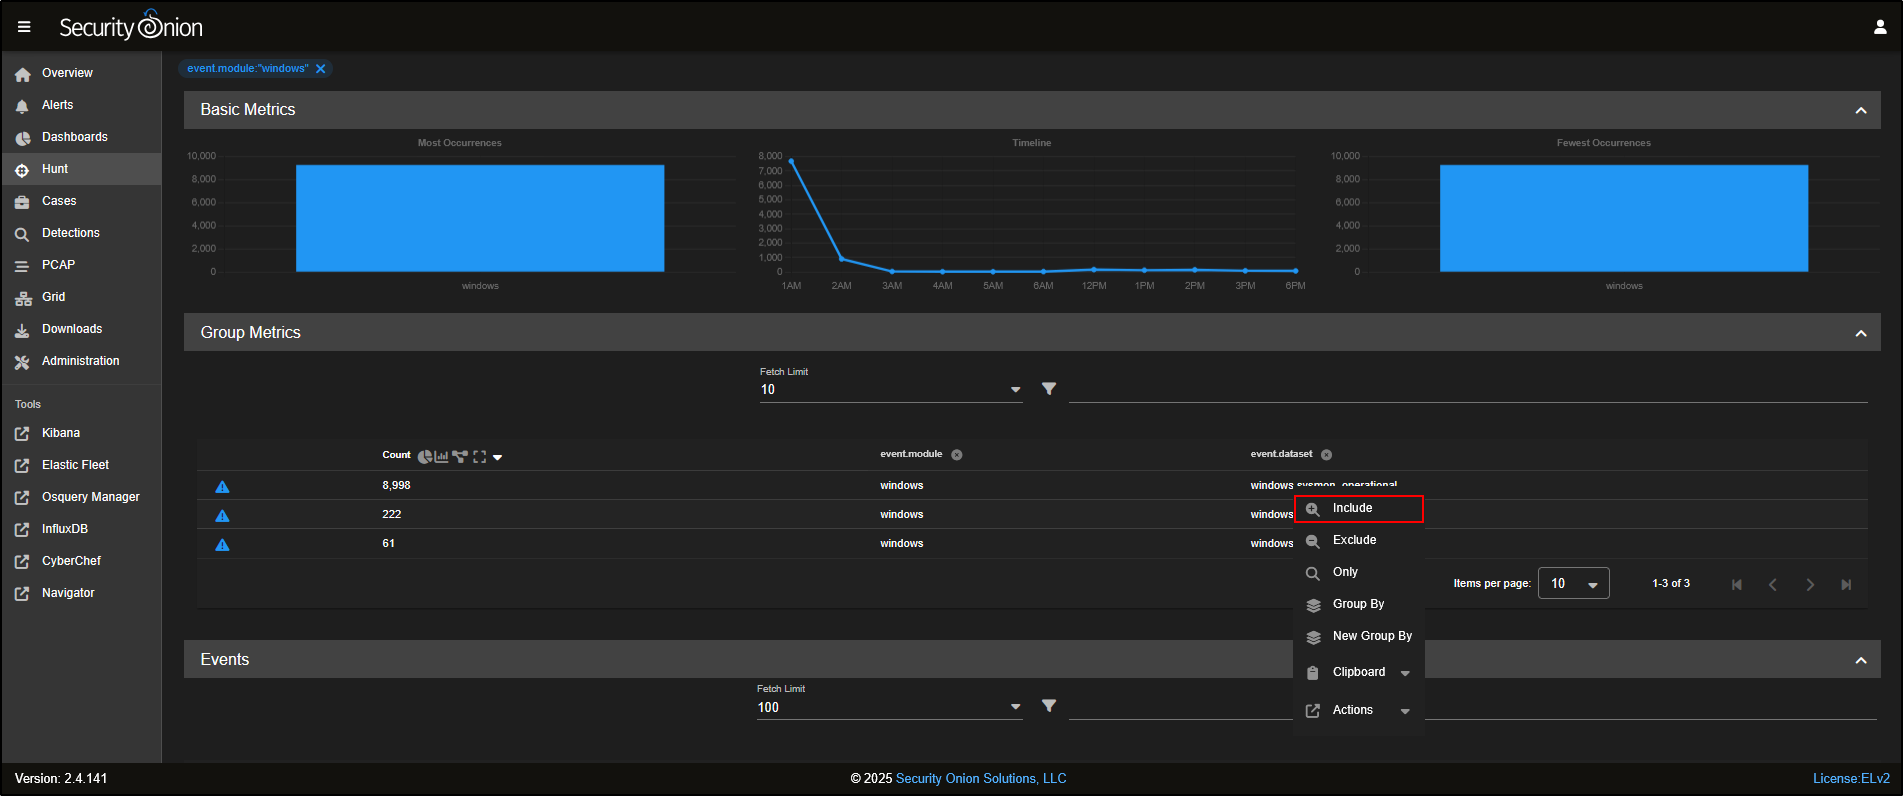
If you want to focus your hunt on Sysmon logs, click on windows and select Include to add it to your search query.
You will now notice that the Group Metrics pane is filtered to show only records from the windows dataset.
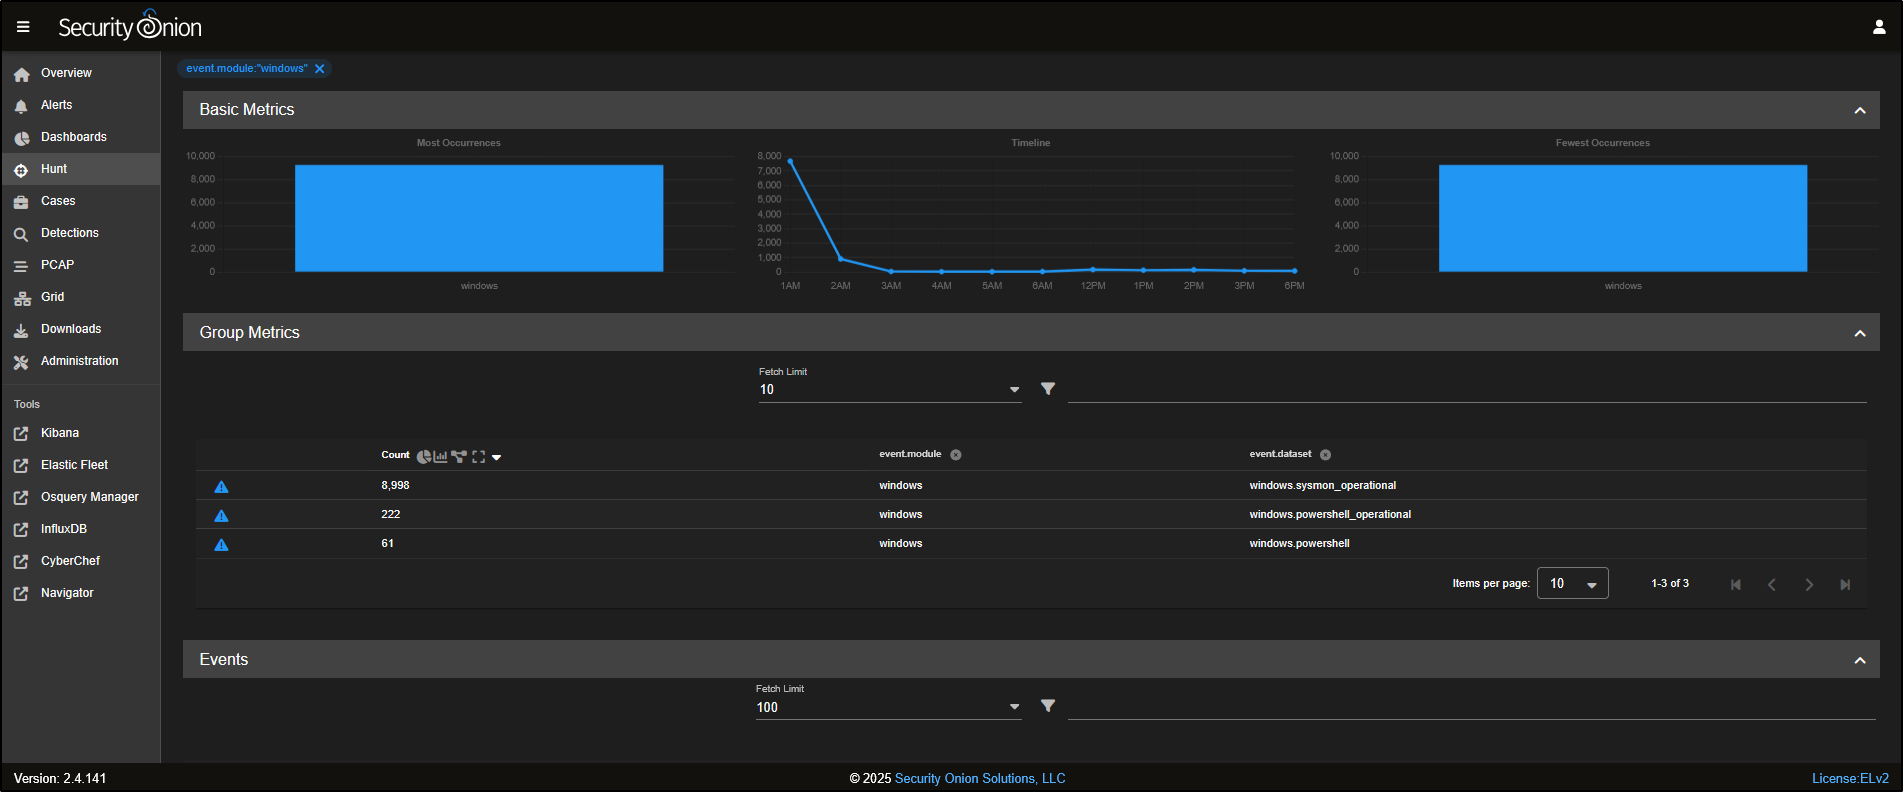
To narrow it down even more, you can select windows.sysmon_operational and click Include to filter specifically for Sysmon operational logs.
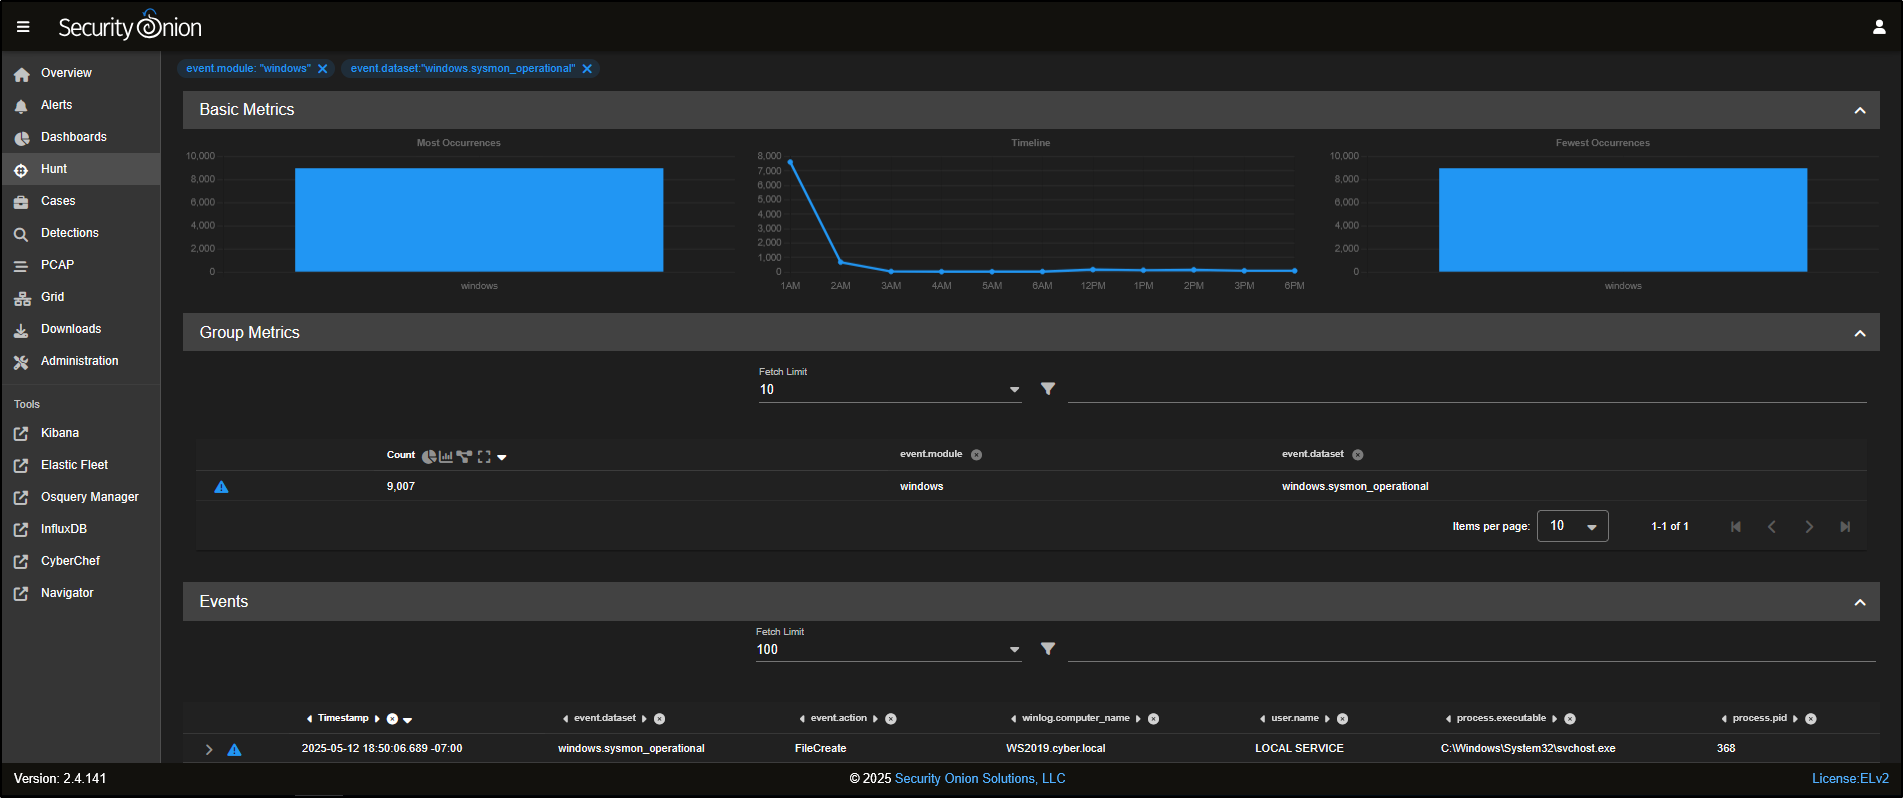
Now, the Group Metrics pane shows only data from the windows.sysmon_operational dataset.
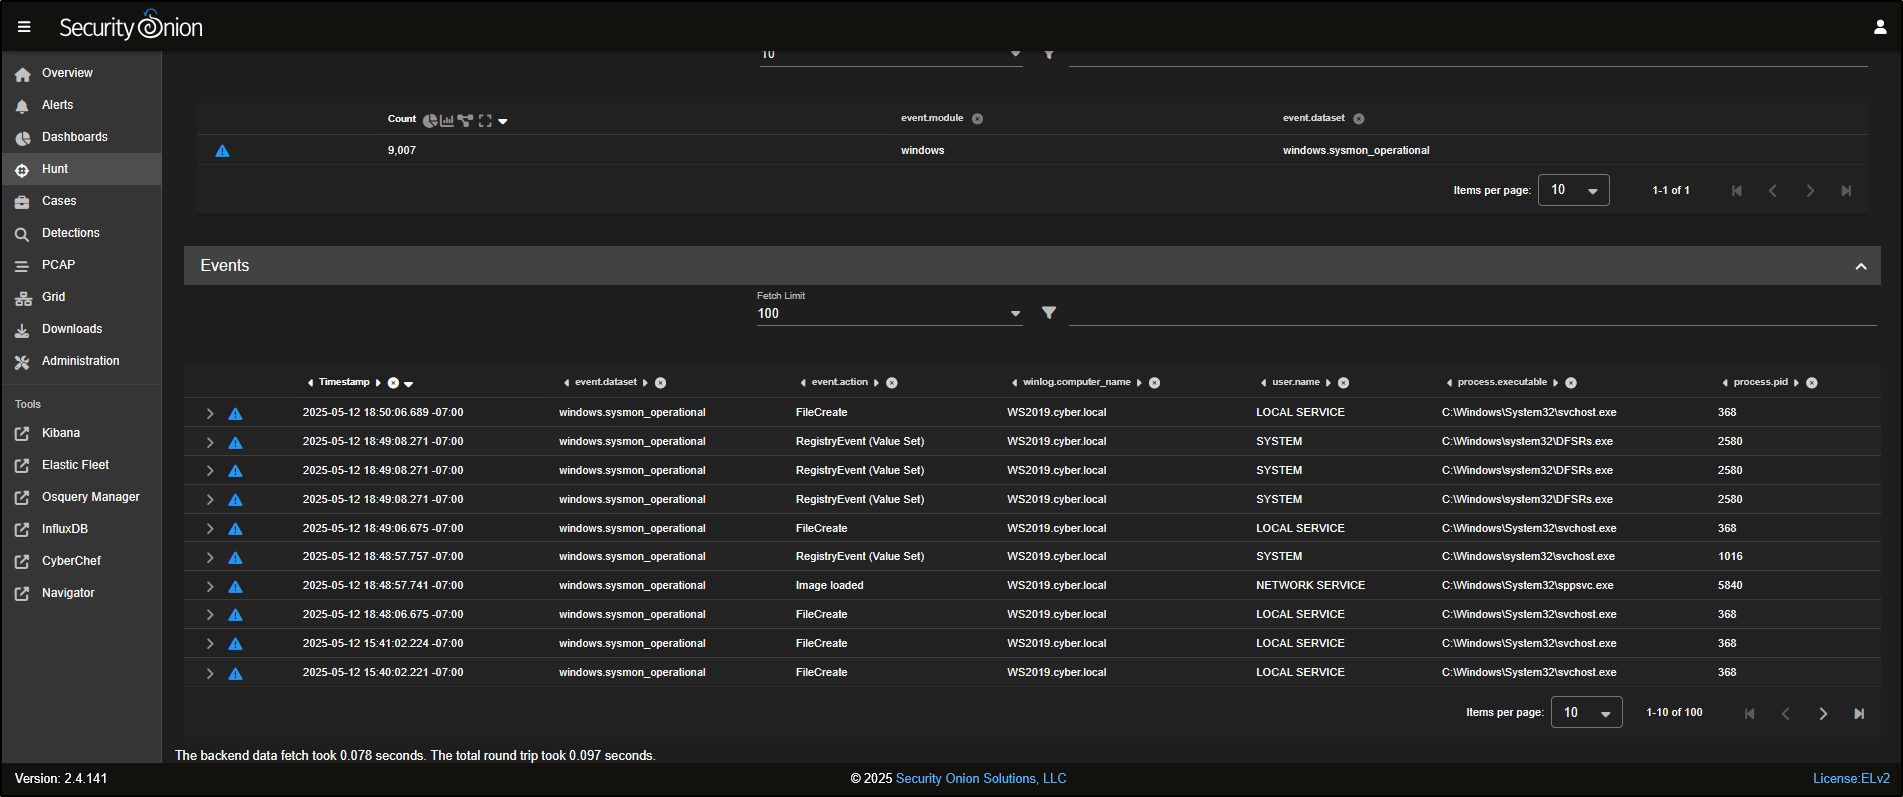
Scrolling down, you will see a list of individual Sysmon events that have been captured.
You can click to expand any event to view detailed information about what was captured in that specific log entry.
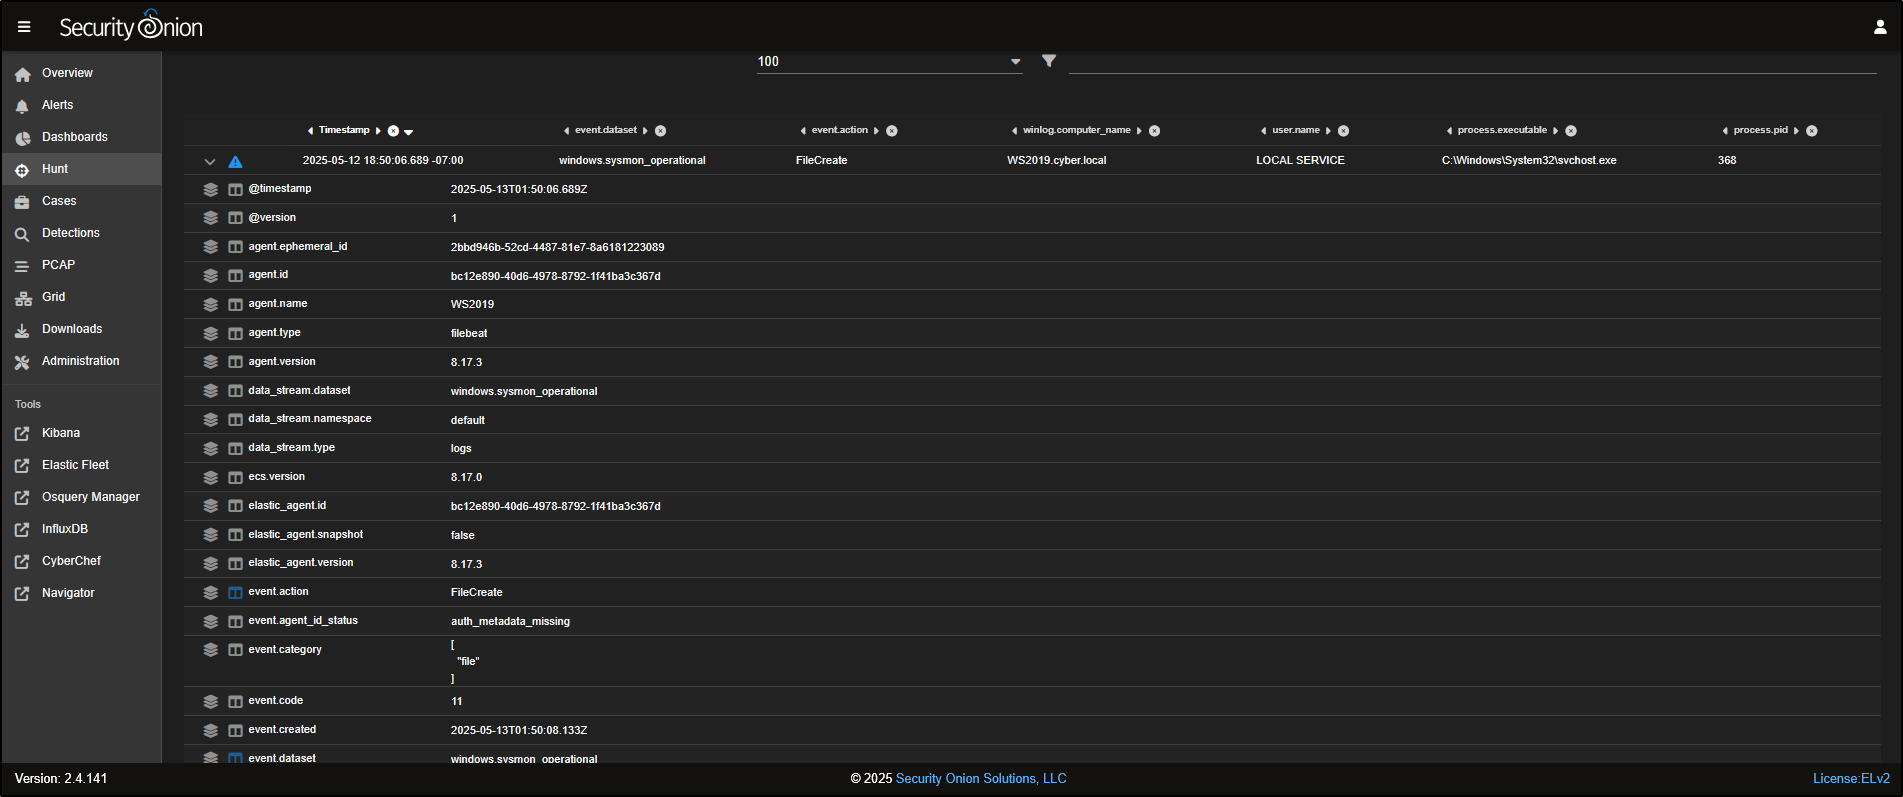
To refine the results even further and focus on FileCreate events, click on FileCreate and select Include to filter for those specific logs.
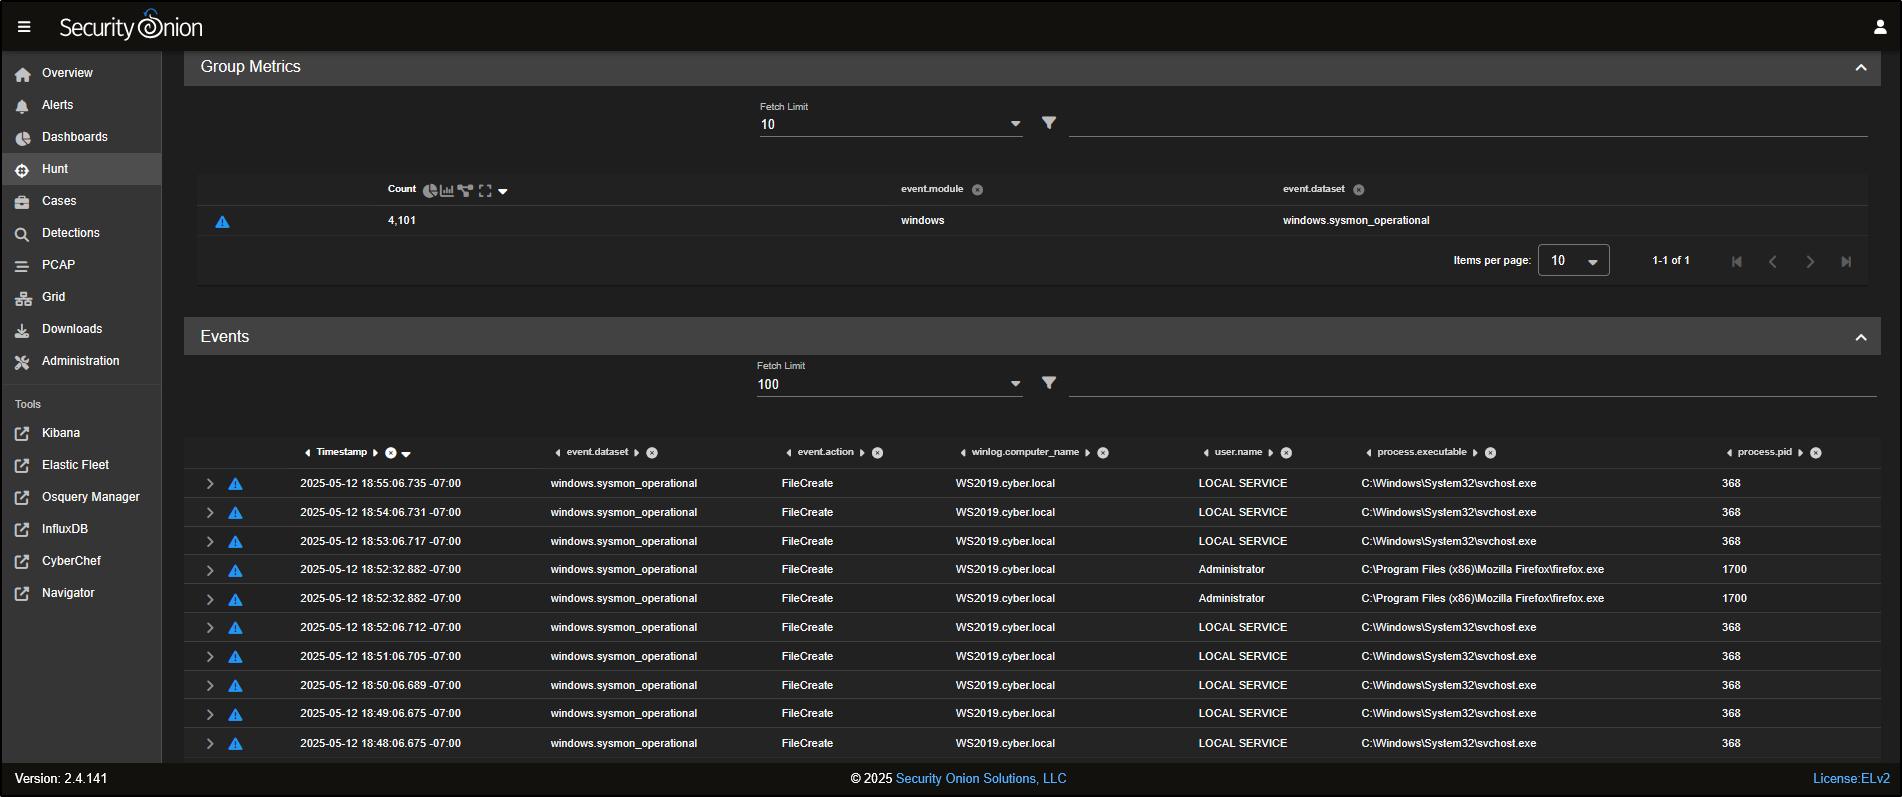
Dashboards
Go to the Dashboards tab in the SOC interface. Dashboards include a range of prebuilt visualisations, organised by different data sets to help you quickly interpret and analyse incoming logs.
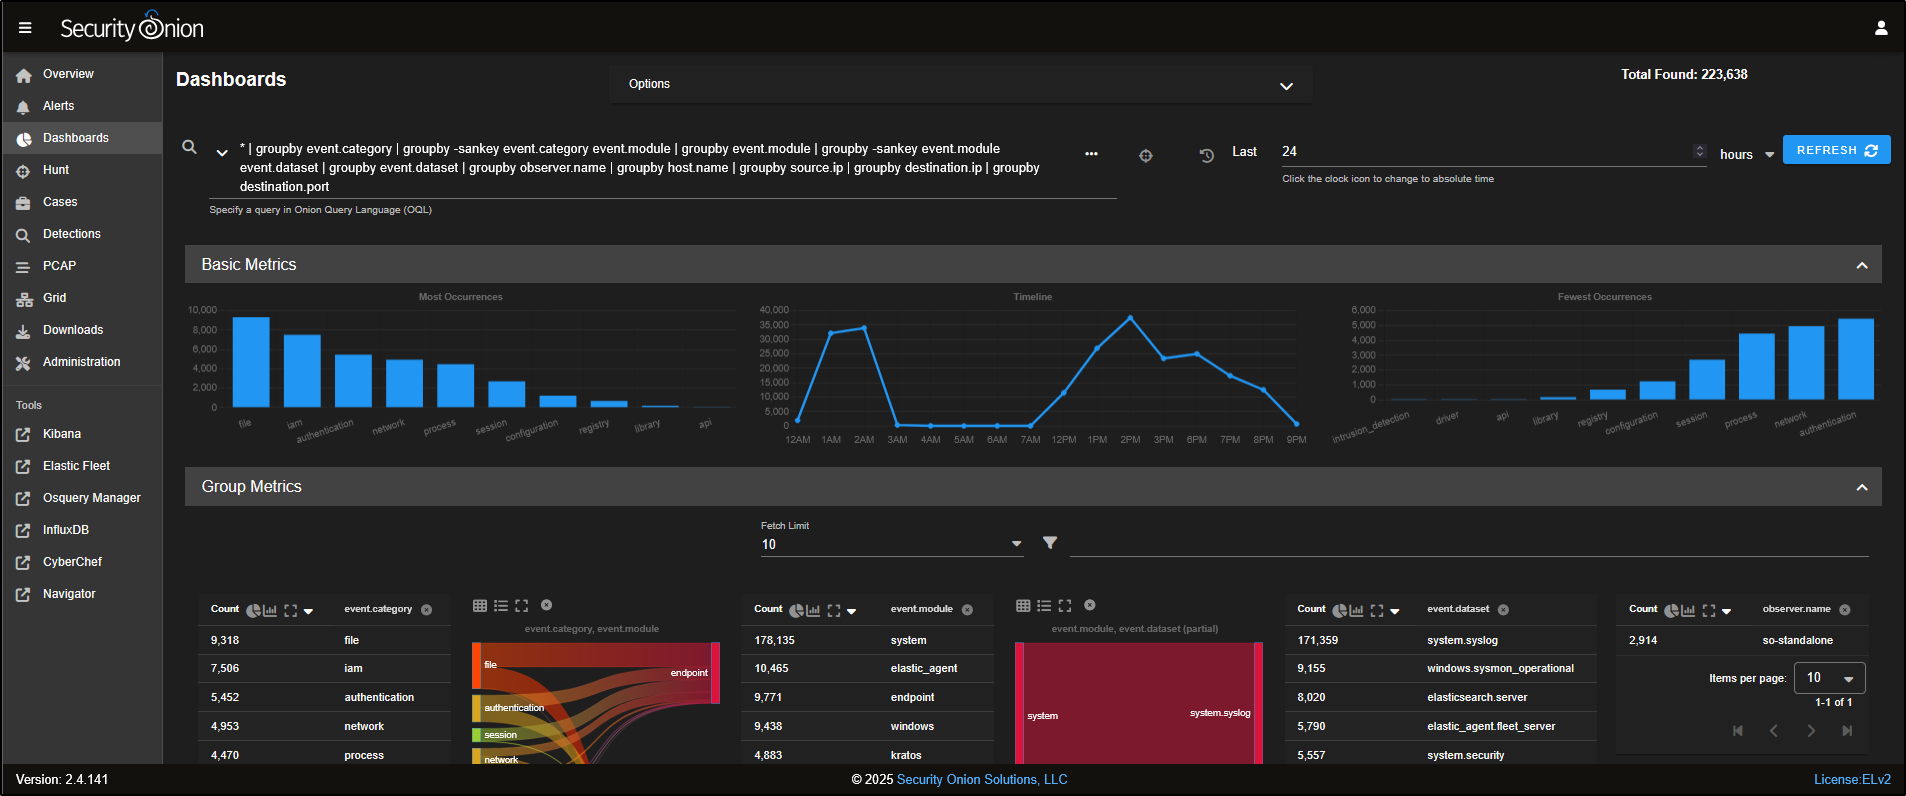
For example, if you want to analyse HTTP traffic, you can select HTTP from the drop-down menu to load the relevant dashboard.
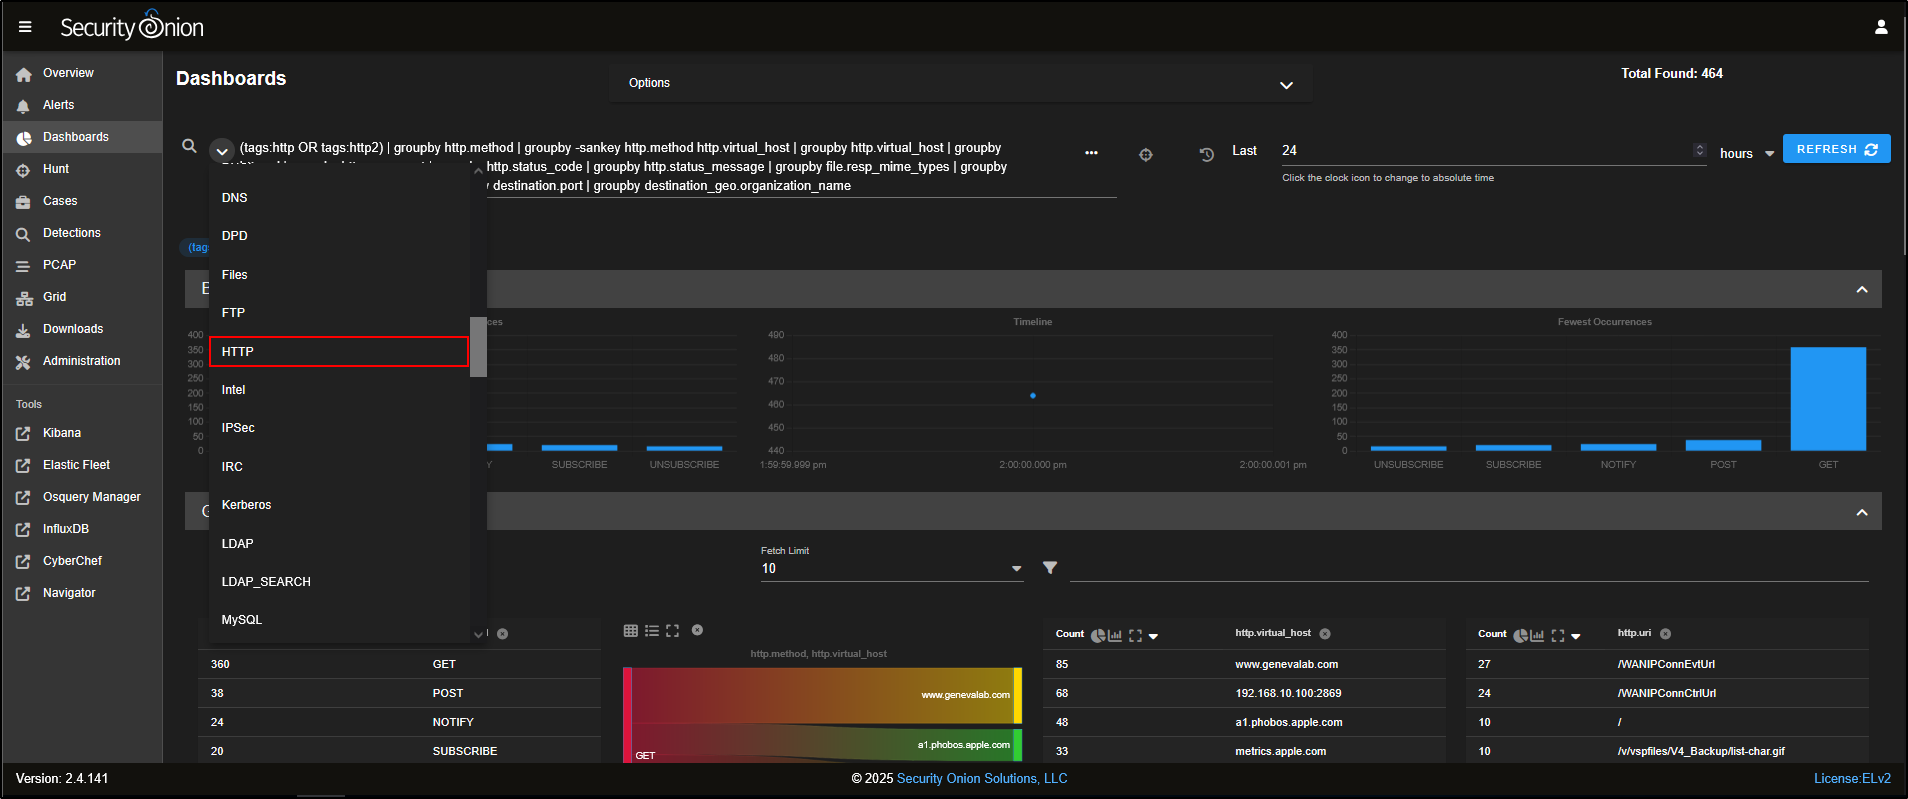
This will load a prebuilt HTTP dashboard that provides visual insights and metrics related to HTTP traffic observed in your environment.
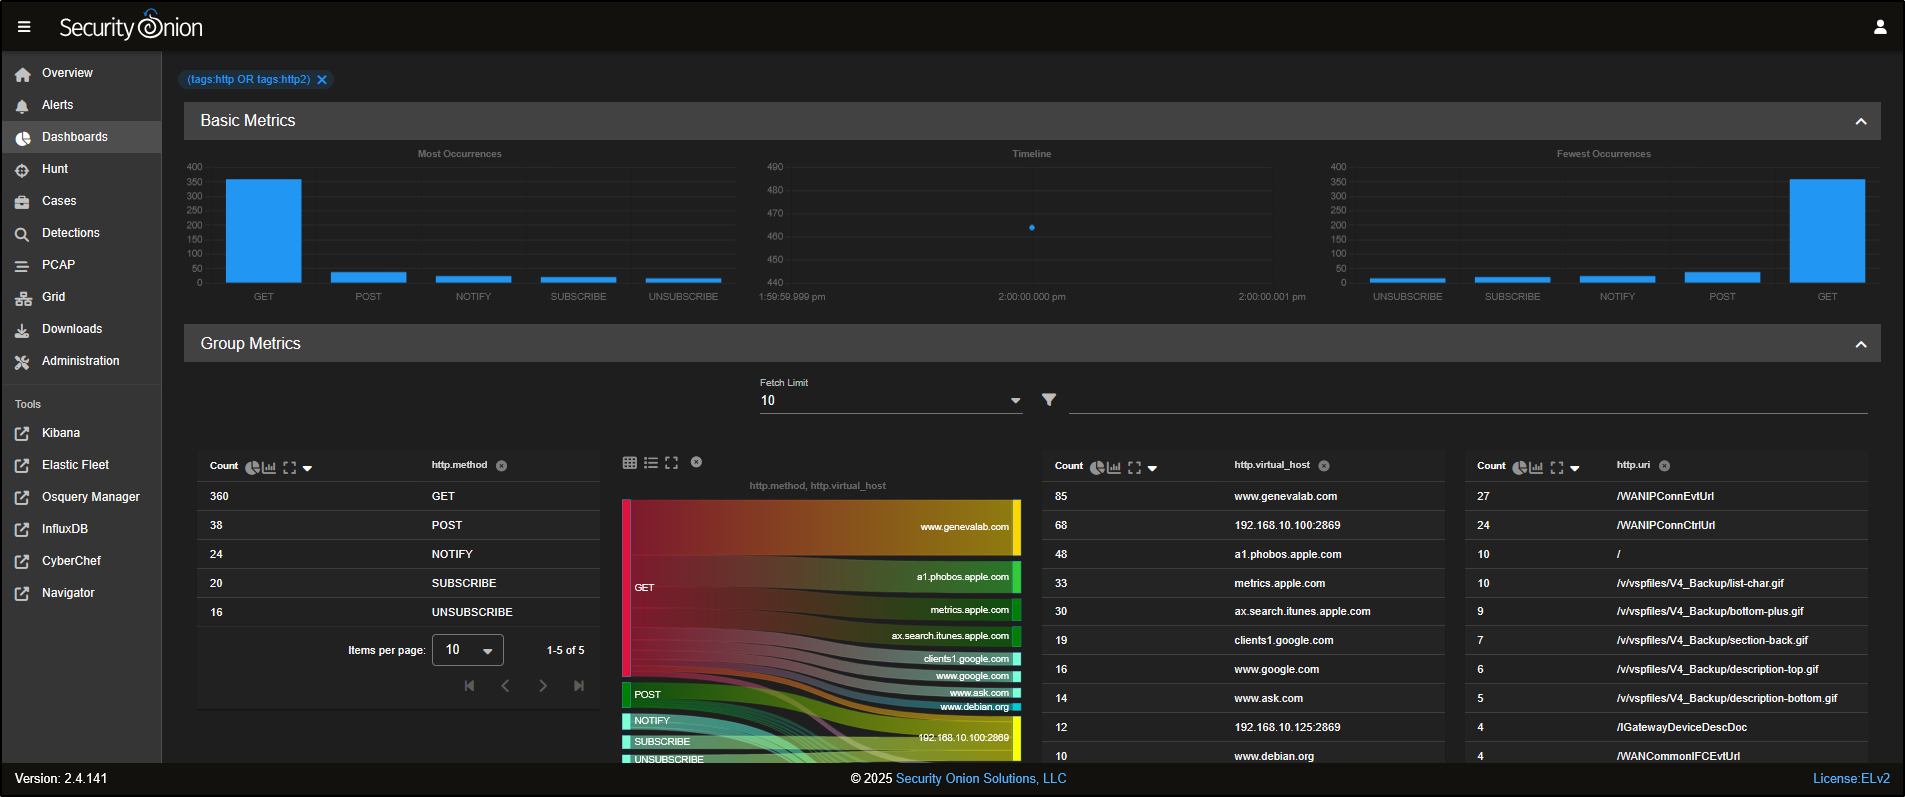
You can refine your view by filtering based on destination port. For instance, if you want to focus on non-standard HTTP traffic, you can Exclude destination port 80 from the results.
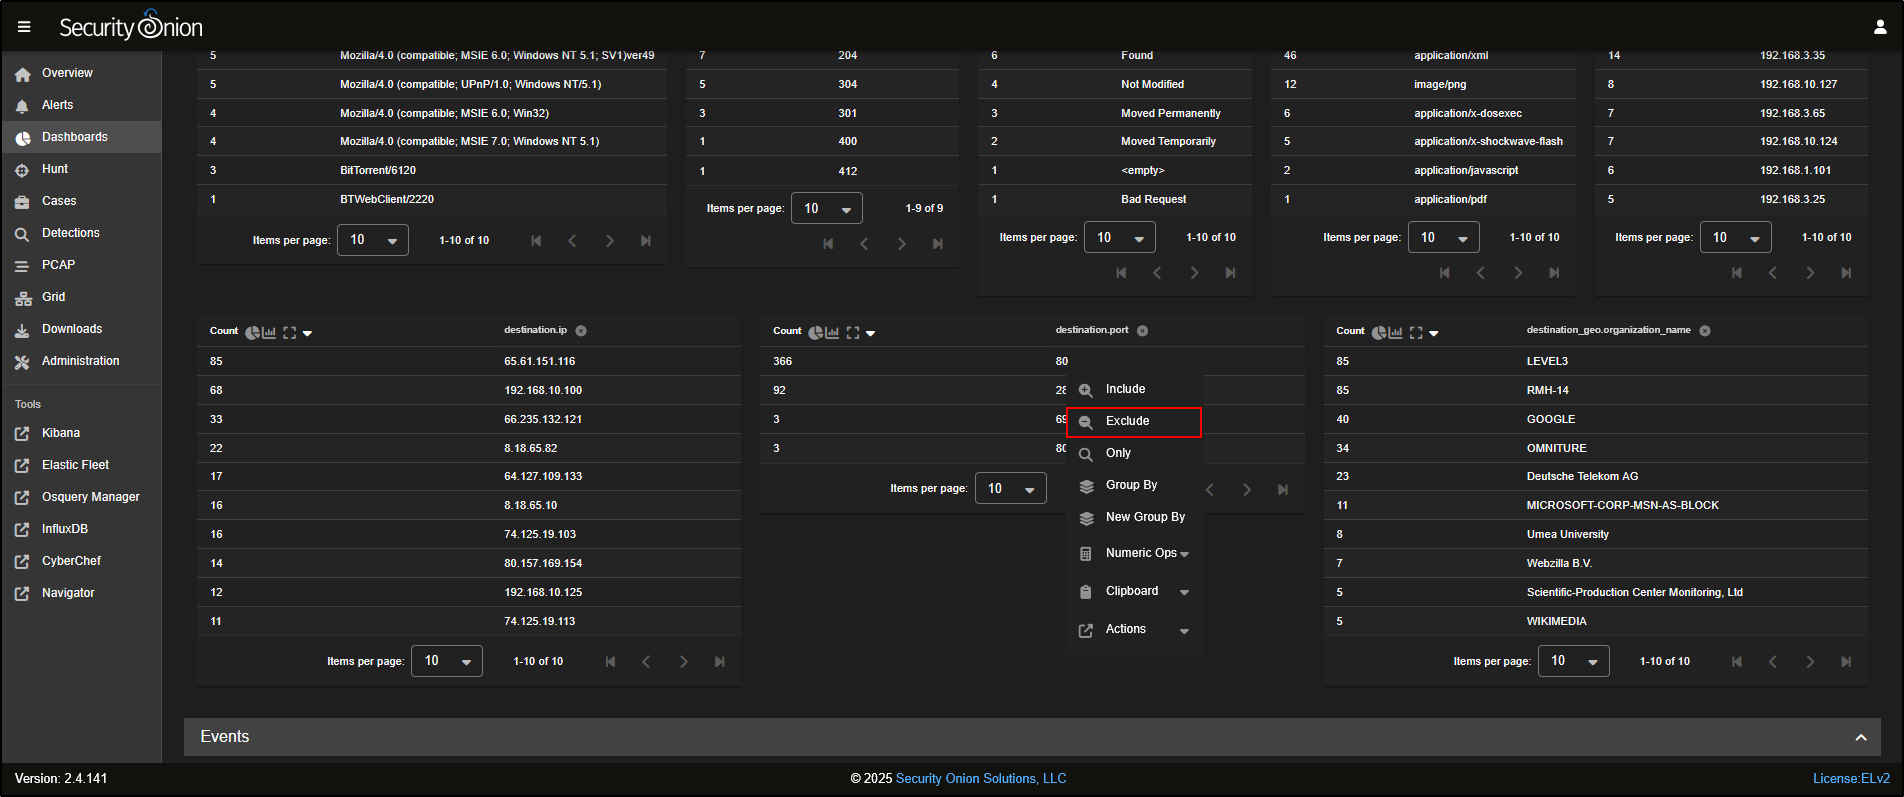
You will now see HTTP traffic that is using non-standard ports, which could indicate unusual or suspicious behaviour.
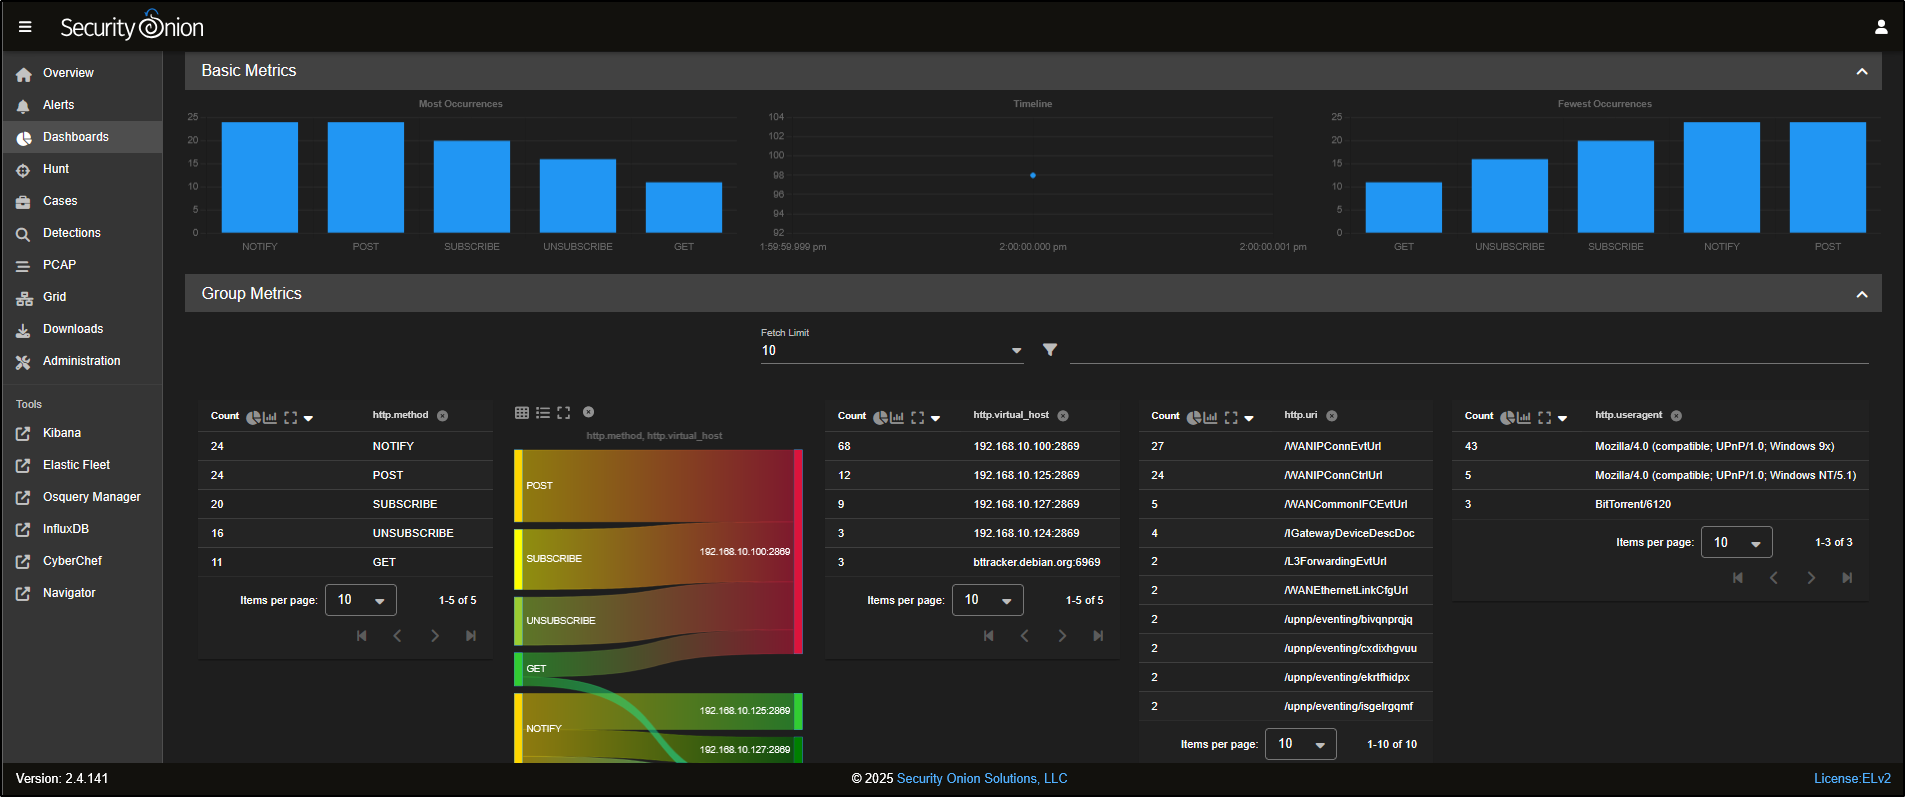
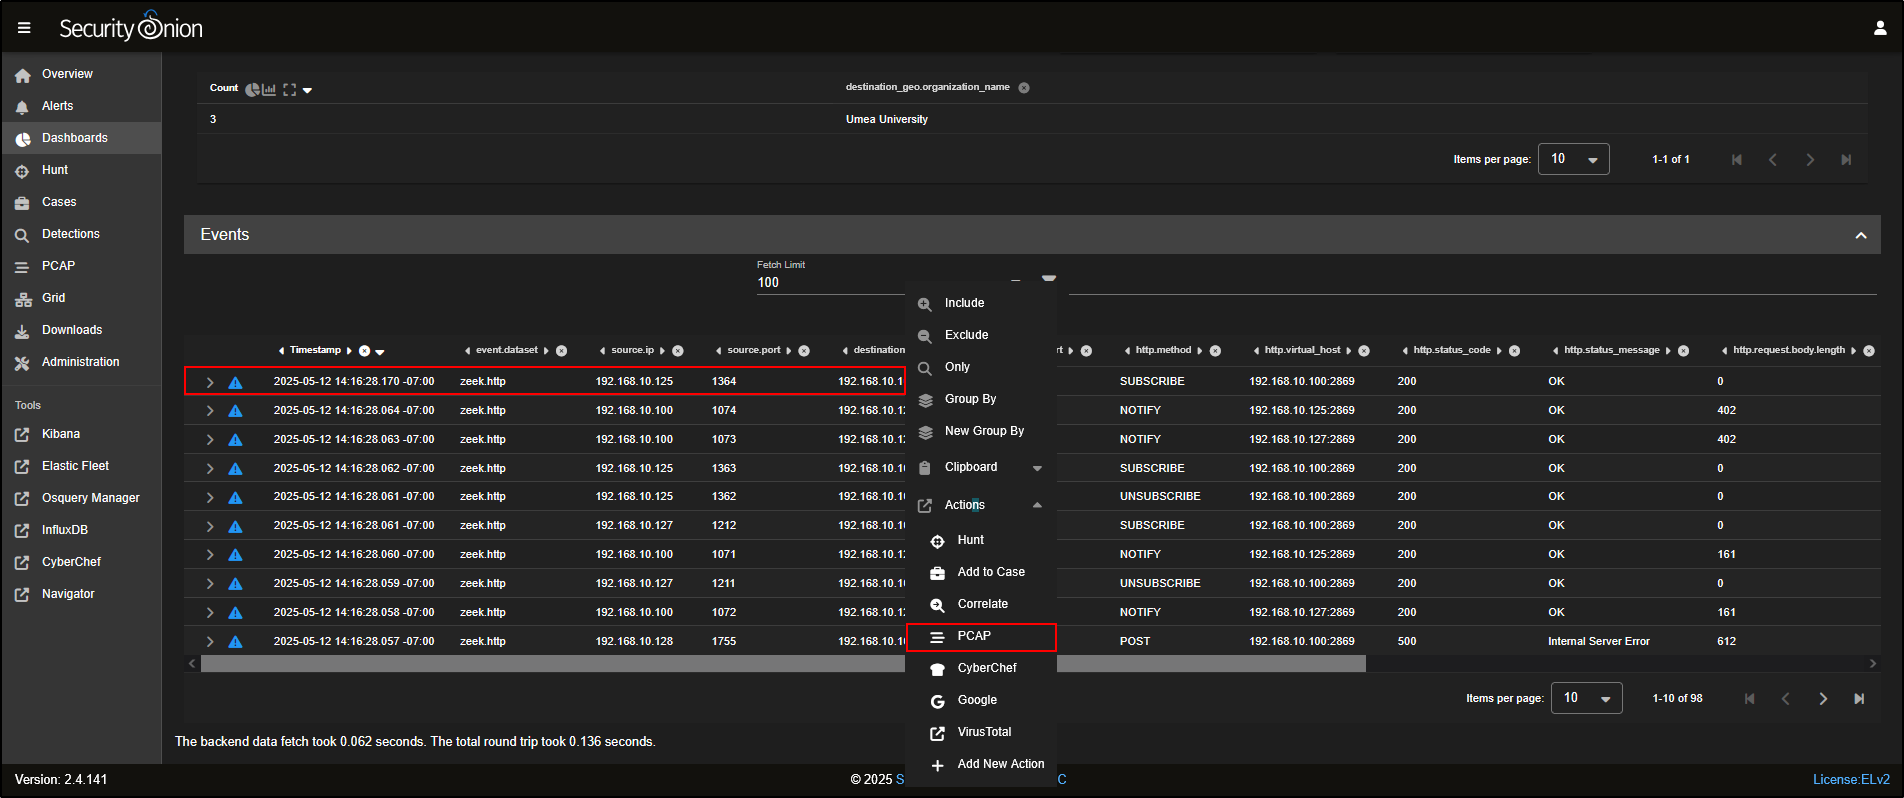
Security Onion also captures full network traffic using packet capture (PCAP). To view a packet capture:
- Scroll down to the event list
- Click on the first record
- Select Actions, then click on PCAP to open the capture for that specific network flow.
This opens a web-based PCAP viewer, similar to Wireshark, but accessible through your browser. Here, you can inspect details like the source and destination IPs, port numbers, and TCP flags involved in the connection.
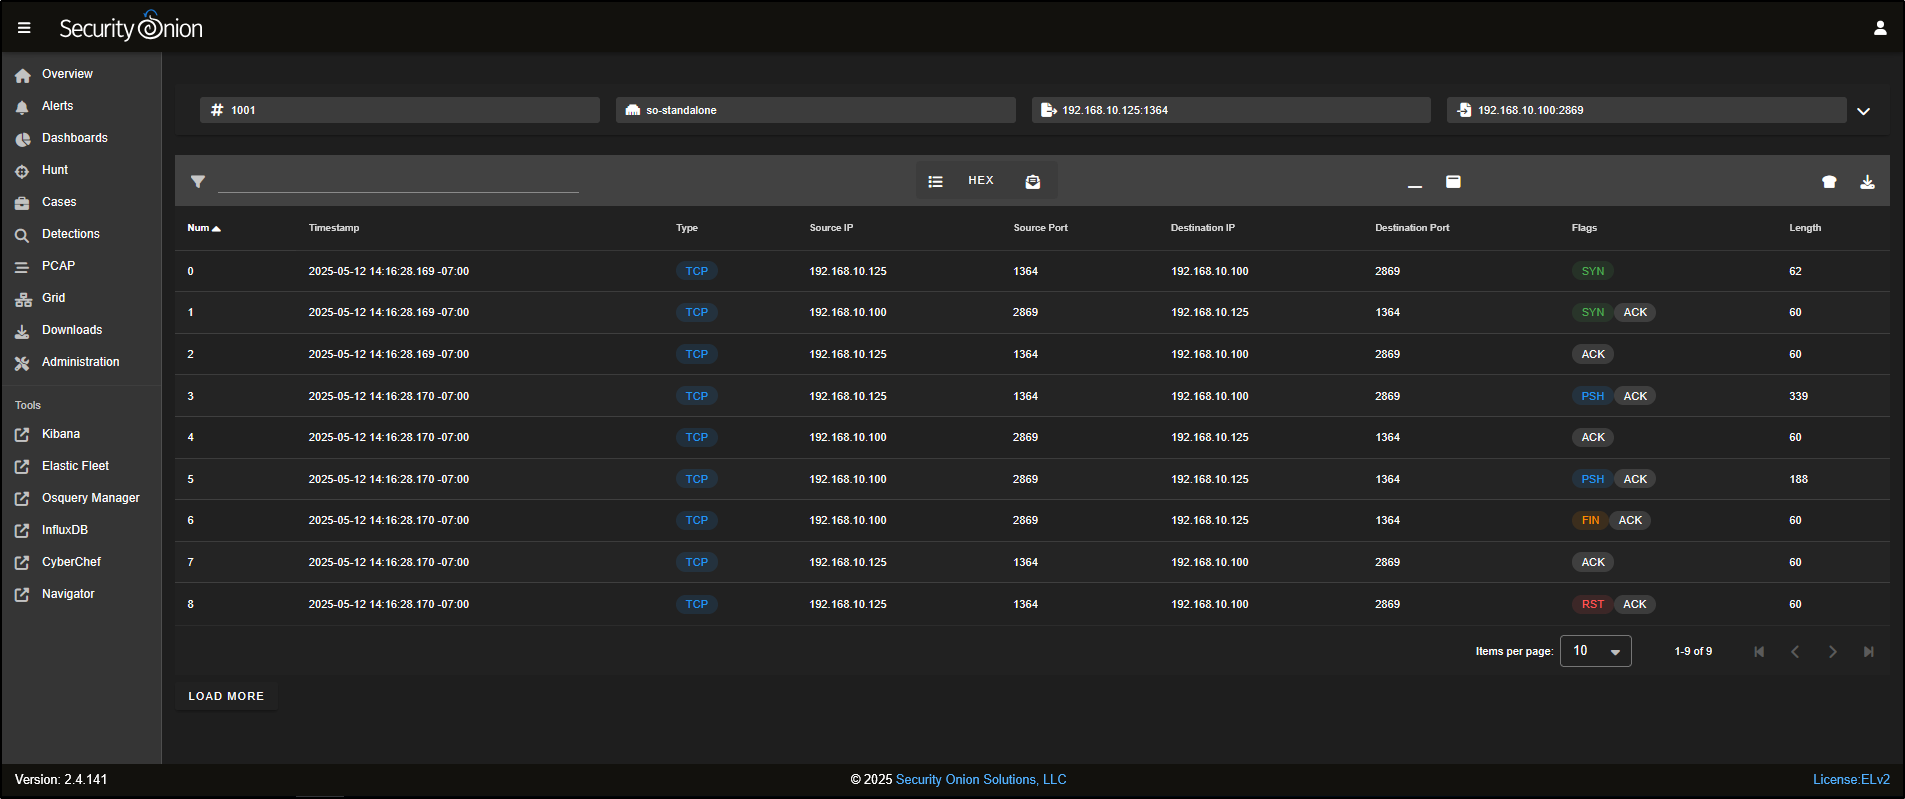
To view the raw packet data, click on the list icon at the top of the PCAP interface.
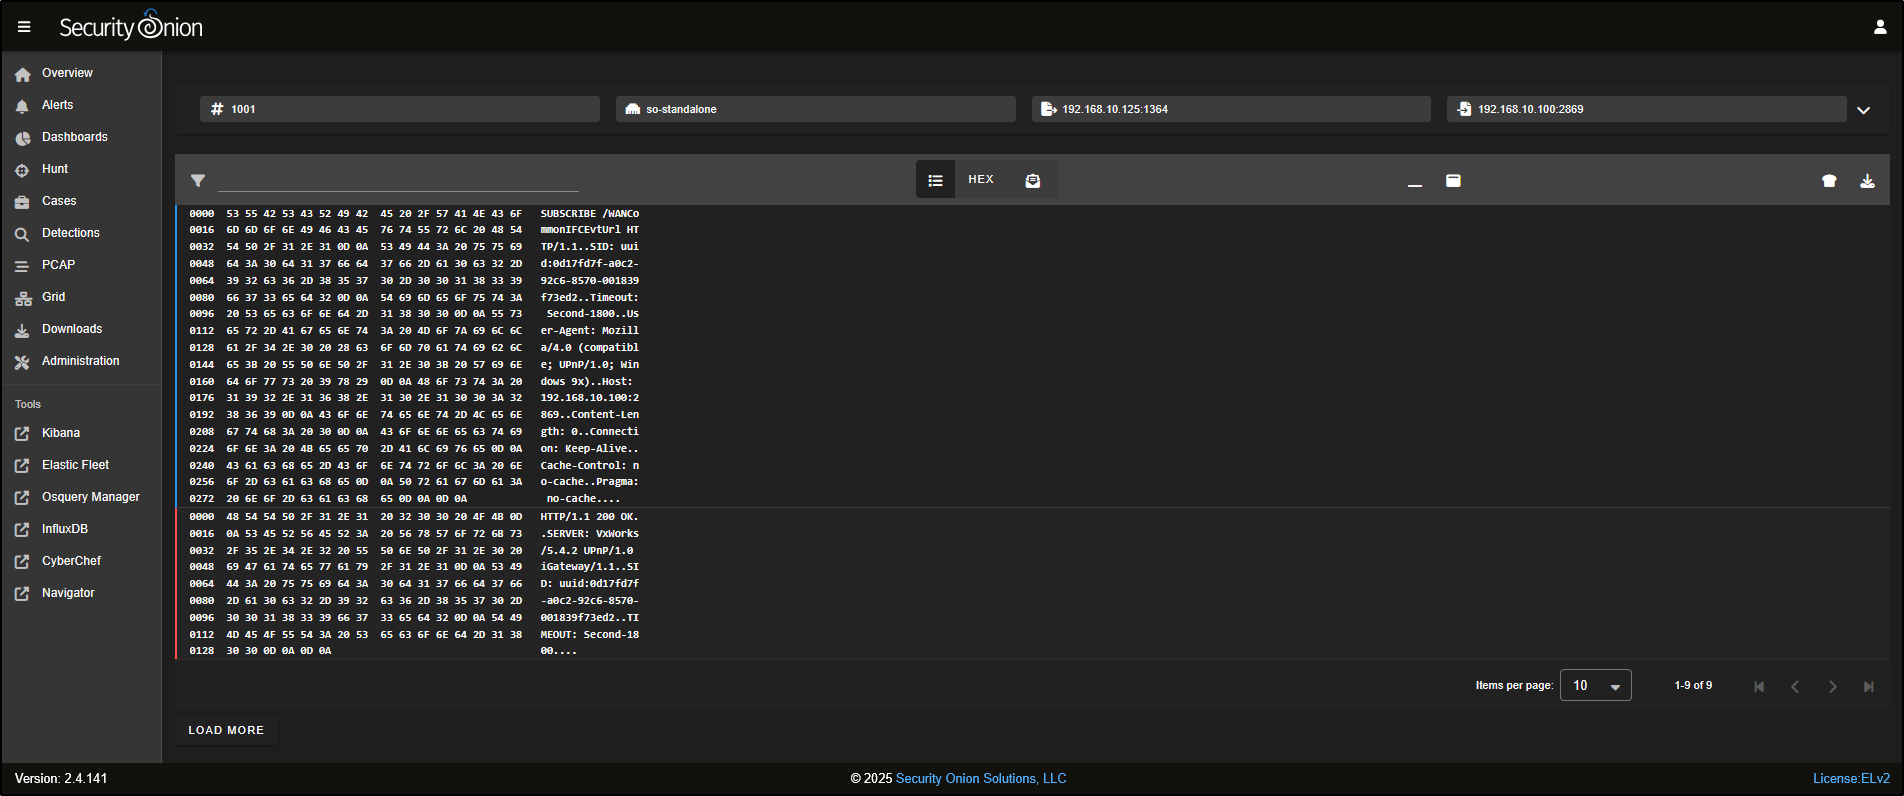
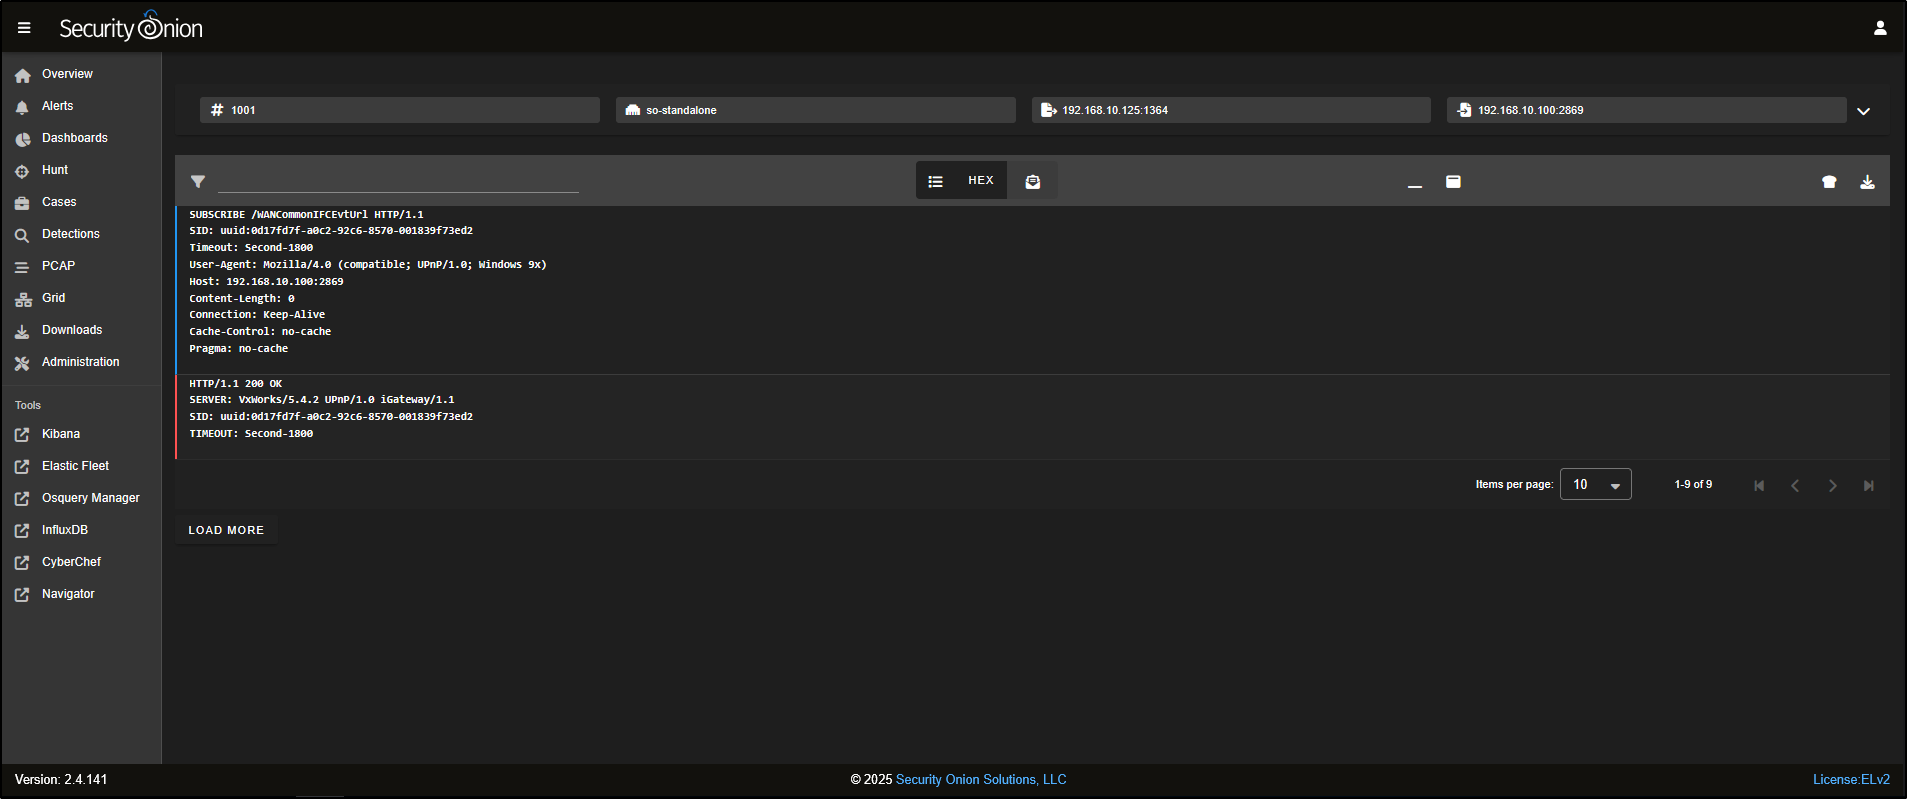
To hide the hex dump and switch to a plain-text view of the TCP session, click on the HEX icon at the top of the interface.
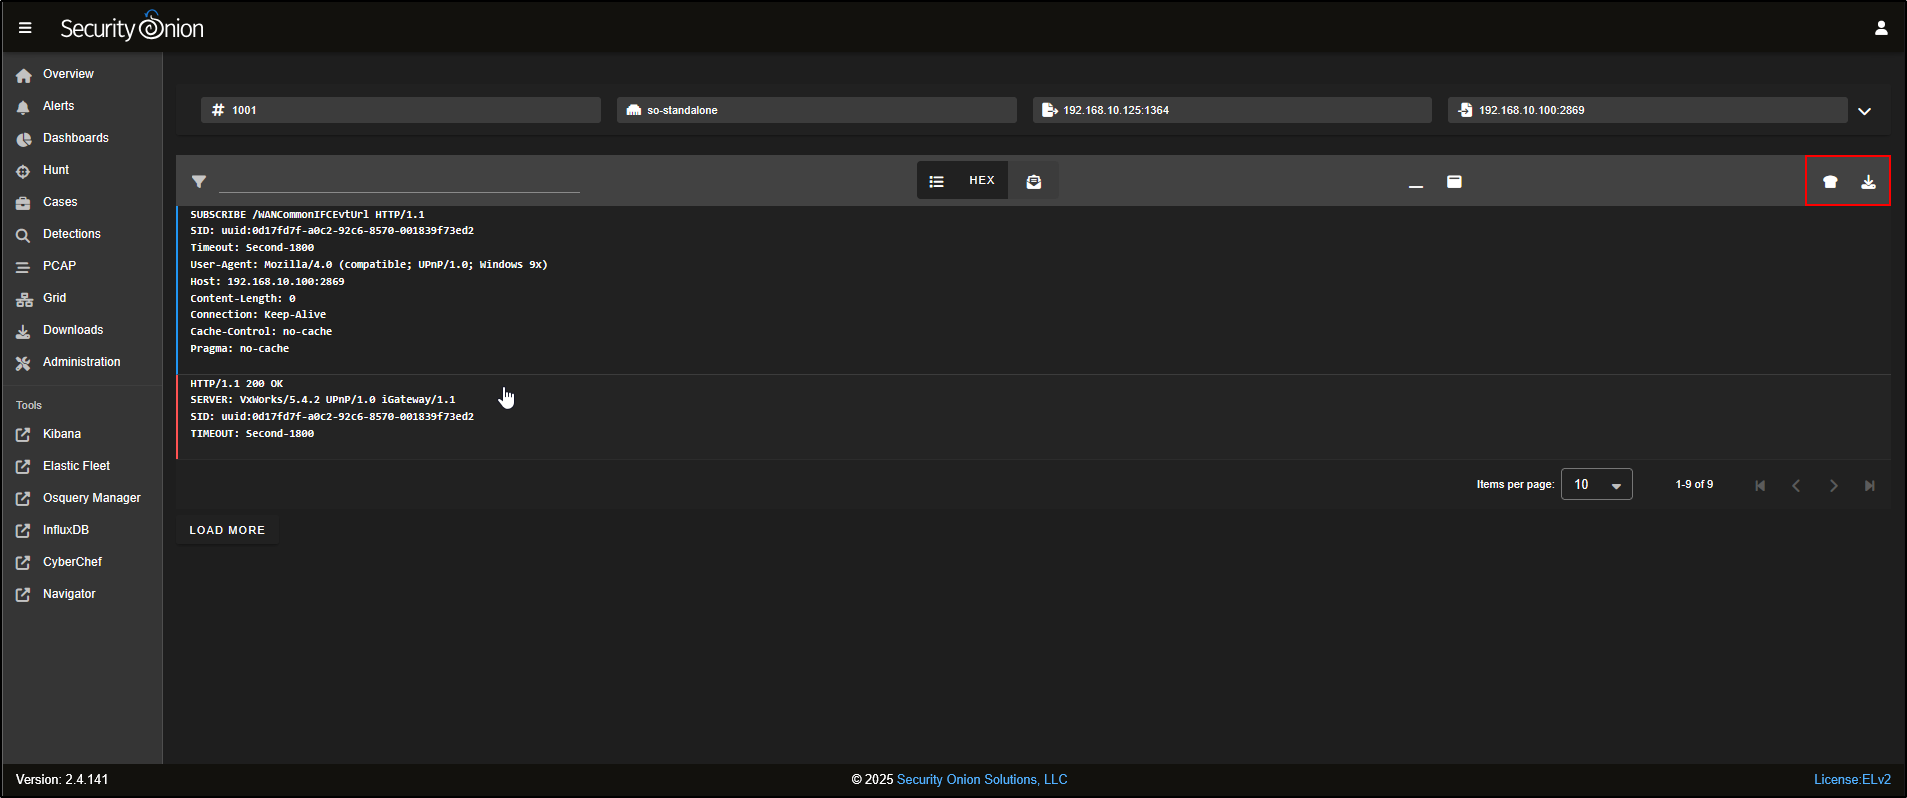
If you need to dig deeper, you can either download the PCAP using the Download PCAP button at the top right, or send it directly to CyberChef by clicking the CyberChef icon.
PCAP
As well as pivoting into a PCAP from a specific alert or event, you can also pull custom PCAPs from your sensors based on your own search criteria.
To do this:
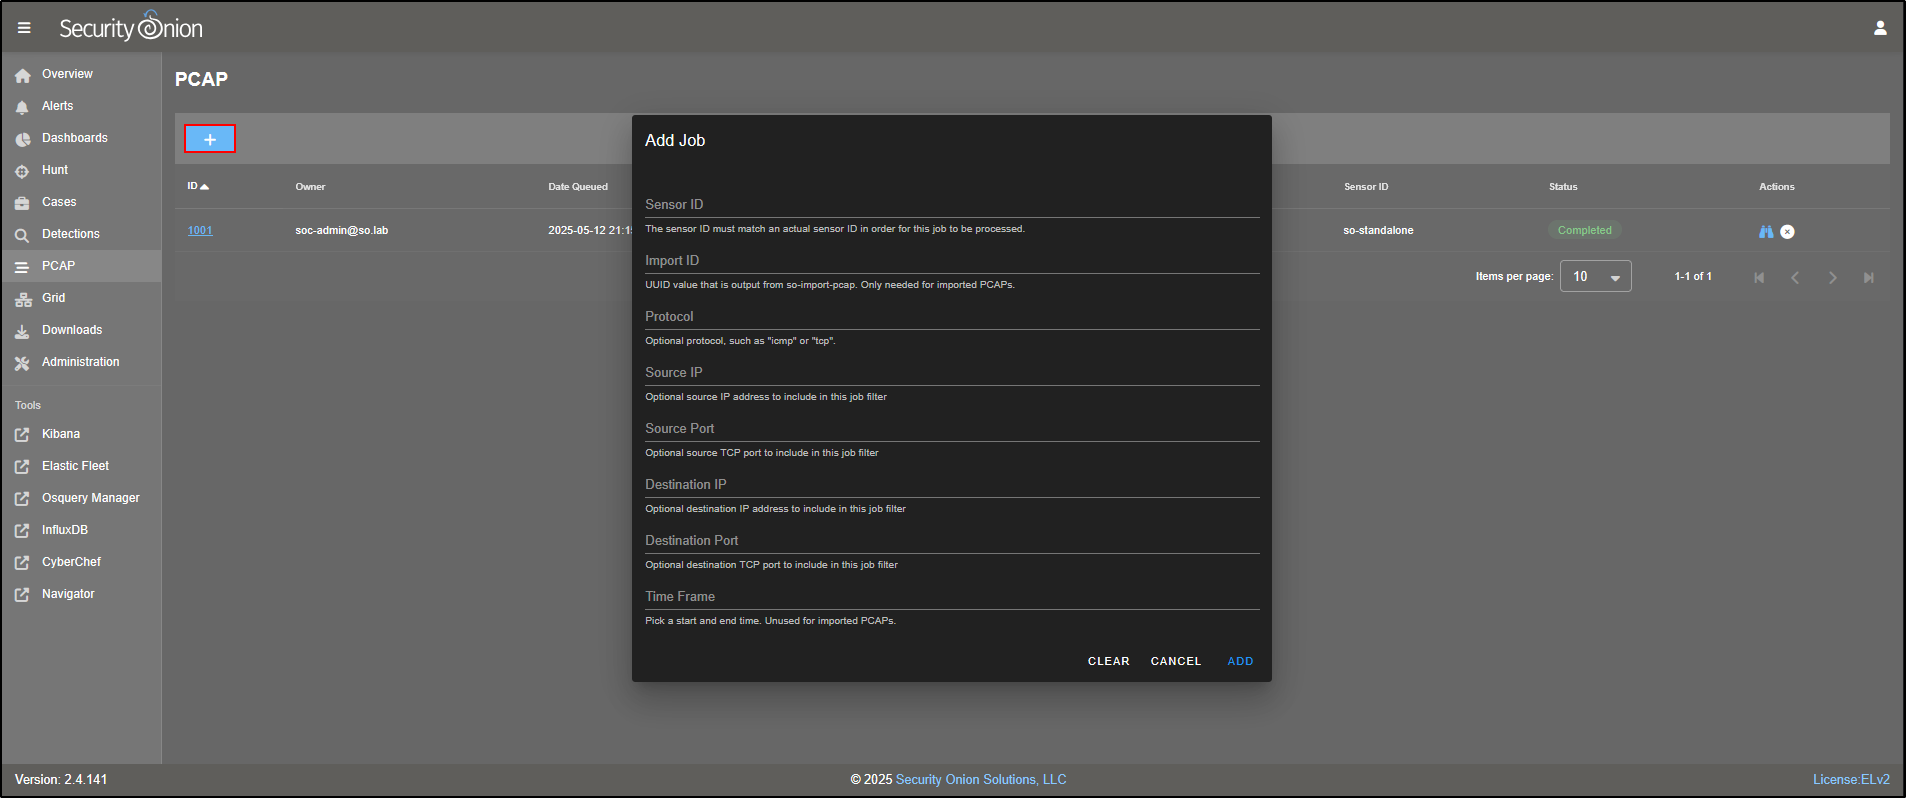
- Go to the PCAP tab in the SOC interface.
- Click the + icon to create a new request.
- Enter the parameters you want to filter by (e.g. IP address, port, time range).
- Specify the sensor ID you want to collect from.
Security Onion will then retrieve the matching packets and display them in the PCAP web interface for review.
Downloads
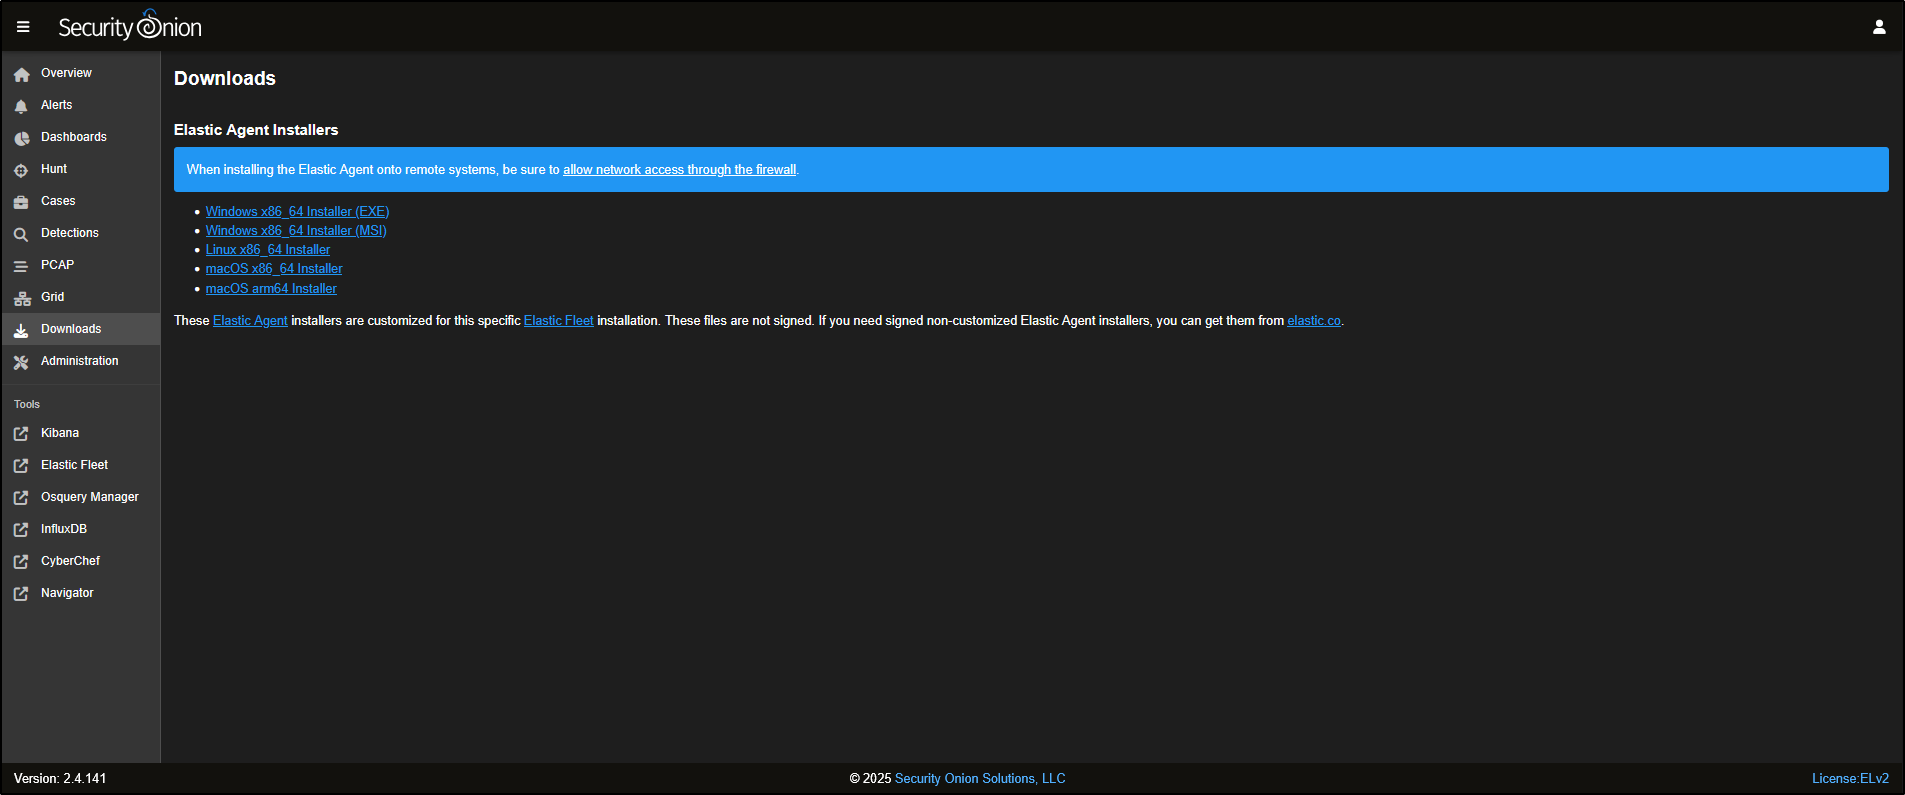
Go to the Downloads tab in the SOC interface. Here, you can download the Elastic Agent that matches the operating system of your endpoint.
These agents are designed to collect telemetry data from the host and send it to Security Onion. They are prebuilt and automatically configured for your environment as part of the installation process.
Administration
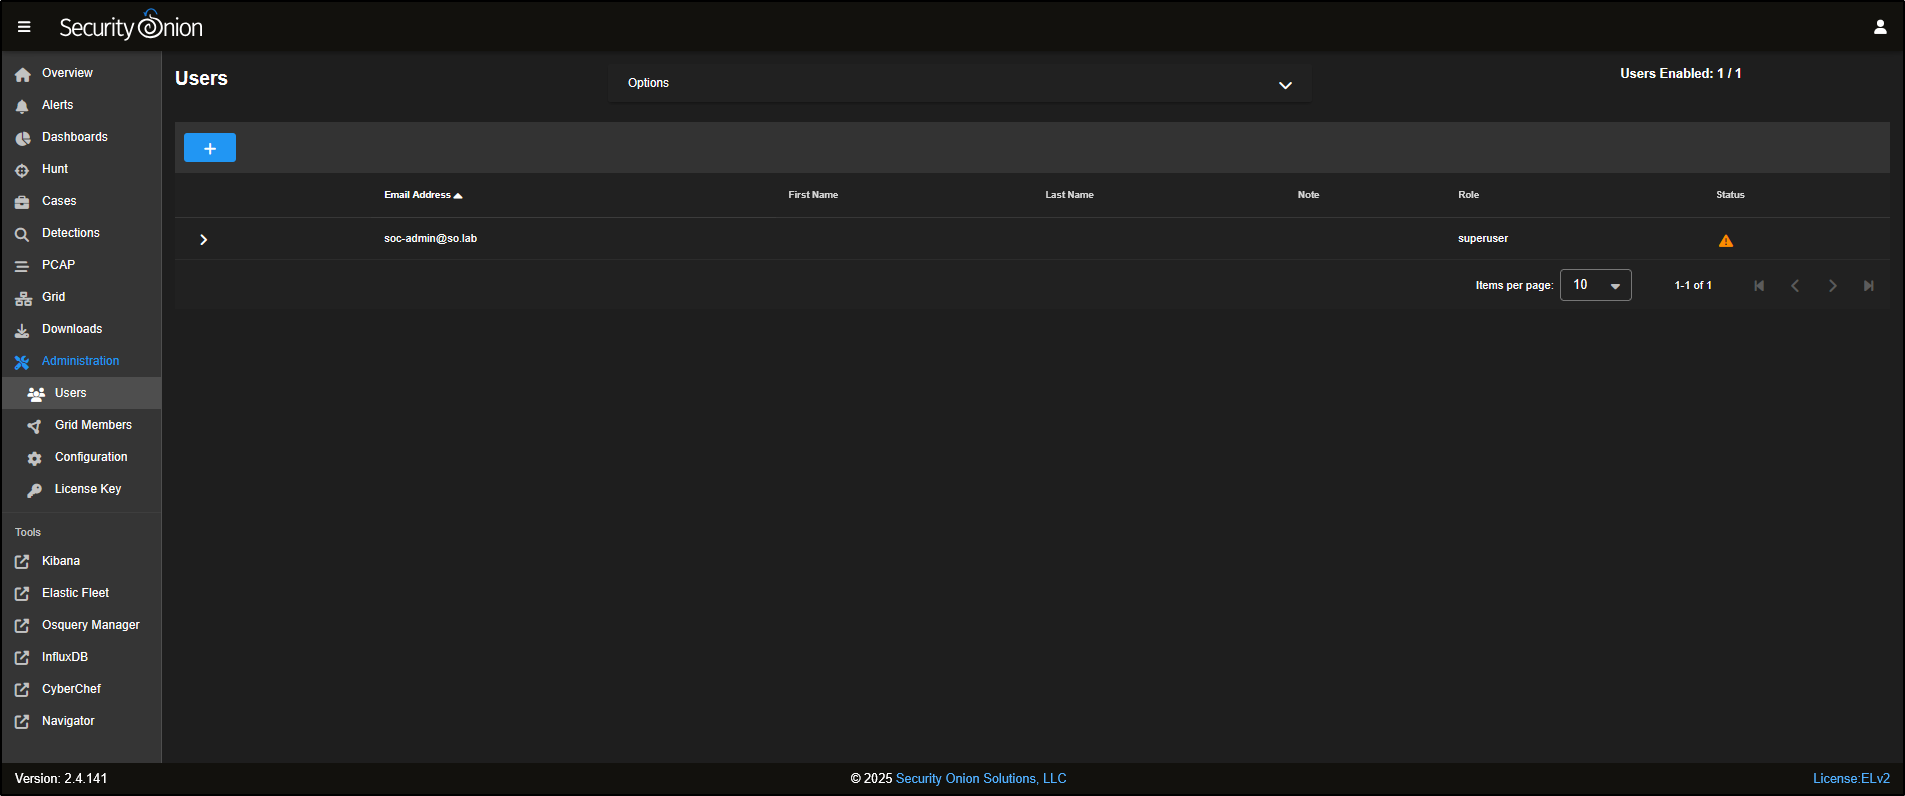
Head to the Administration tab in the SOC interface. This section lets you manage and configure your Security Onion Grid.
Under Users, you can create, disable, or edit user accounts for accessing the SOC web interface.
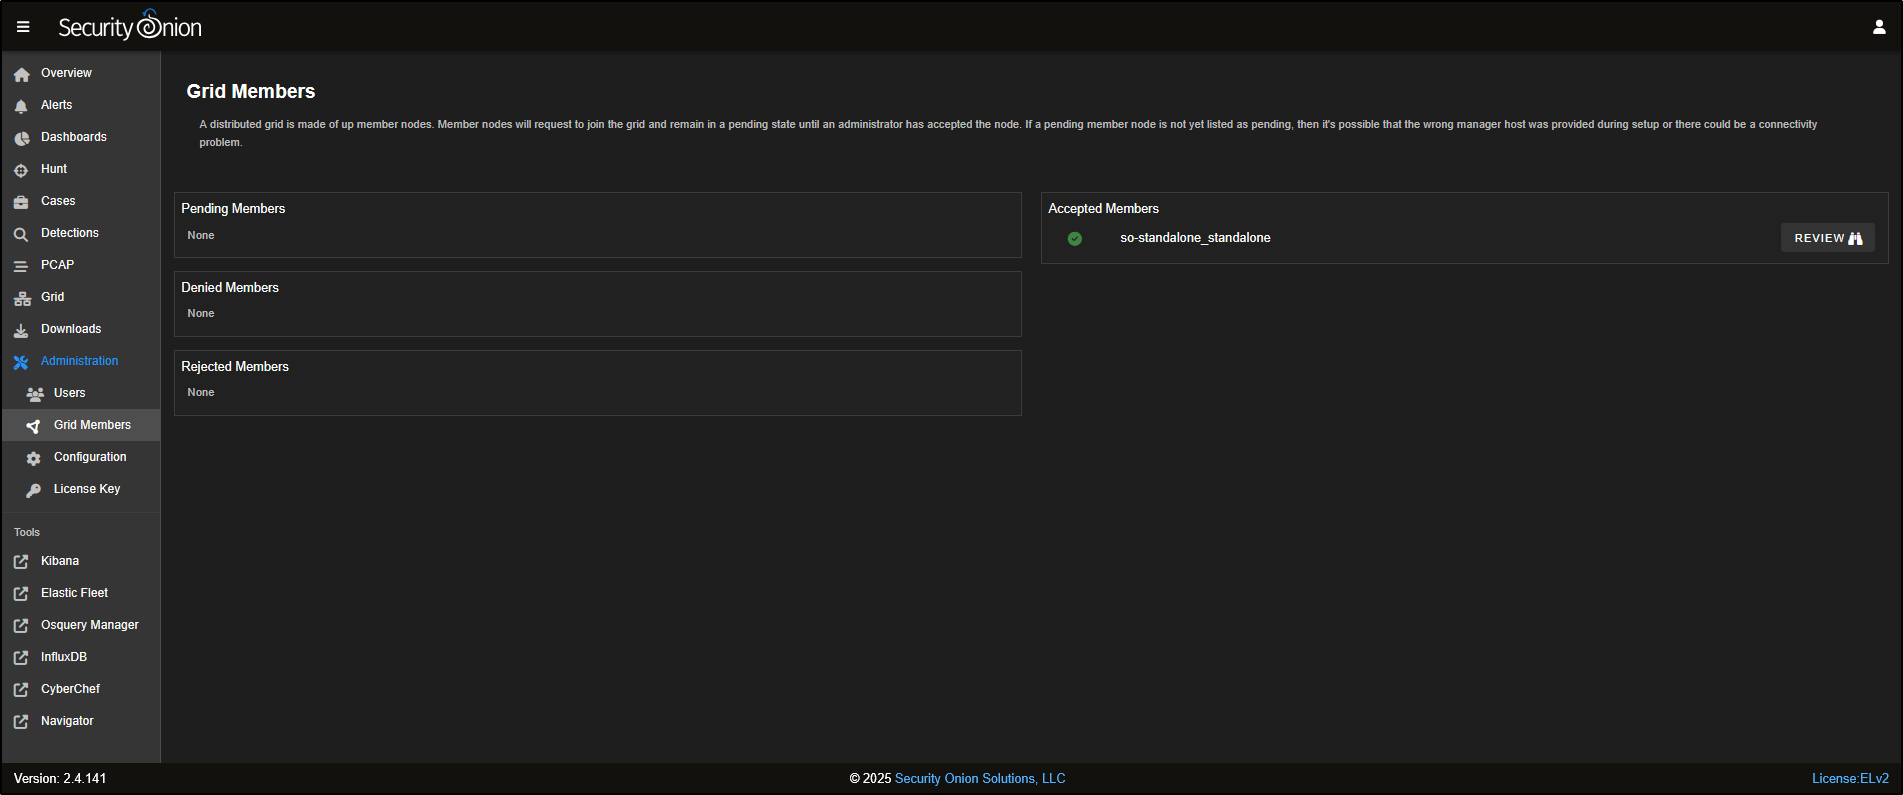
The Grid Members section is used to add or remove nodes from your Security Onion deployment, allowing you to scale or manage your environment as needed
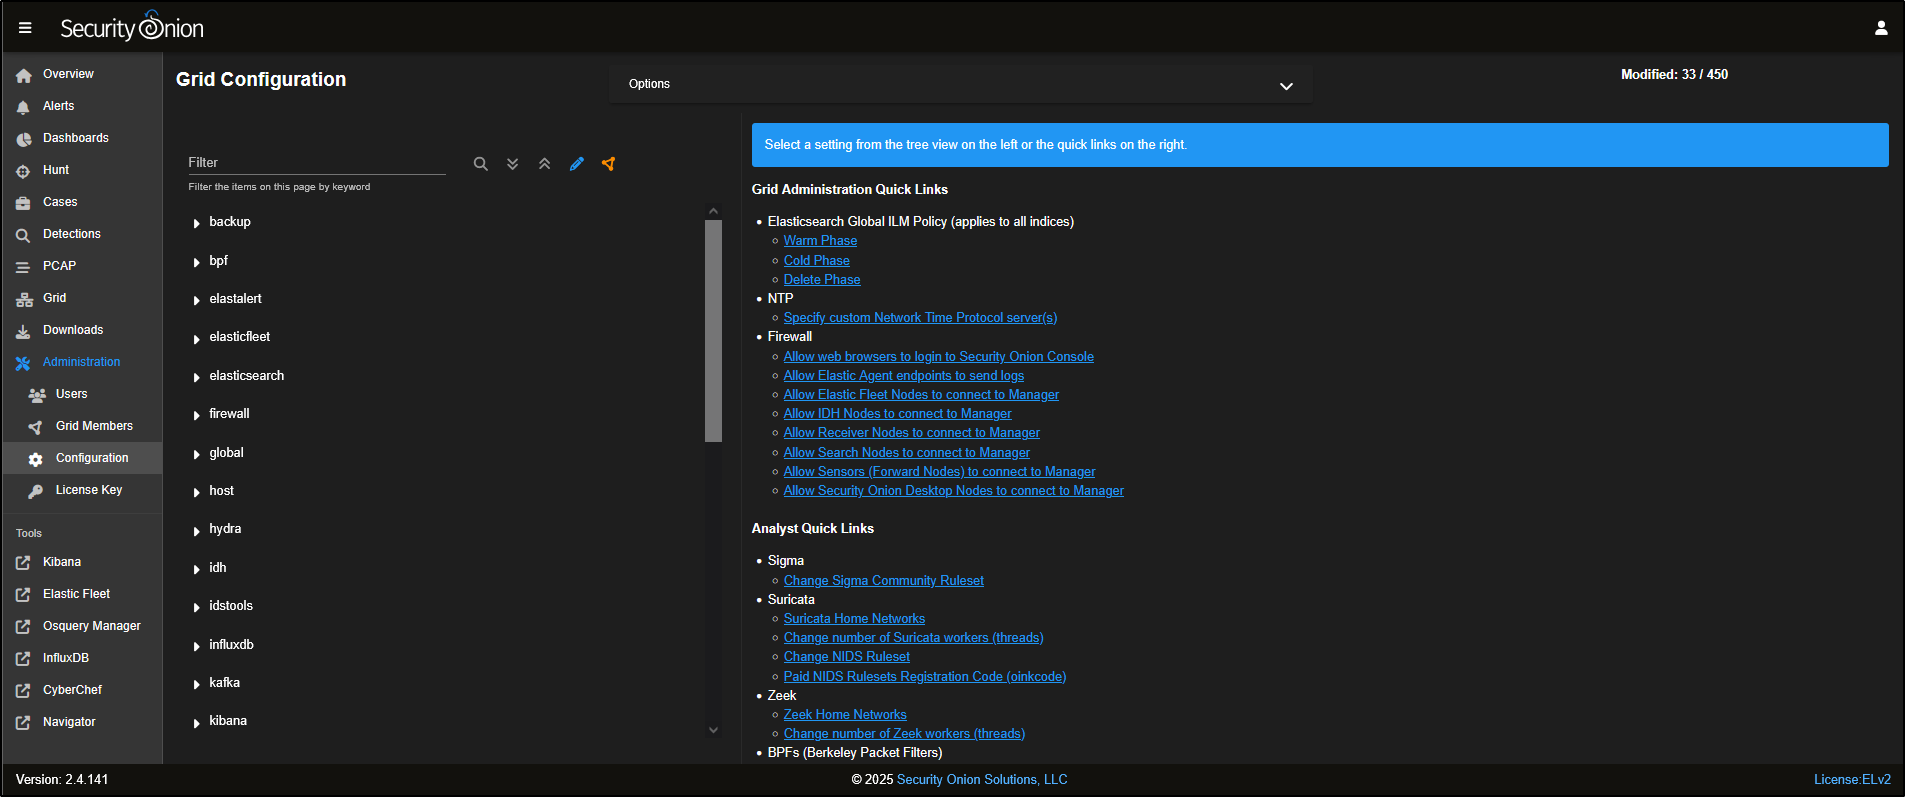
The Configuration section provides access to various platform settings, including options for updating firewall rules and adjusting log retention periods to suit your environment.
The License Key section is used to activate certain advanced enterprise features (also known as Pro features) that aren’t available in the free version.
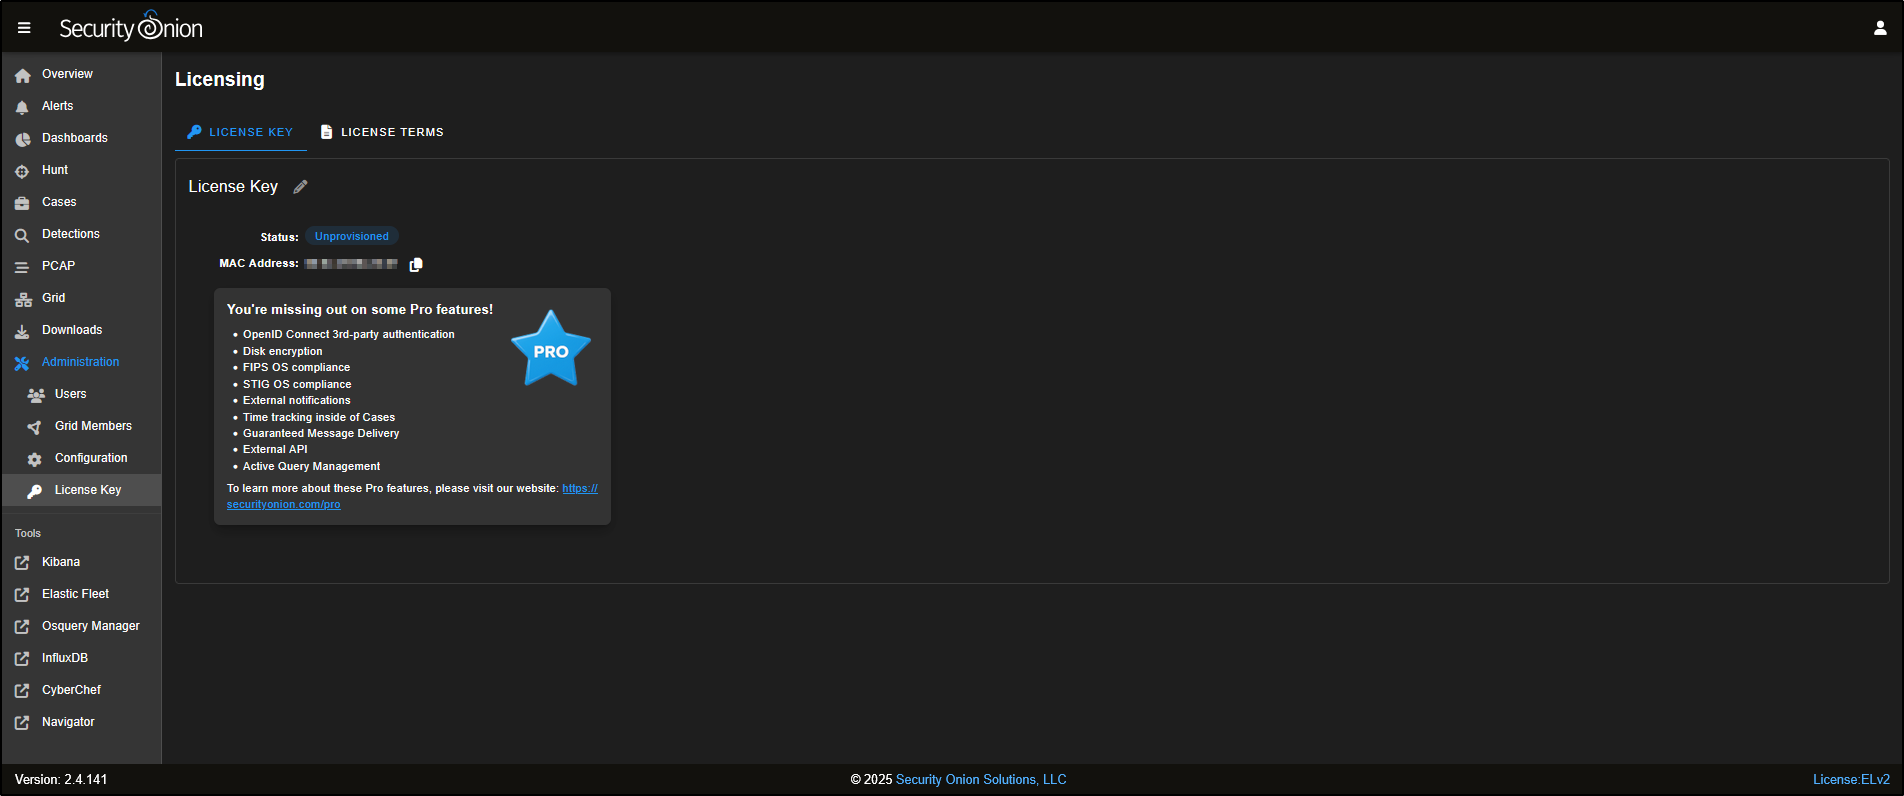
Kibana
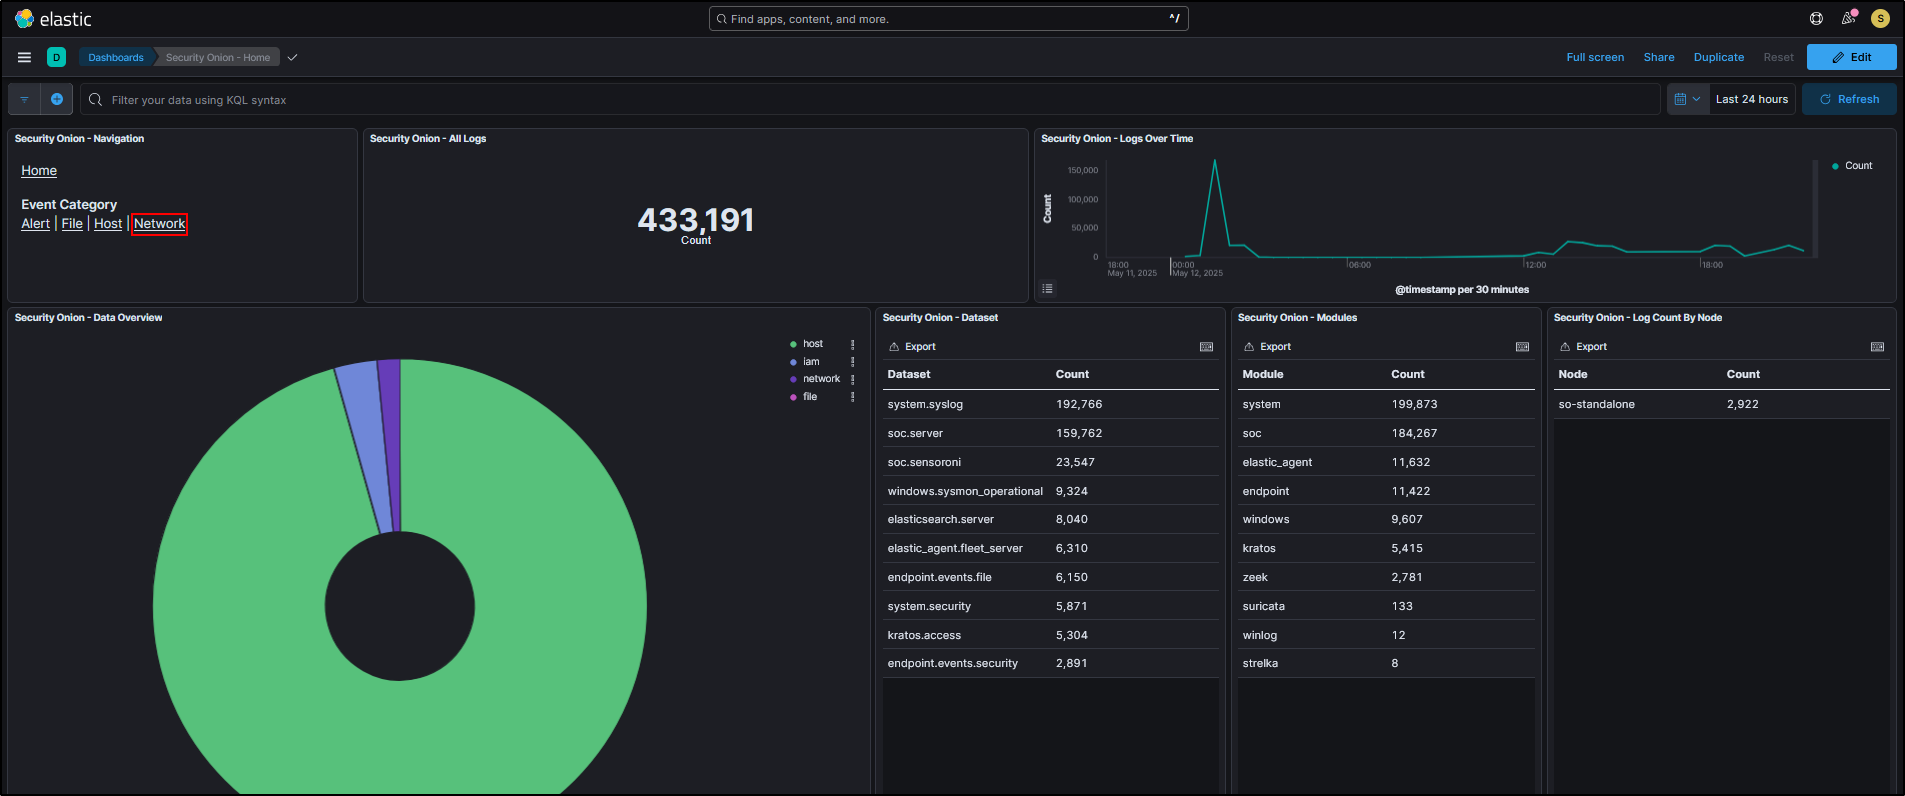
Kibana is Elastic’s web-based interface for exploring and visualising data stored in Elasticsearch. Security Onion includes a range of ready-to-use Kibana dashboards to help you analyse this data in more depth.
Clicking on Kibana from the SOC interface will open it in a new browser tab.
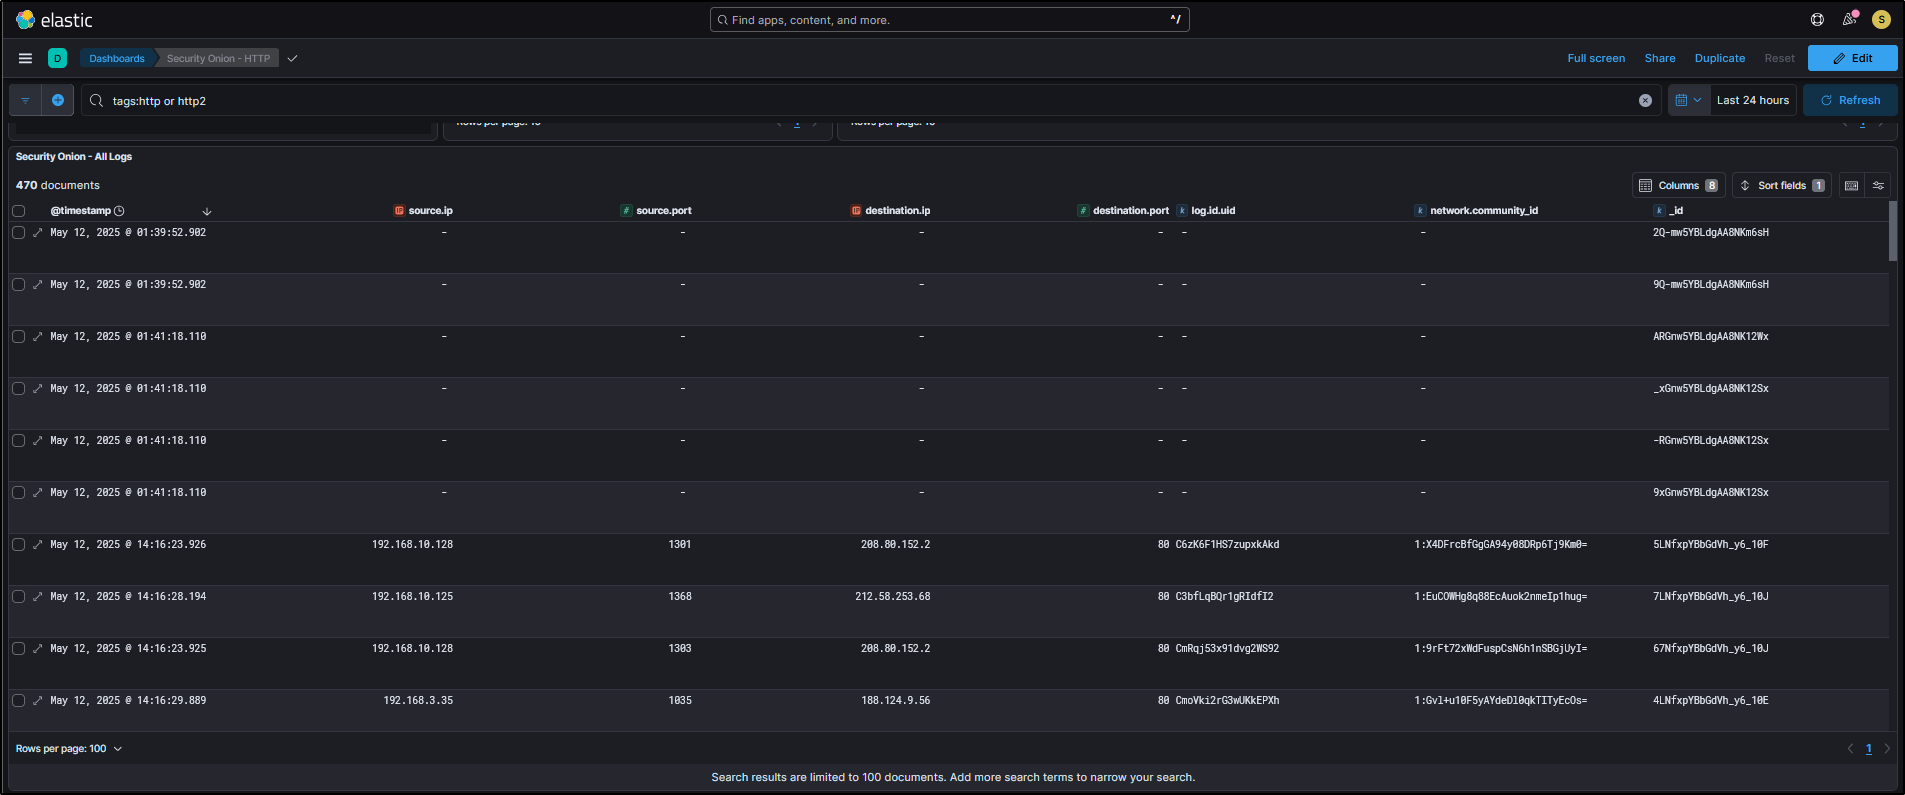
To focus on specific data, for example, HTTP logs, click Network under the Event Category, then choose HTTP under Datasets.
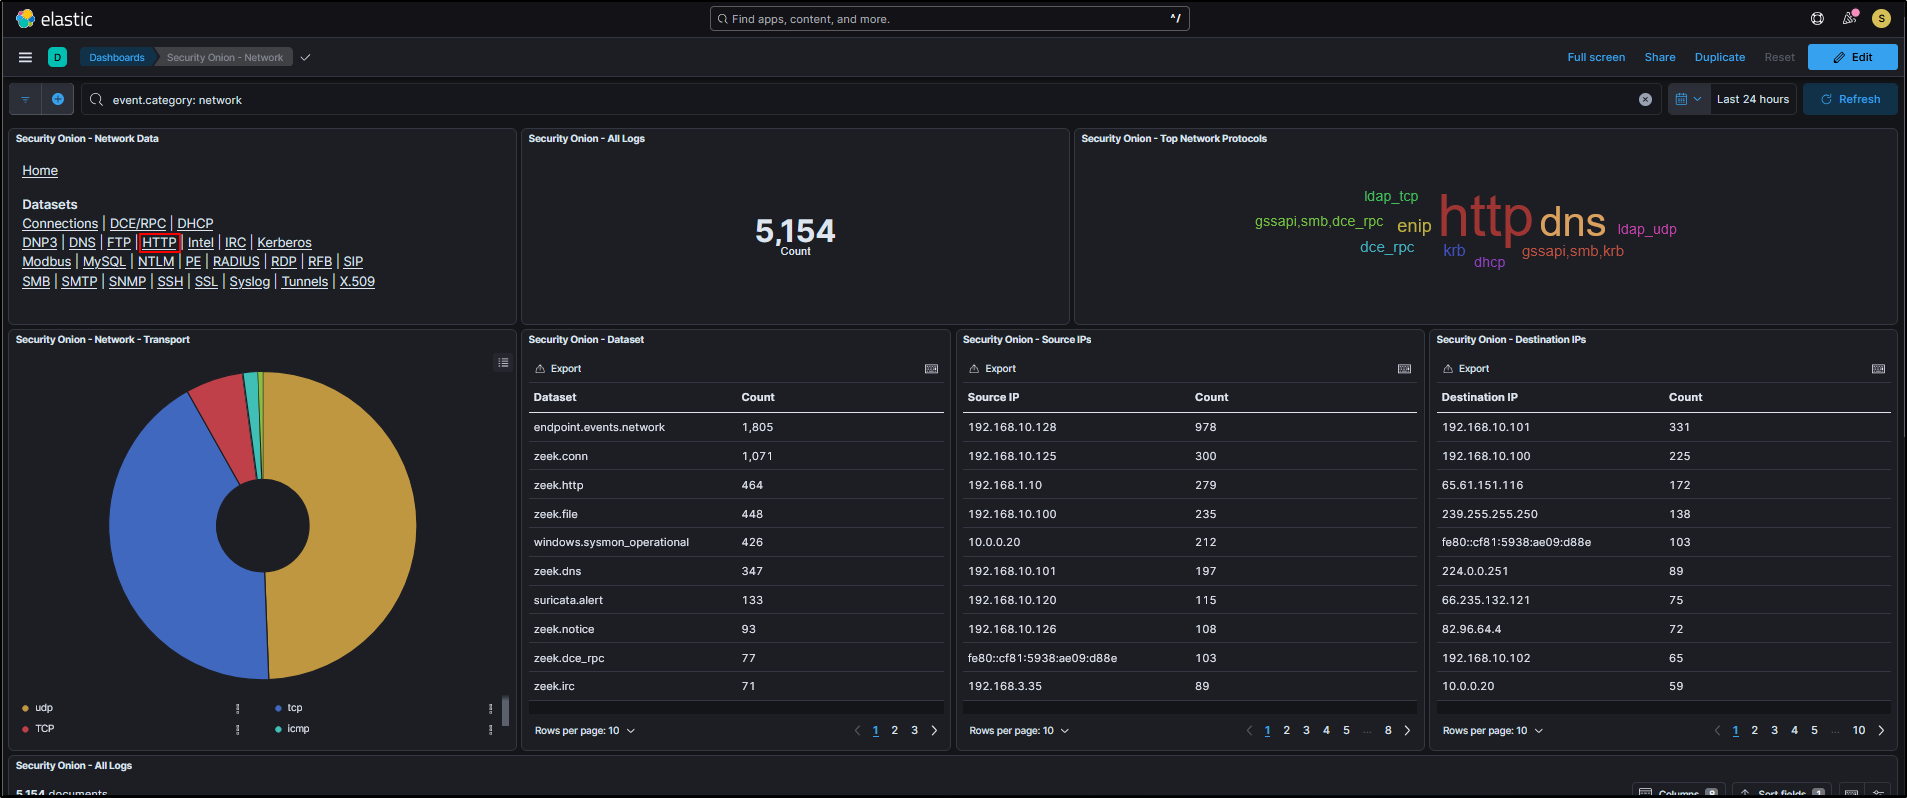
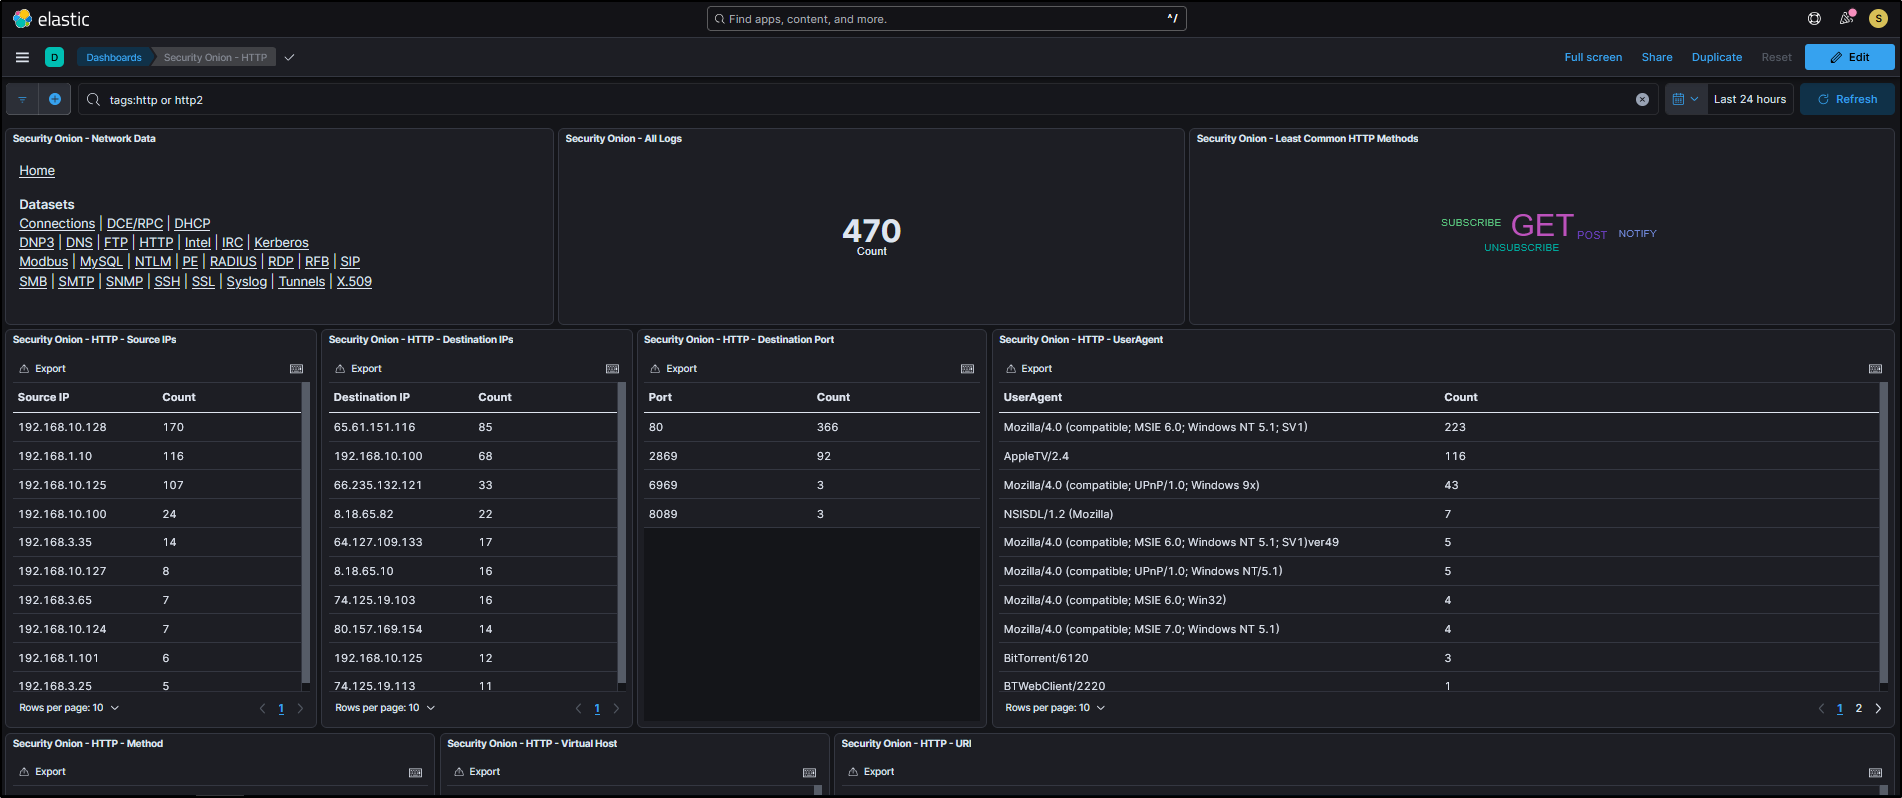
You will now see detailed tables and visualisations specifically related to HTTP data, similar to what you would find in the SOC Dashboards.
Individual events appear at the bottom of the page.
Whether you are using SOC or Kibana, you are viewing data from the same underlying Elasticsearch database. It is just presented through different interfaces.
Elastic Fleet
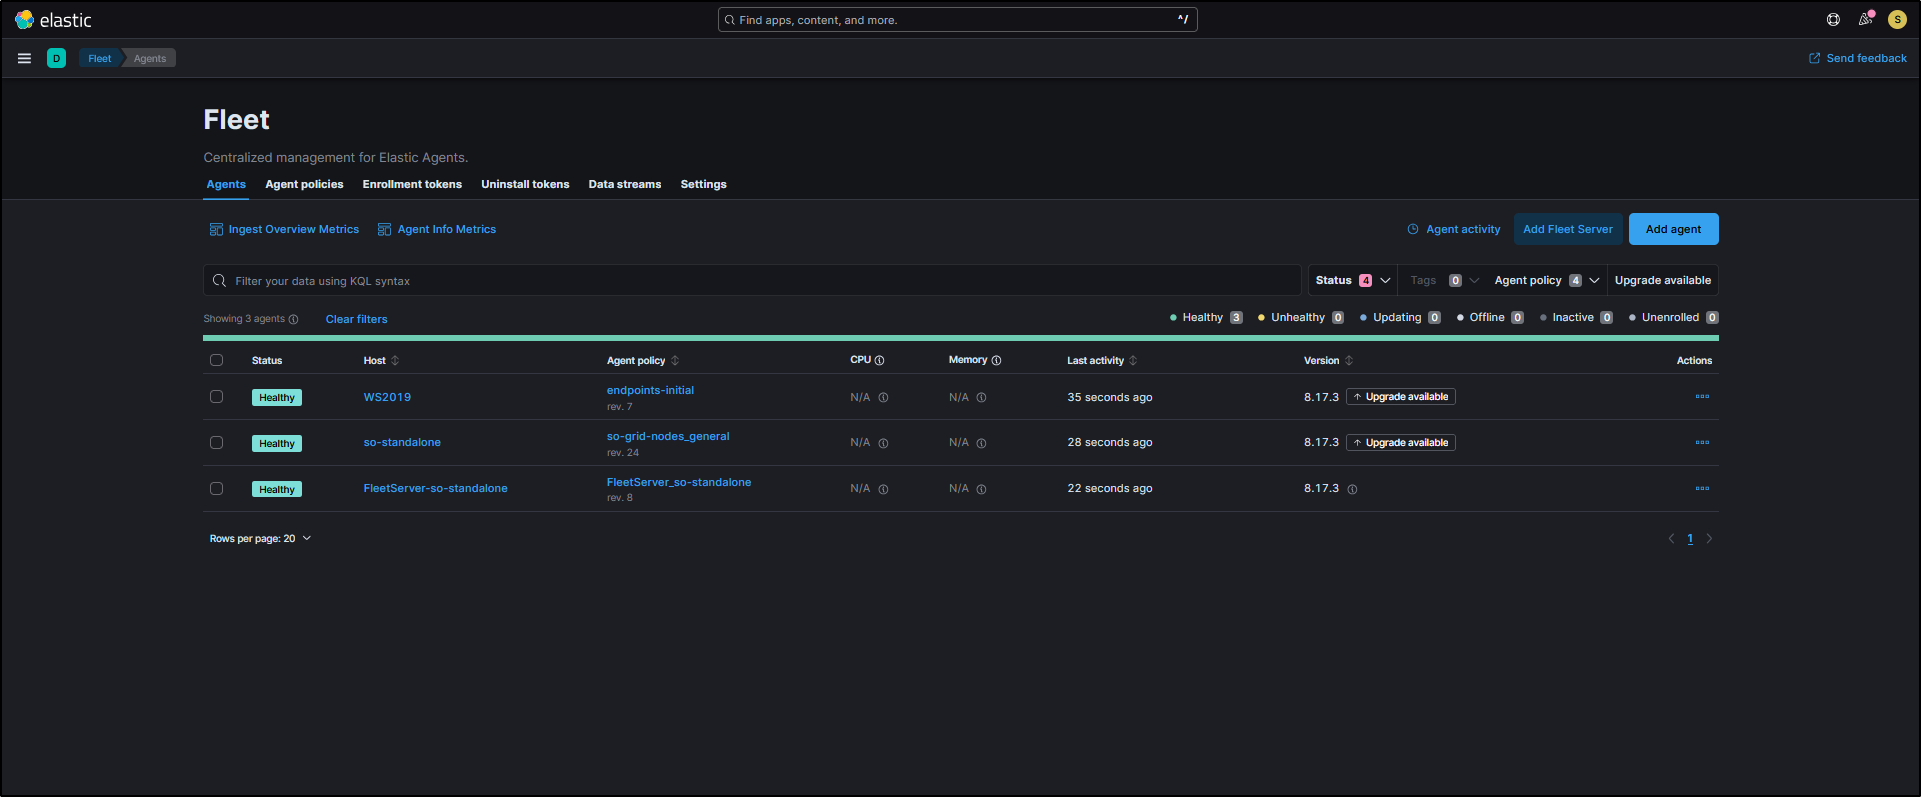
Elastic Fleet is where you manage and configure your Elastic Agents.
Clicking on Elastic Fleet in the SOC interface opens it in a new tab. You’ll see a list of registered agents, for example, WS2019, so-standalone, and FleetServer-so-standalone. These represent the hosts currently enrolled and reporting data to Security Onion.
Osquery Manager
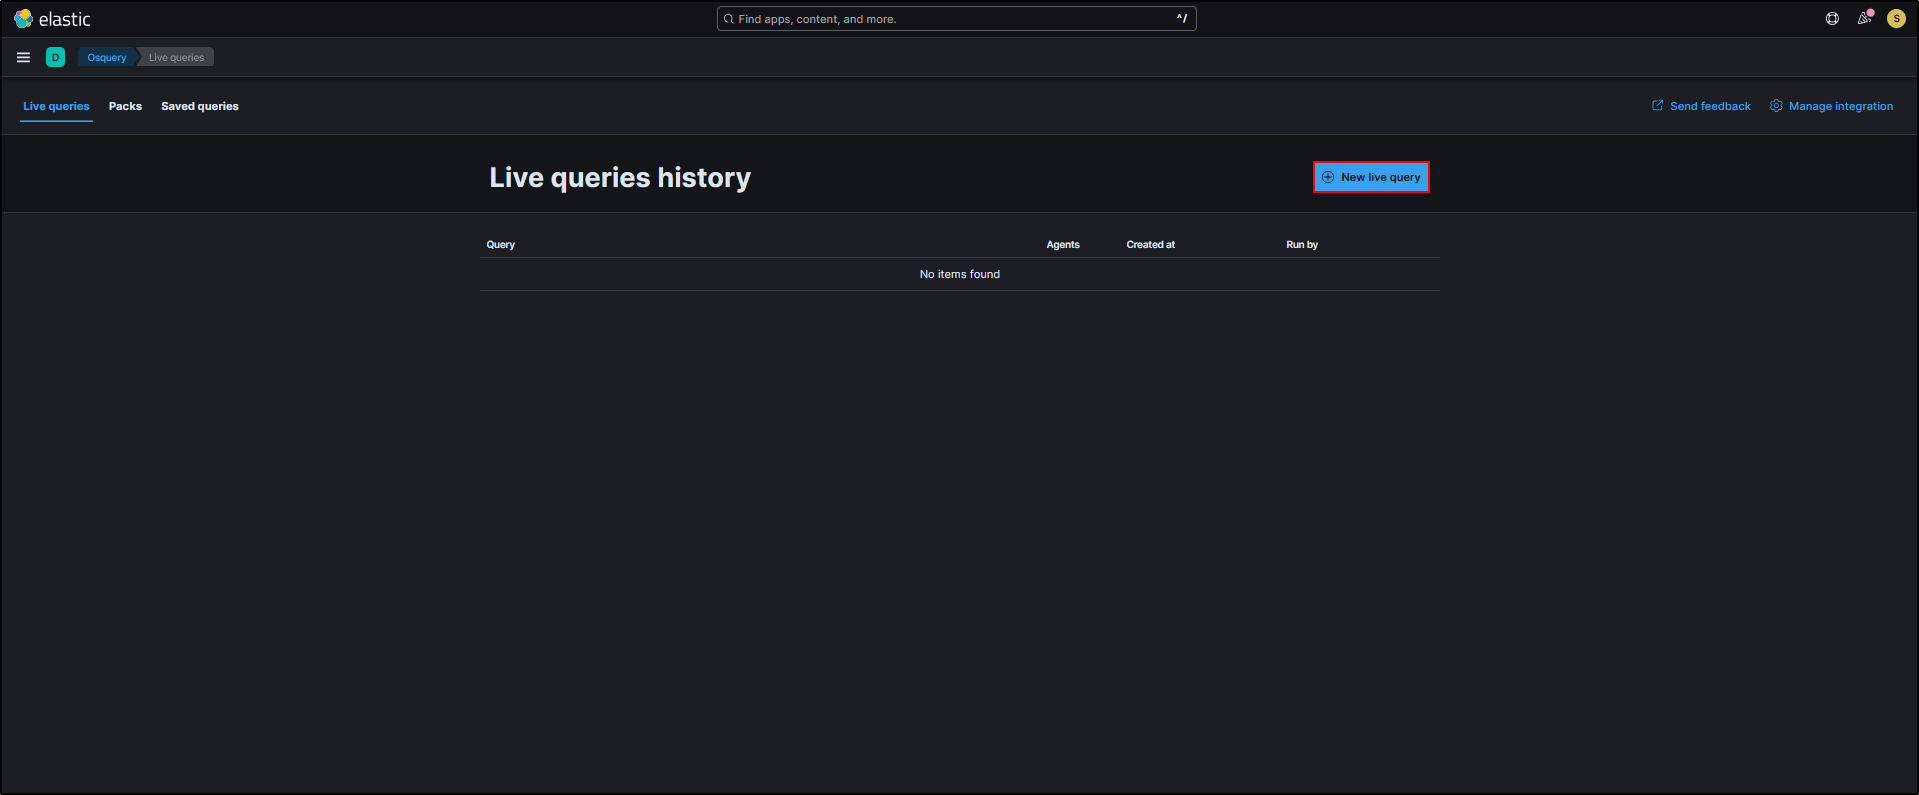
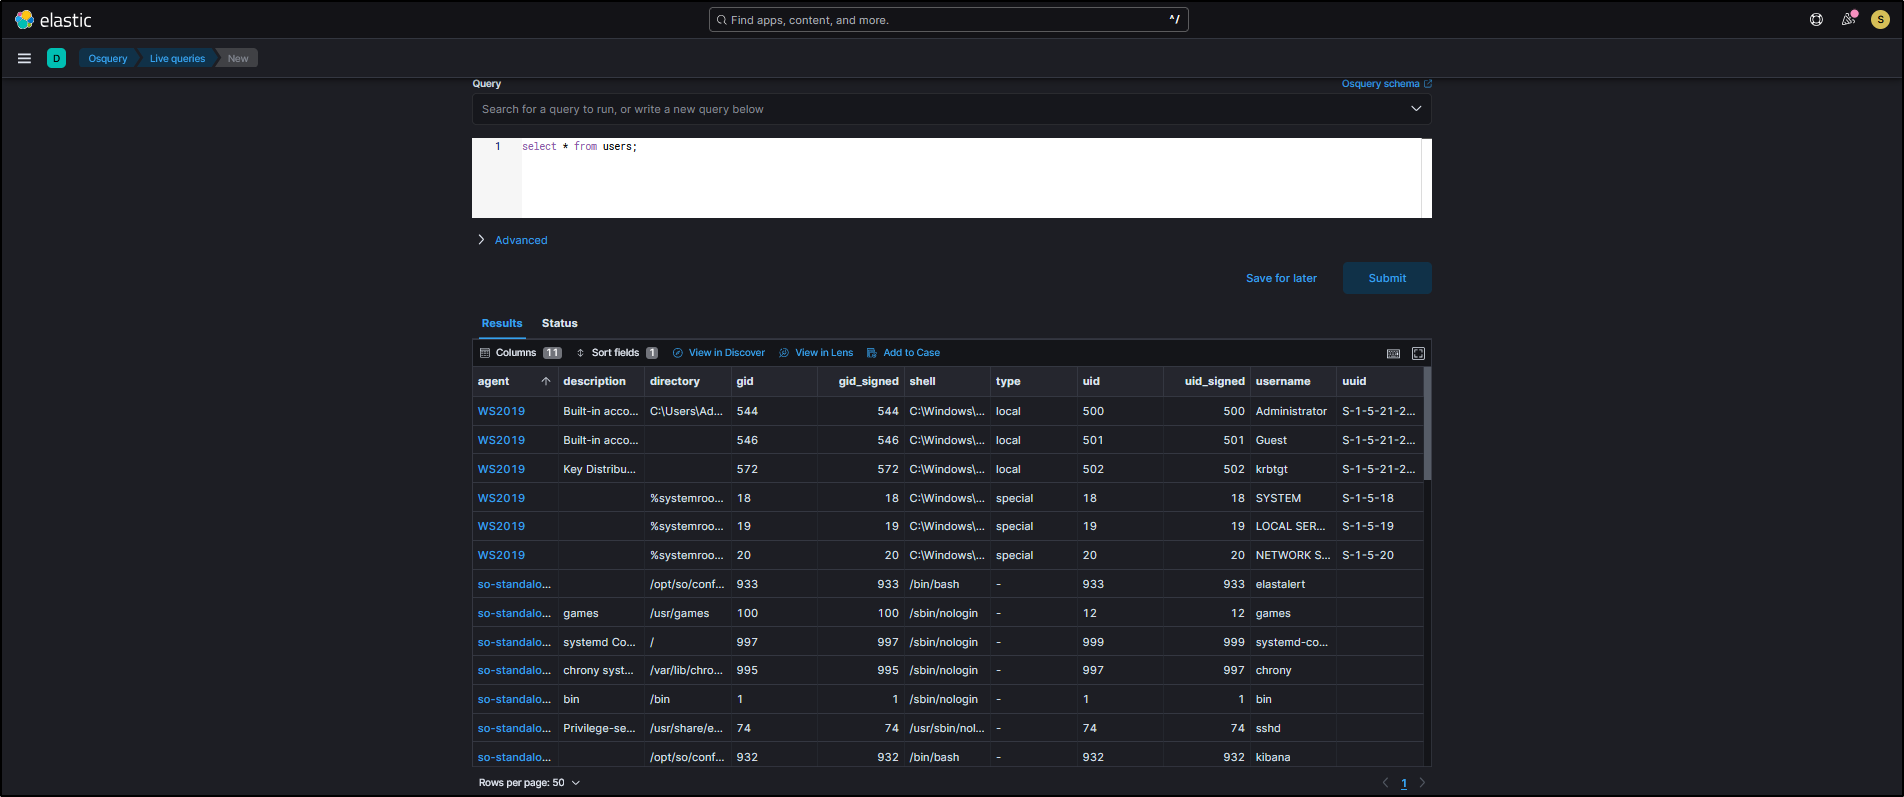
The Osquery Manager lets you send live Osquery to endpoints where Elastic Agents are installed. Originally developed by Facebook, Osquery treats endpoints like databases, allowing you to run structured queries against them.
Clicking on Osquery Manager in SOC opens it in a new tab. To get started, click New live query.
For example, if you want to gather a list of all user accounts across the machines in your network, you can run this Osquery across all agents:
For Query type, select Single query. For Agents, select All agents. For Query, enter the following query and click Submit.
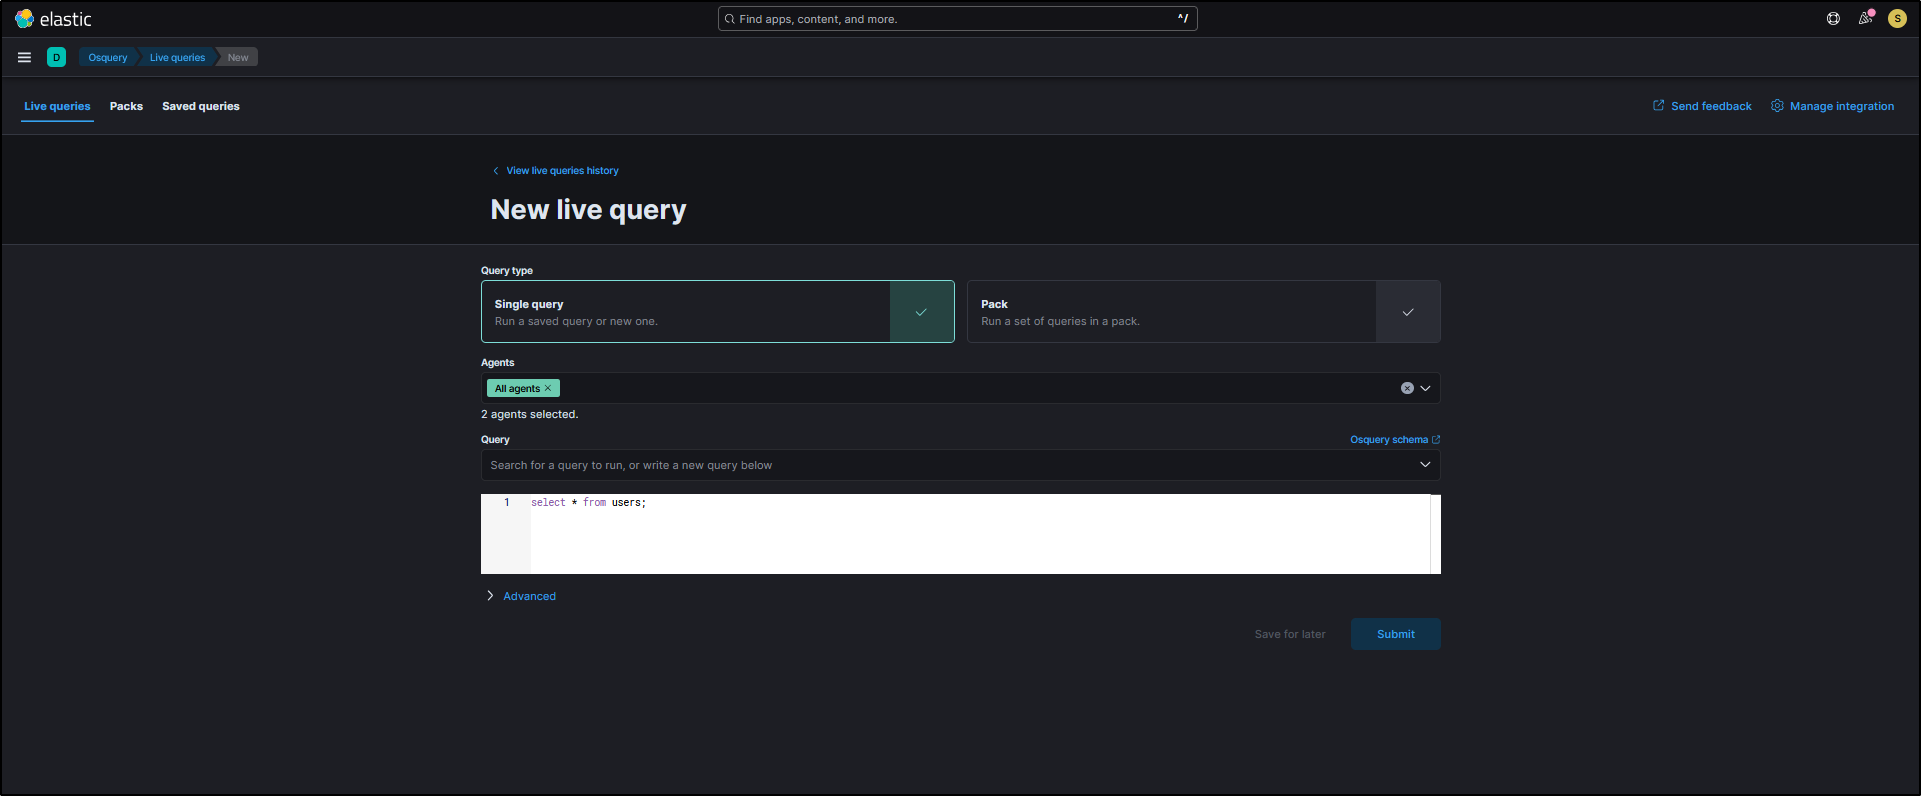
Security Onion will then contact all selected agents and request user account information regardless of what operating system each endpoint is running.
InfluxDB
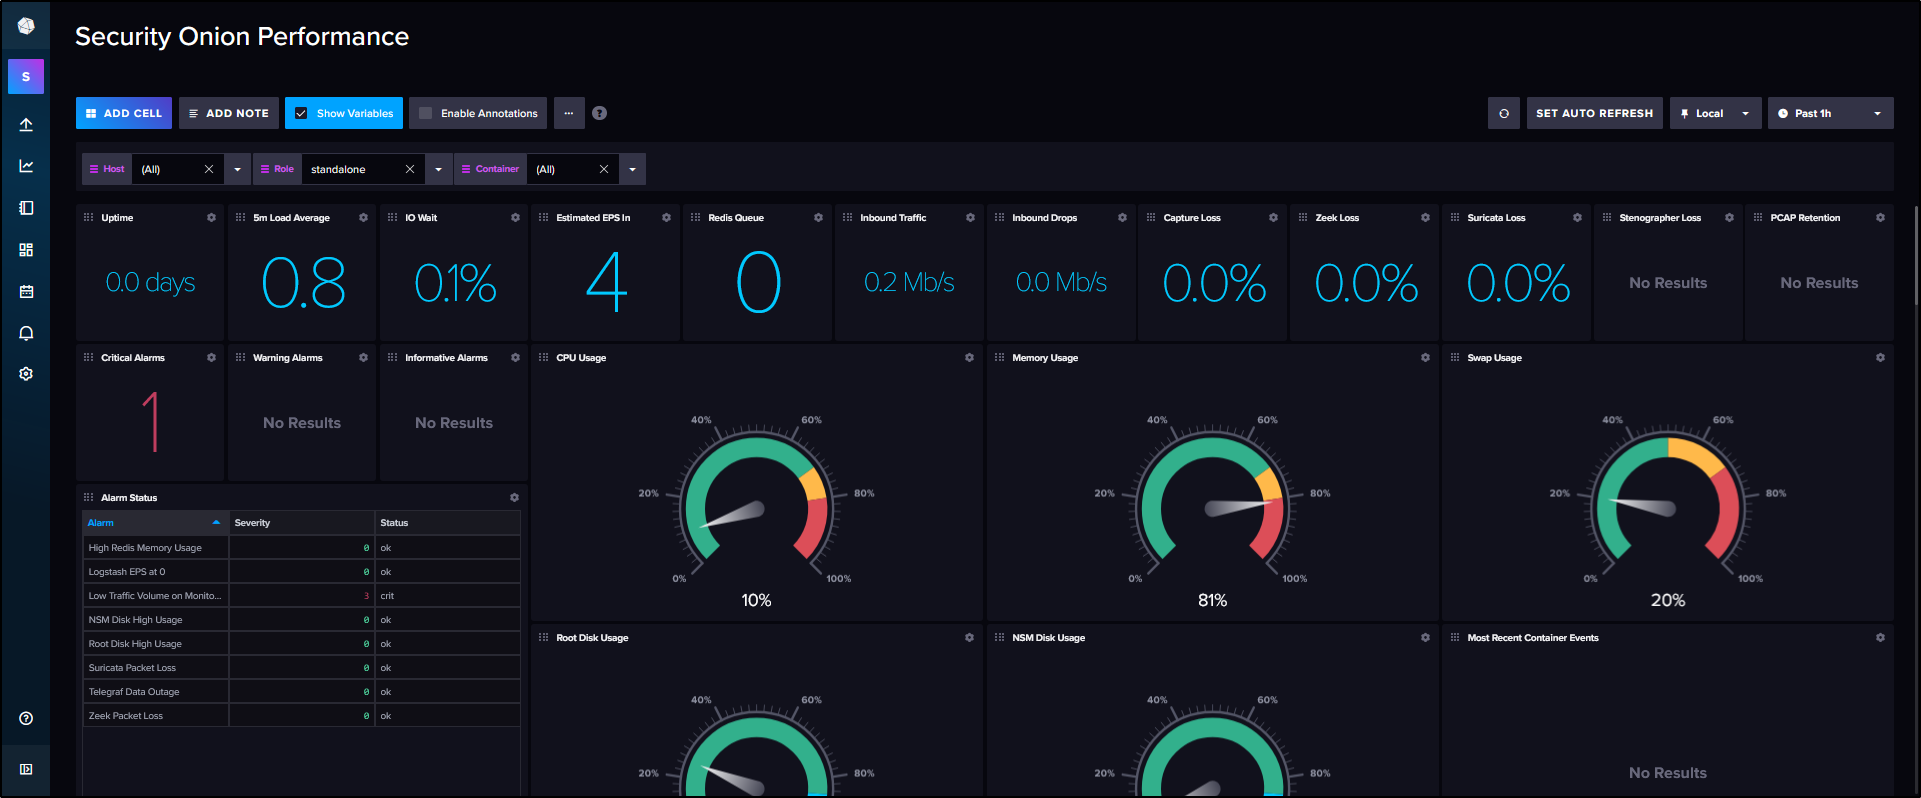
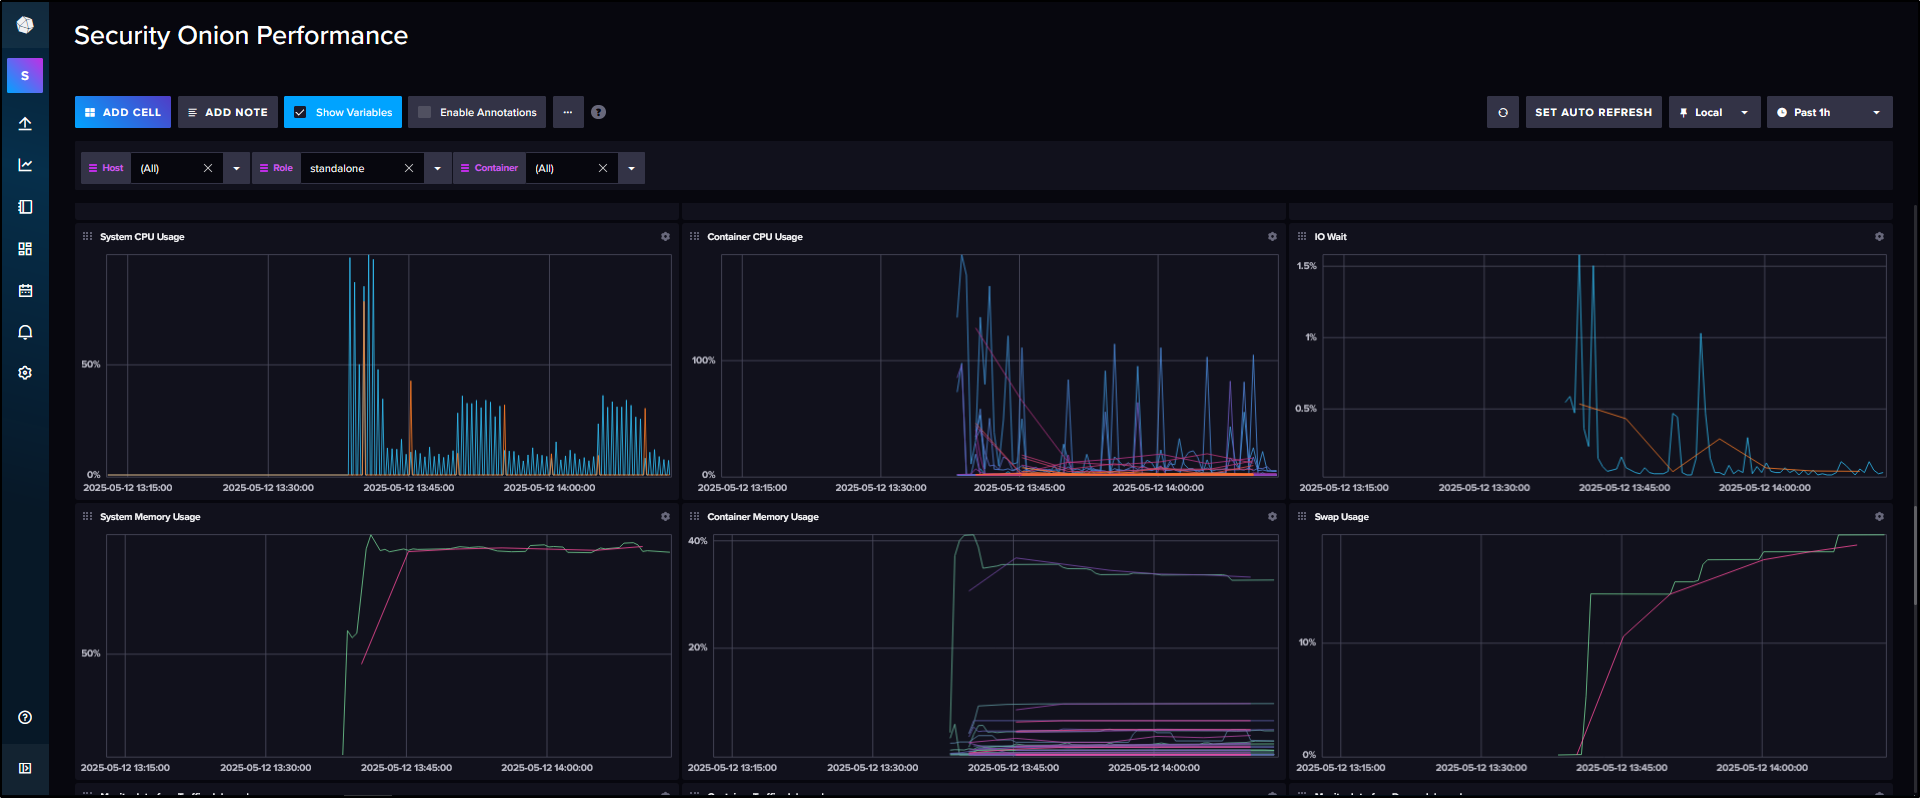
InfluxDB shows similar information to what you see on the Grid screen, but with one key difference - it provides historical telemetry, not just real-time status. This is especially useful for spotting trends, such as changes in CPU usage over time.
You can open InfluxDB by clicking InfluxDB in the SOC menu, or by clicking the node status icon at the bottom of the Node Status pane in the Grid view. Both will open it in a new tab.
CyberChef
CyberChef is a browser-based tool used for encoding, decoding, and analysing data. It is especially useful for tasks like decoding Base64, converting binary, or analysing encoded payloads in threat investigations.
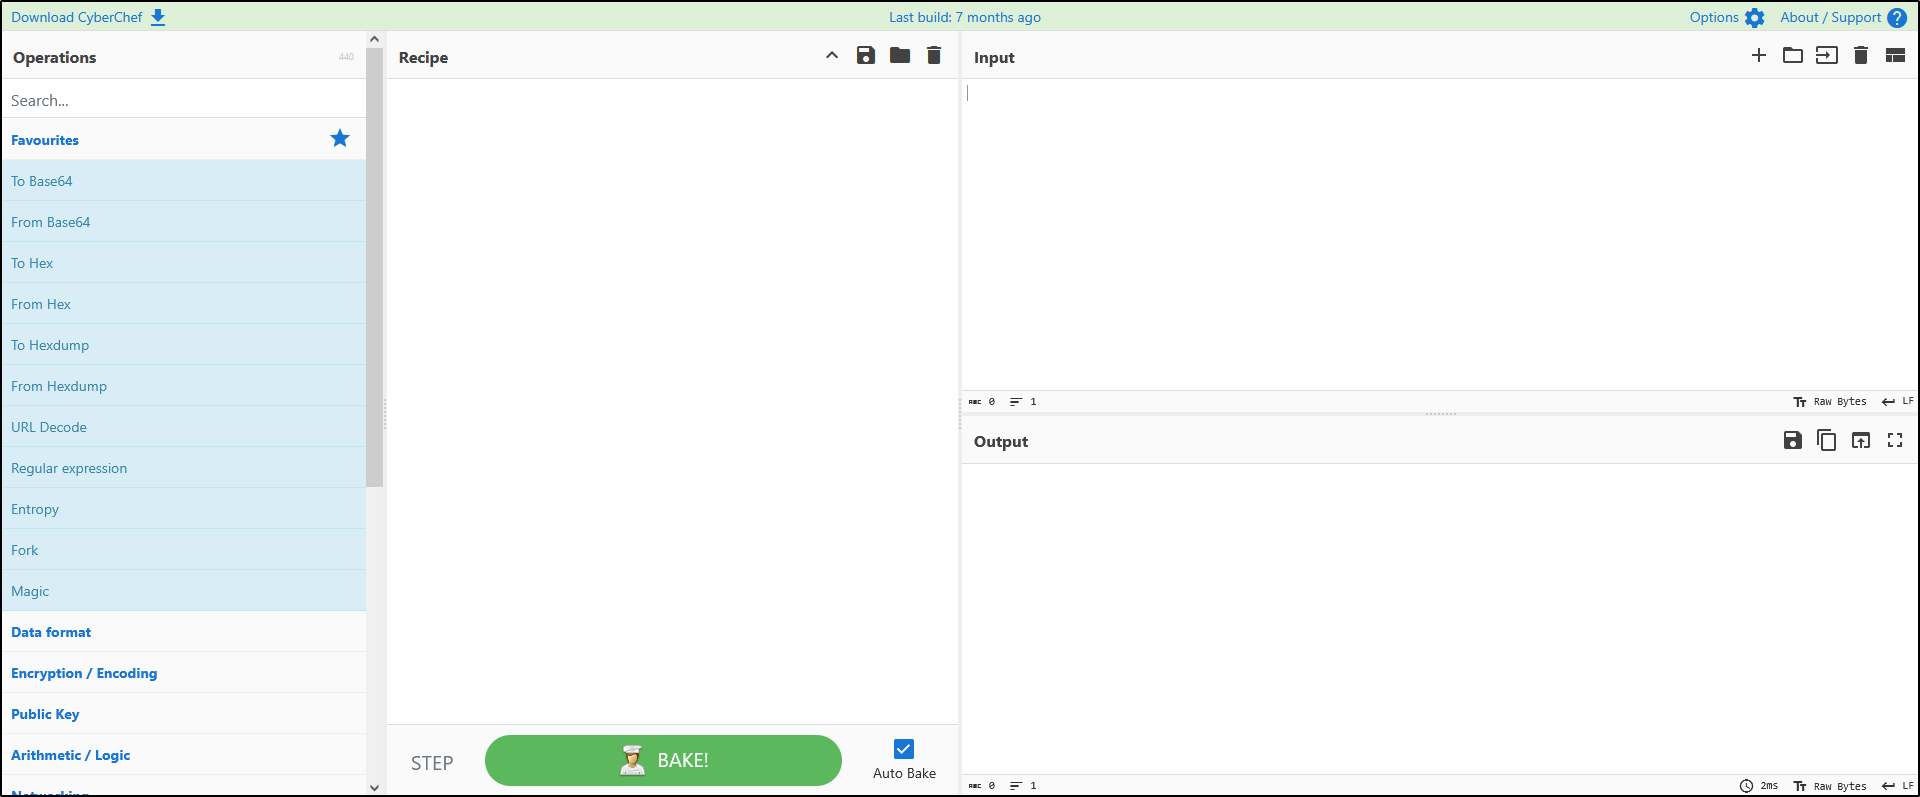
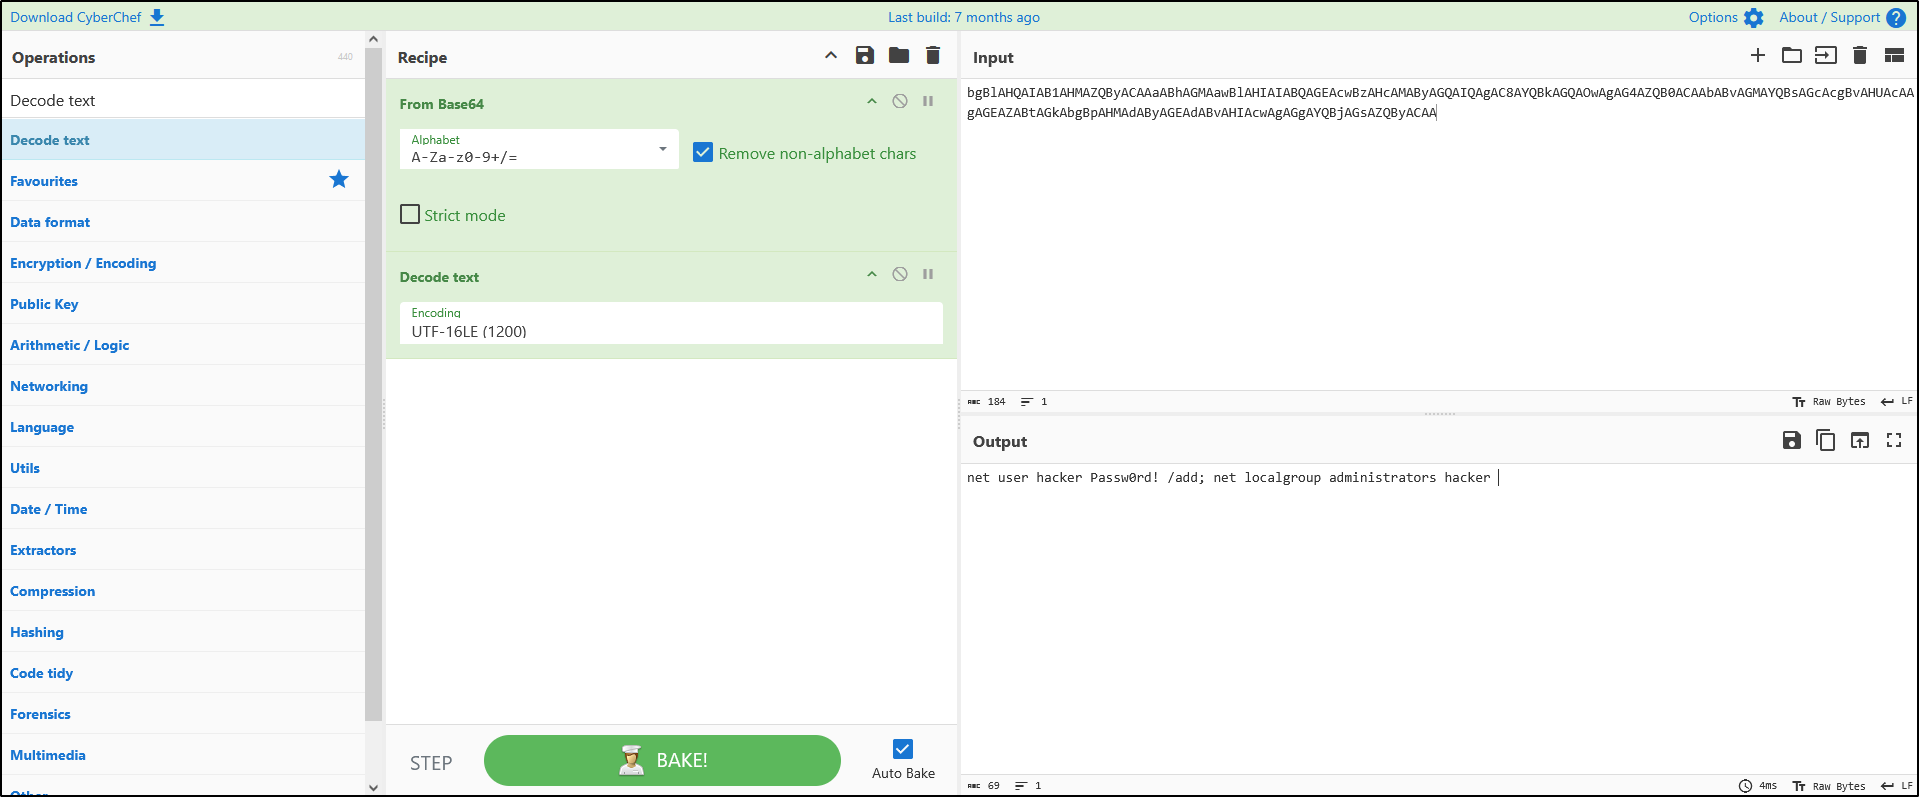
Copy and paste the following string into the Input box:
bgBlAHQAIAB1AHMAZQByACAAaABhAGMAawBlAHIAIABQAGEAcwBzAHcAMAByAGQAIQAgAC8AYQBkAGQAOwAgAG4AZQB0ACAAbABvAGMAYQBsAGcAcgBvAHUAcAAgAGEAZABtAGkAbgBpAHMAdAByAGEAdABvAHIAcwAgAGgAYQBjAGsAZQByACAA
Drag and drop From Base64 and Decode text into the Recipe panel from the Operations list. For Decode text, select the UTF-16LE encoding. You should now see the decoded command in the Output. The command appears to show the attacker adding themselves to the local administrators group.
Navigator
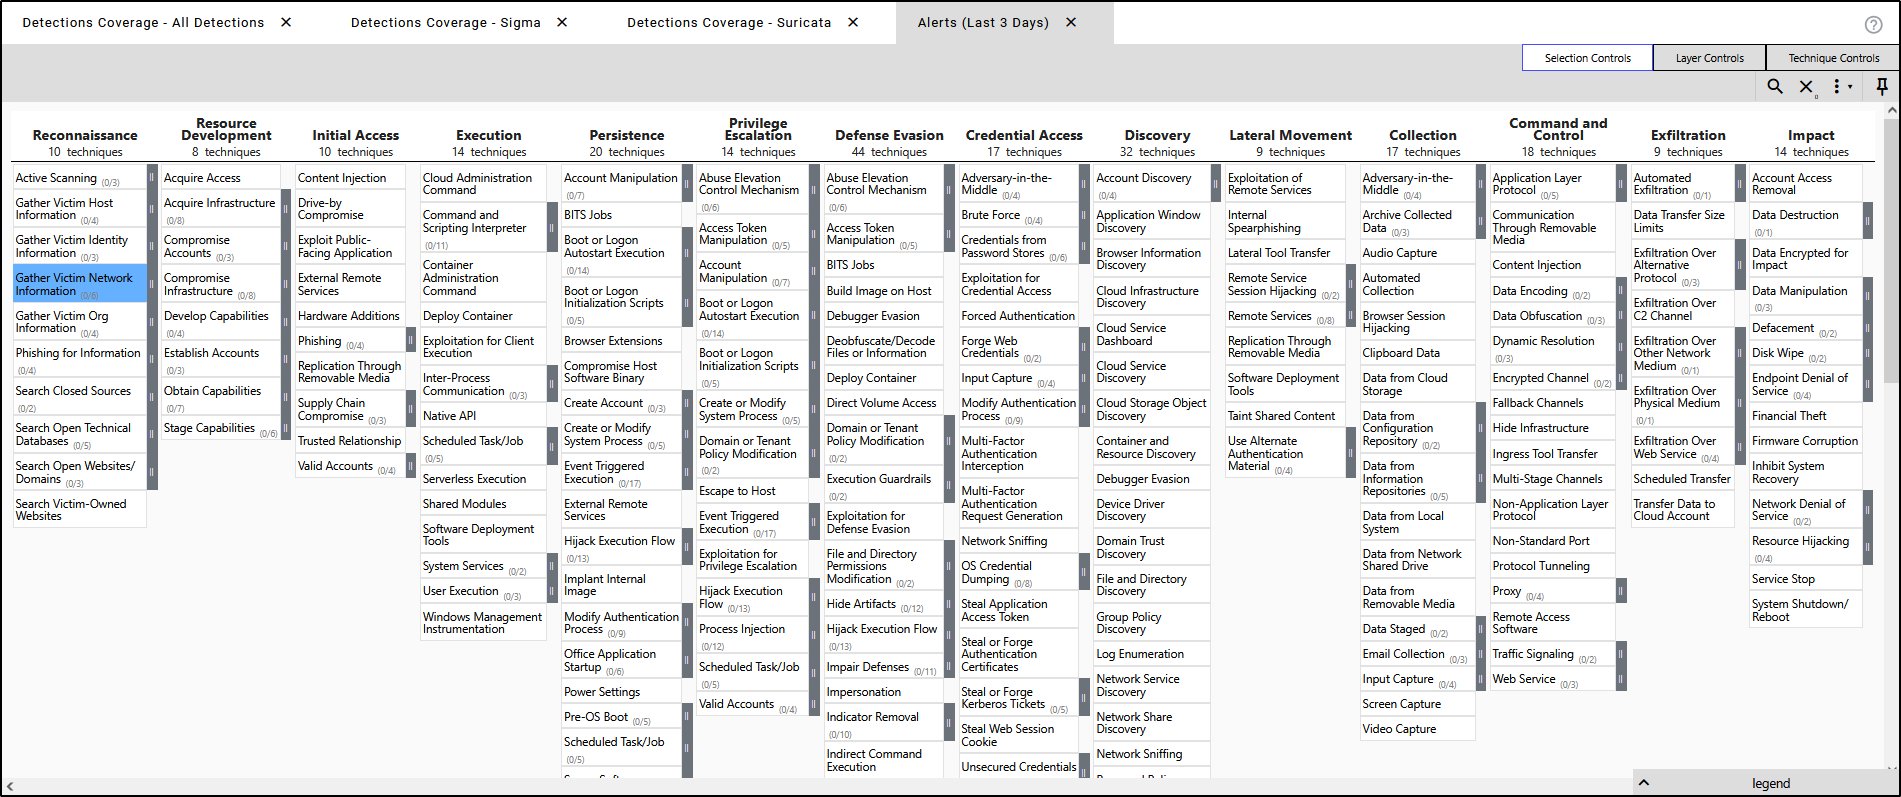
The Navigator in Security Onion is a visual tool built on the MITRE ATT&CK framework, showing which attacker techniques your environment is currently able to detect.
It does this by mapping your enabled Sigma rules to specific ATT&CK techniques, with colour coding used to indicate which areas are covered.
As you enable more rules, the chart updates automatically helping you spot any gaps in your detection coverage at a glance.