Security Onion
Build an integrated security-monitoring lab, collect network and endpoint telemetry, investigate alerts, preserve evidence in cases, and validate custom detections in a safe, isolated environment.
What Security Onion does
Security Onion is a free and open-source platform for monitoring and investigating network and host activity. It brings packet capture, intrusion detection, log management, threat hunting, and case tracking together in one analyst environment.
In the demonstrated proof of concept, Security Onion was installed in Standalone mode and an Elastic Agent was deployed to a Windows virtual machine. The lab ingested test data and used it for alert investigation and threat hunting in a safe, controlled environment.
Watch the Security Onion overview on YouTube
Choose your journey
Complete the journeys in order for the full proof of concept, or choose the task that matches an existing lab. The detailed pages retain the commands and screenshots from the demonstrated environment.
Before you begin
Documented baseline
The proof of concept records a tested environment, not a promise that later releases use identical screens or configuration. Review the current vendor requirements and release notes before rebuilding it.
| Component | Demonstrated baseline | Notes |
|---|---|---|
| Security Onion | 2.4.150 | Record the exact installed version and hotfix state |
| Deployment | Standalone | Manager and sensor capabilities on one node |
| Security Onion OS | Oracle Linux 9 | Installed from the Security Onion ISO |
| Windows endpoint | Windows Server 2019 | Elastic Agent and optional Sysmon |
| FortiGate | FortiOS 7.6.0 | Lab firewall and network-event source |
| Architecture | x86-64 | ARM is not supported |
For a Standalone node, allocate at least 4 CPU cores, 24 GB RAM, 200 GB local storage, and two suitable network interfaces. Consider 32 GB RAM or more for even modest monitored traffic. Verify these values against the current Security Onion hardware requirements.
Original walkthrough allocation
The originally published VMware walkthrough assigned 4 processor cores, 16 GB RAM, a 200 GB virtual disk, and two network adapters to the Standalone VM. That records the historical PoC configuration; it is below the current memory guidance above and should not replace the requirements for the release you deploy.
Use an isolated, authorised lab
These journeys generate attack-like activity, create temporary accounts, alter detections, and may process sensitive packet or endpoint data. Use disposable systems, obtain authorisation, take snapshots, and review the cleanup steps before testing.
Before starting, prepare:
- an x86-64 host with sufficient CPU, RAM, and local storage;
- a management interface and a separate addressless sniffing interface connected to an authorised TAP, SPAN, or isolated lab segment;
- verified Security Onion installation media;
- working time synchronisation, name resolution, and lab routing;
- administrator access and a tested recovery method; and
- enough storage for indexed telemetry and packet capture.
How data moves through this PoC
Troubleshoot from left to right. Prove the source activity exists before checking collection, transport, ingestion, search, alert logic, and case workflow.
Troubleshooting shortcuts
| Symptom | Start here |
|---|---|
| SOC does not open or a service is unhealthy | Verify the installation and inspect Grid or so-status |
| An endpoint does not connect | Check firewall and agent paths |
| Data exists but no alert fires | Trace the alert evidence |
| A hunt returns unexpected results | Review the hunting workflow |
| A custom rule does not behave as intended | Validate the detection |
| An update fails or services remain unavailable | Review update validation |
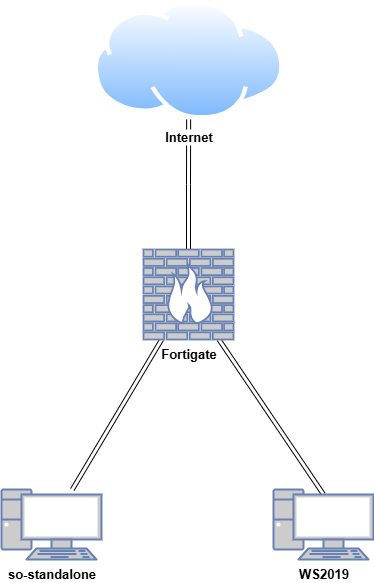
Lab architecture
| Host | OS | Role | Demonstrated address |
|---|---|---|---|
| FortiGate | FortiOS 7.6.0 | Firewall and network source | 192.168.1.18 WAN / 10.0.0.1 LAN |
| so-standalone | Oracle Linux 9 | Security Onion Standalone node | 10.0.0.100 |
| WS2019 | Windows Server 2019 | Elastic Agent and Sysmon endpoint | 10.0.0.35 |