Hunt Across Telemetry
Test a focused hypothesis across network and endpoint telemetry and document a reproducible finding.
Define the hunt
Write the hypothesis, time range, relevant hosts or networks, expected data sources, and conditions that would support or reject it. Record time zone and retention limitations before interpreting an empty result.
Detailed hunting procedure
Threat Hunting
Go to the Hunt page in the SOC web interface.
In the Options drop-down:
- Automatically apply filters, groupings and date ranges controls whether queries update automatically when you adjust search settings. If disabled, you will need to click the Hunt button manually to refresh results.
- The next three toggles let you exclude case data, detection rules, and SOC logs from your search. These are enabled by default to avoid clutter.
- You can also set an auto-refresh interval and choose a local time zone for viewing results.
In the top-right corner, you will see a Total Found count showing how many records were returned by the current query.
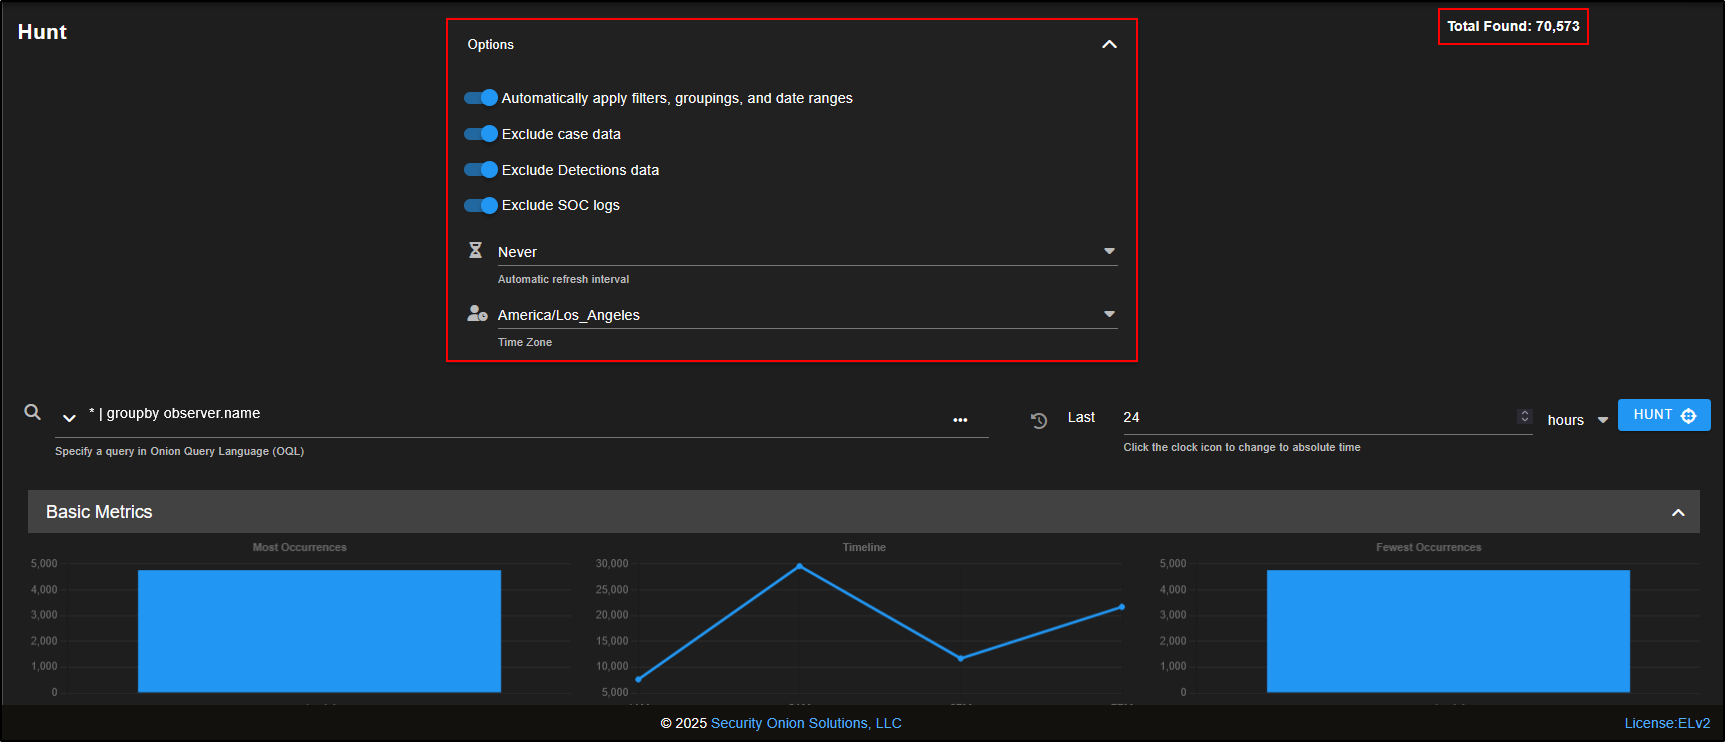
In the top-left corner of the Hunt page, you will find the query drop-down. Clicking the down arrow reveals a list of prebuilt queries.
Next to it is a free-text query box, where you can enter custom searches using Onion Query Language (OQL) which is ****a simple, powerful syntax tailored for Security Onion.
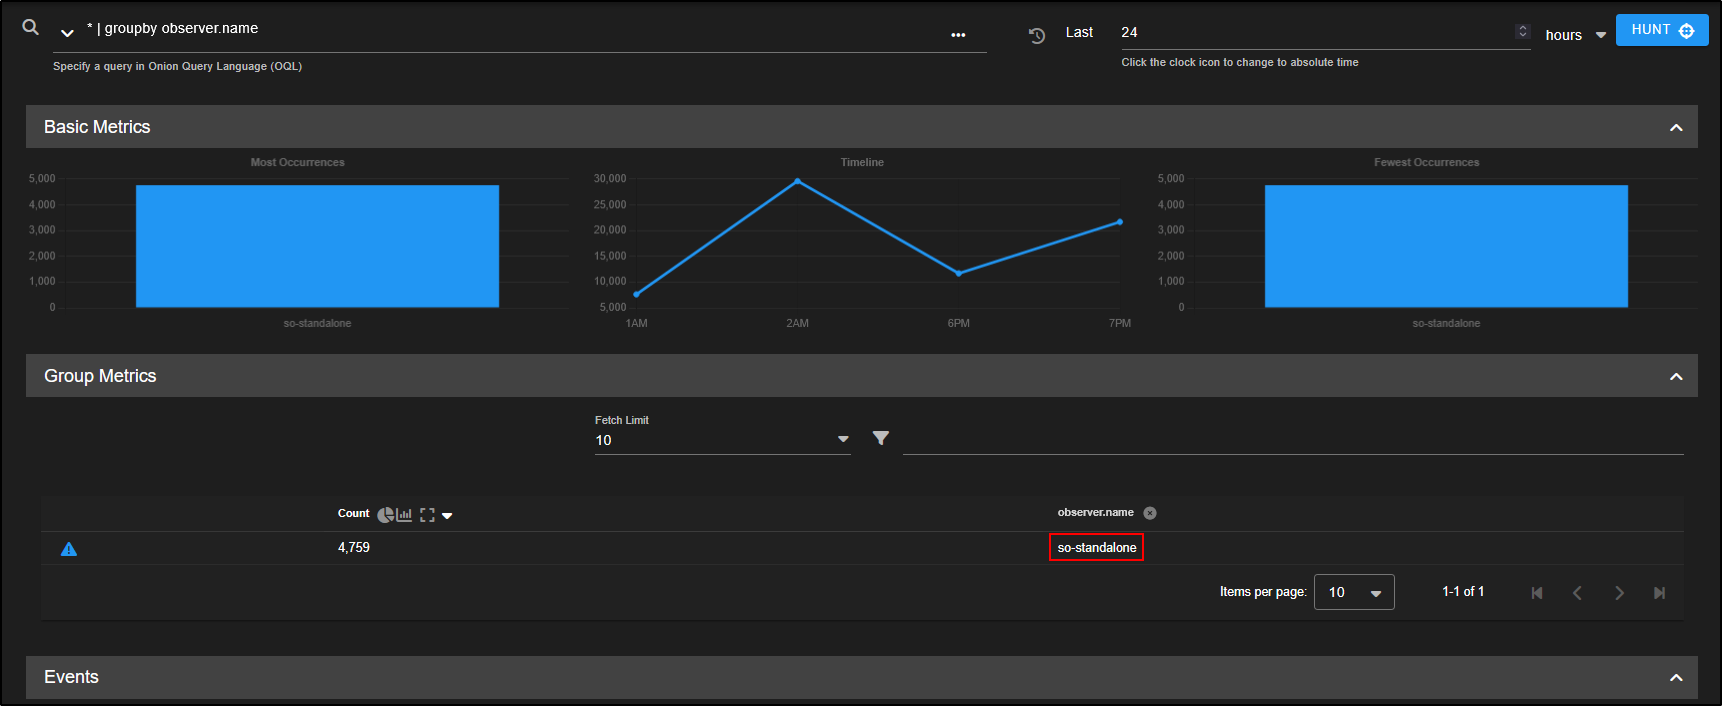
By default, the query is *, which means:
- Show all records from the last 24 hours.
- Group them by observer.name which, in a Standalone setup, is just your Security Onion VM.
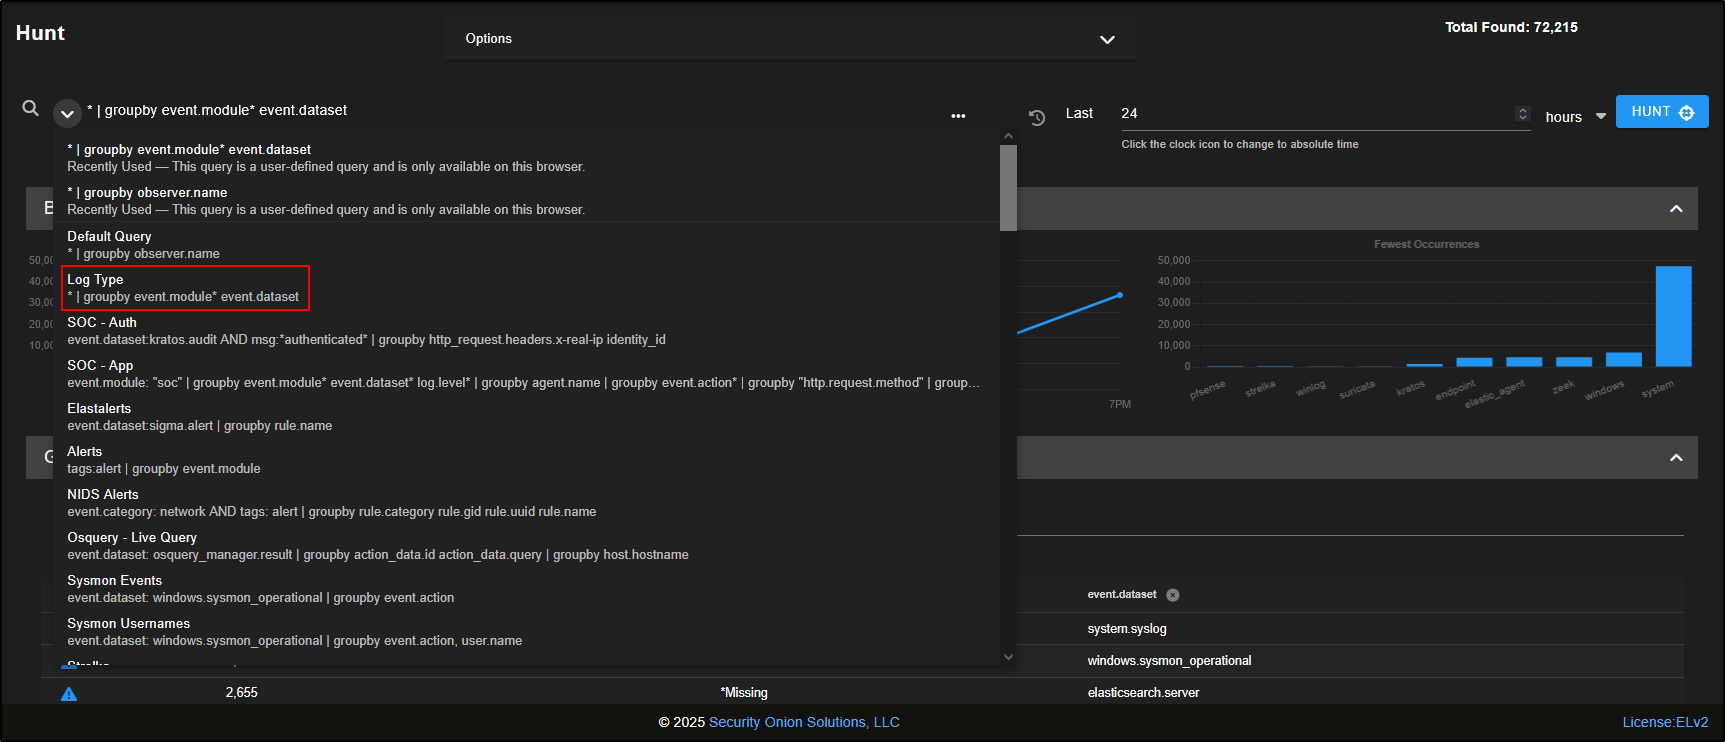
From the query drop-down, select Log Type.
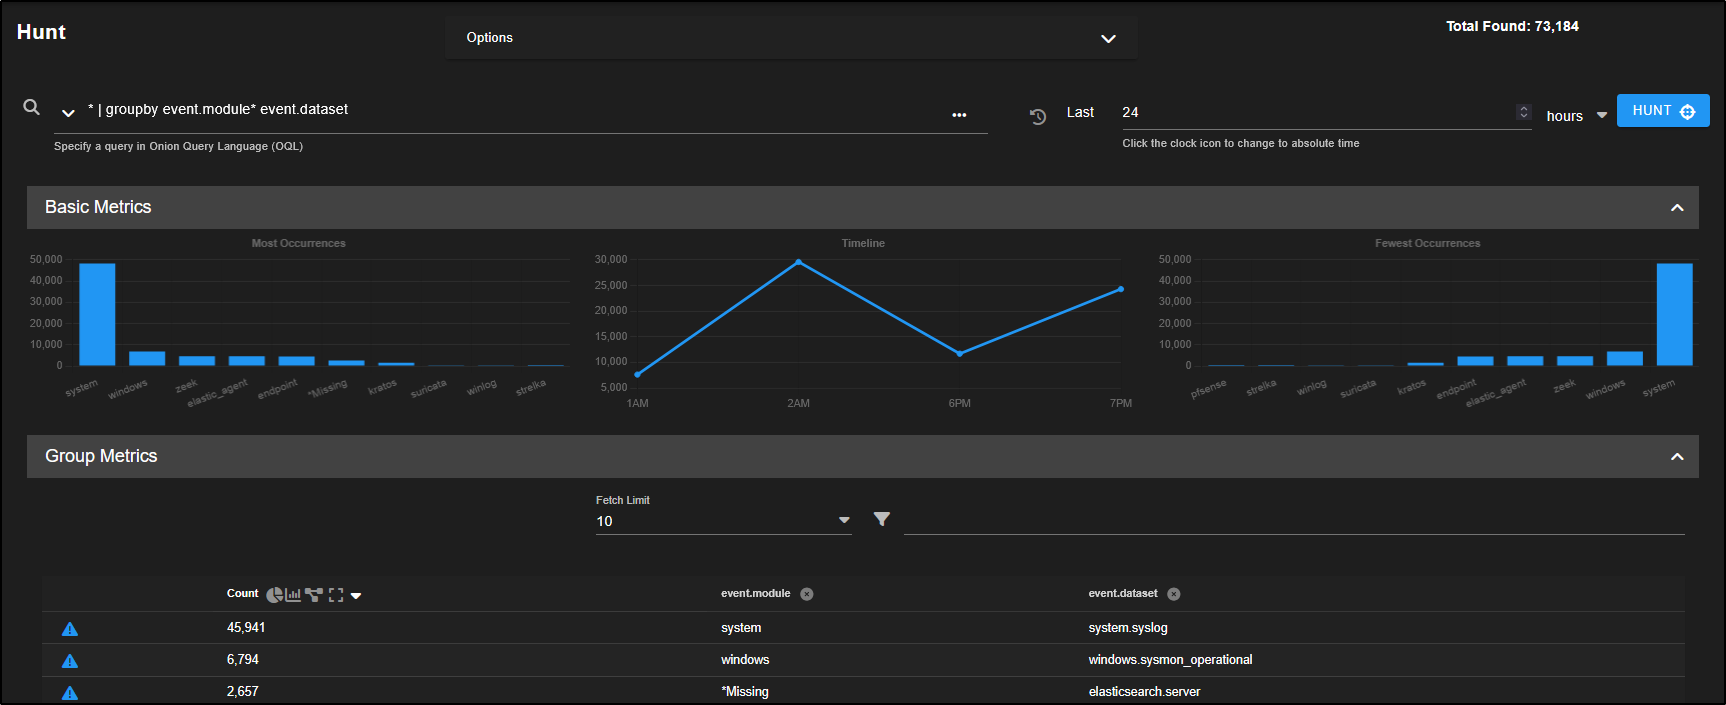
We are now viewing all records, grouped by their event modules and datasets.
- Base Metrics have been refreshed to reflect the current query.
- The bar graphs display the most common event modules, ranked from highest to lowest.
- Group Metrics show how many records exist for each combination of event module and dataset, giving a clearer picture of log volume and distribution.
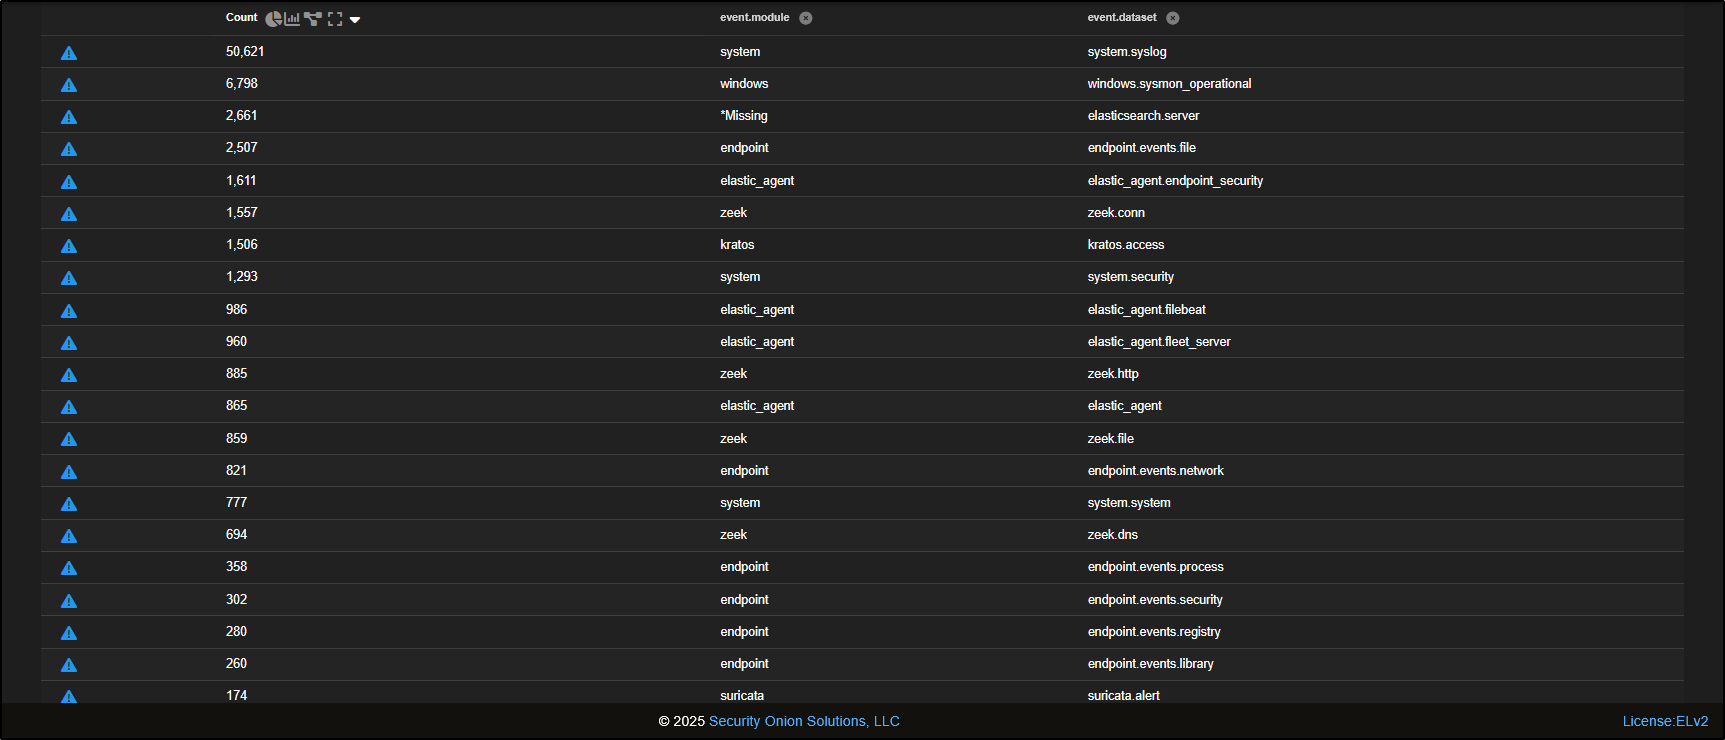
Scrolling down, you will see Suricata alerts, which are generated by the Network Intrusion Detection System (NIDS) built into Security Onion.
You will also notice a variety of metadata produced by Zeek. For every network flow observed, Zeek logs:
- A connection record (basic flow info), and
- A protocol-specific record (e.g. HTTP, DNS) if the traffic matches known protocol patterns.
This layered logging helps analysts get both high-level context and detailed protocol insights during threat hunts.
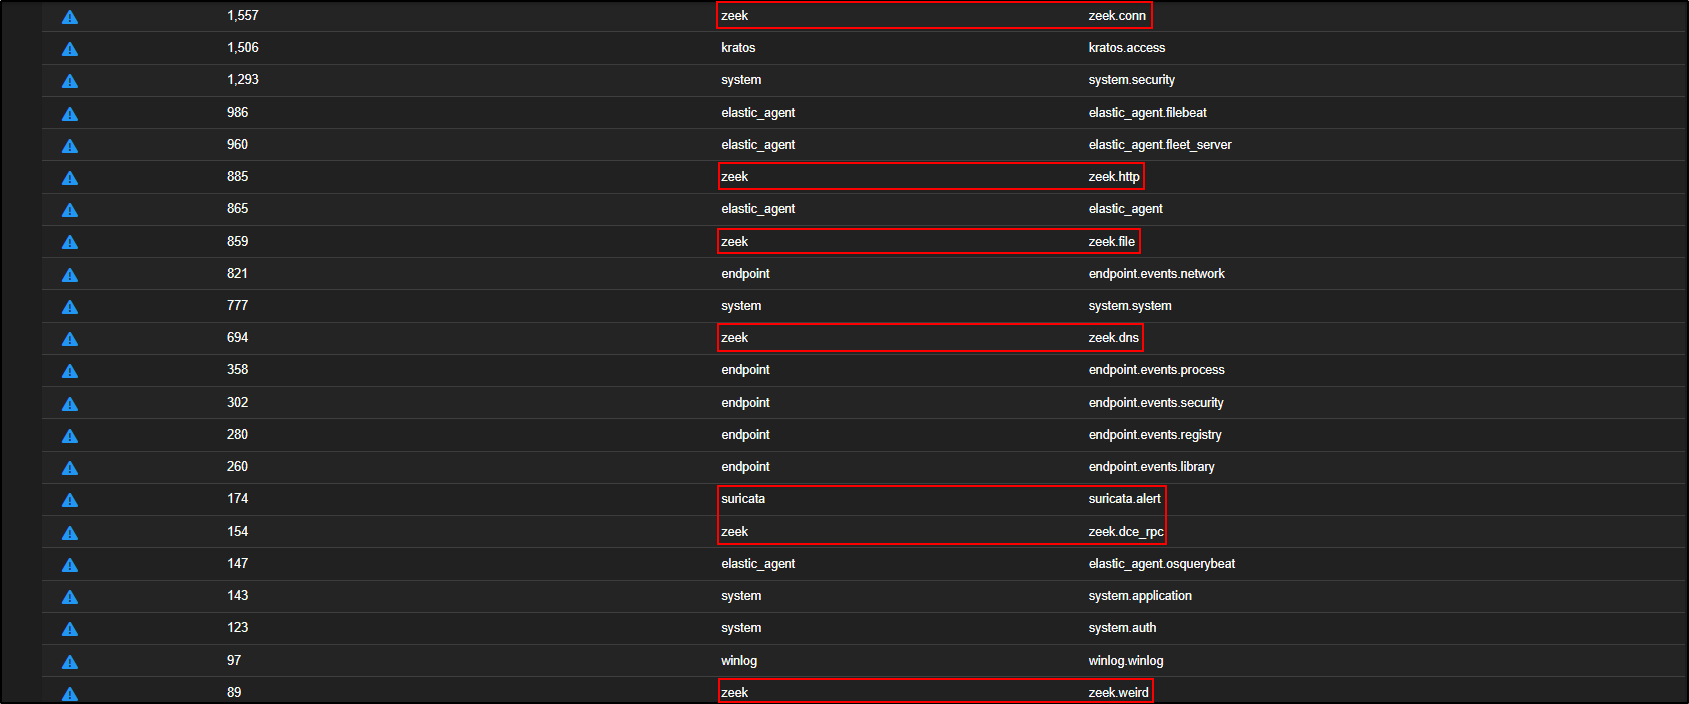
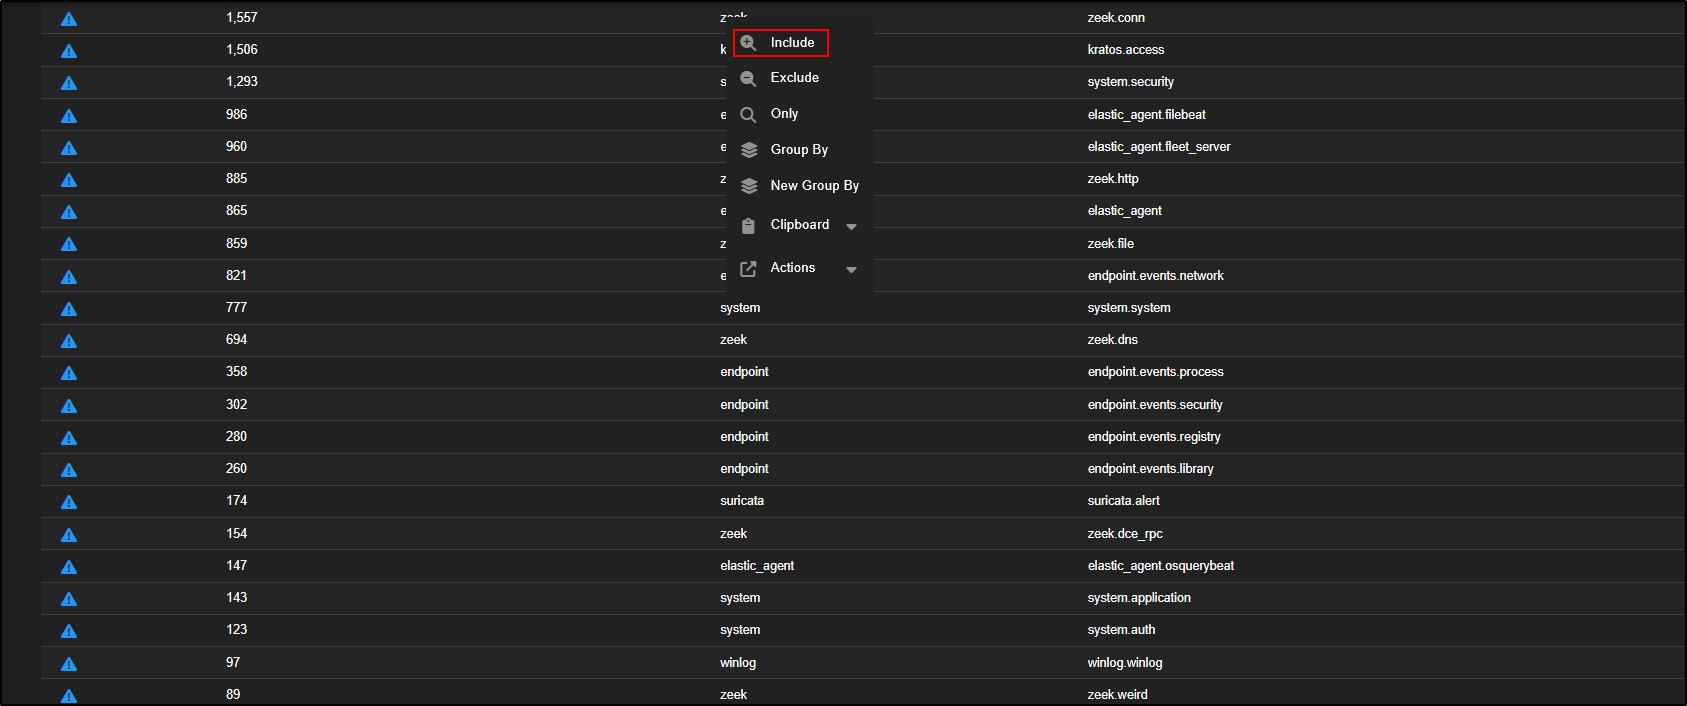
To look at zeek logs, click on zeek and select Include.
The query now reads AND event.module:"zeek". This tells Security Onion to show only Zeek events, grouped by both event.module and event.dataset.
But since we are already filtering for just Zeek, grouping by event.module is redundant. You can tidy up the view by:
- Removing
groupby event.modulefrom the query box, or - Clicking the close icon above the group column to remove it.
This will simplify the results, grouping only by event.dataset, which is more useful in this context.
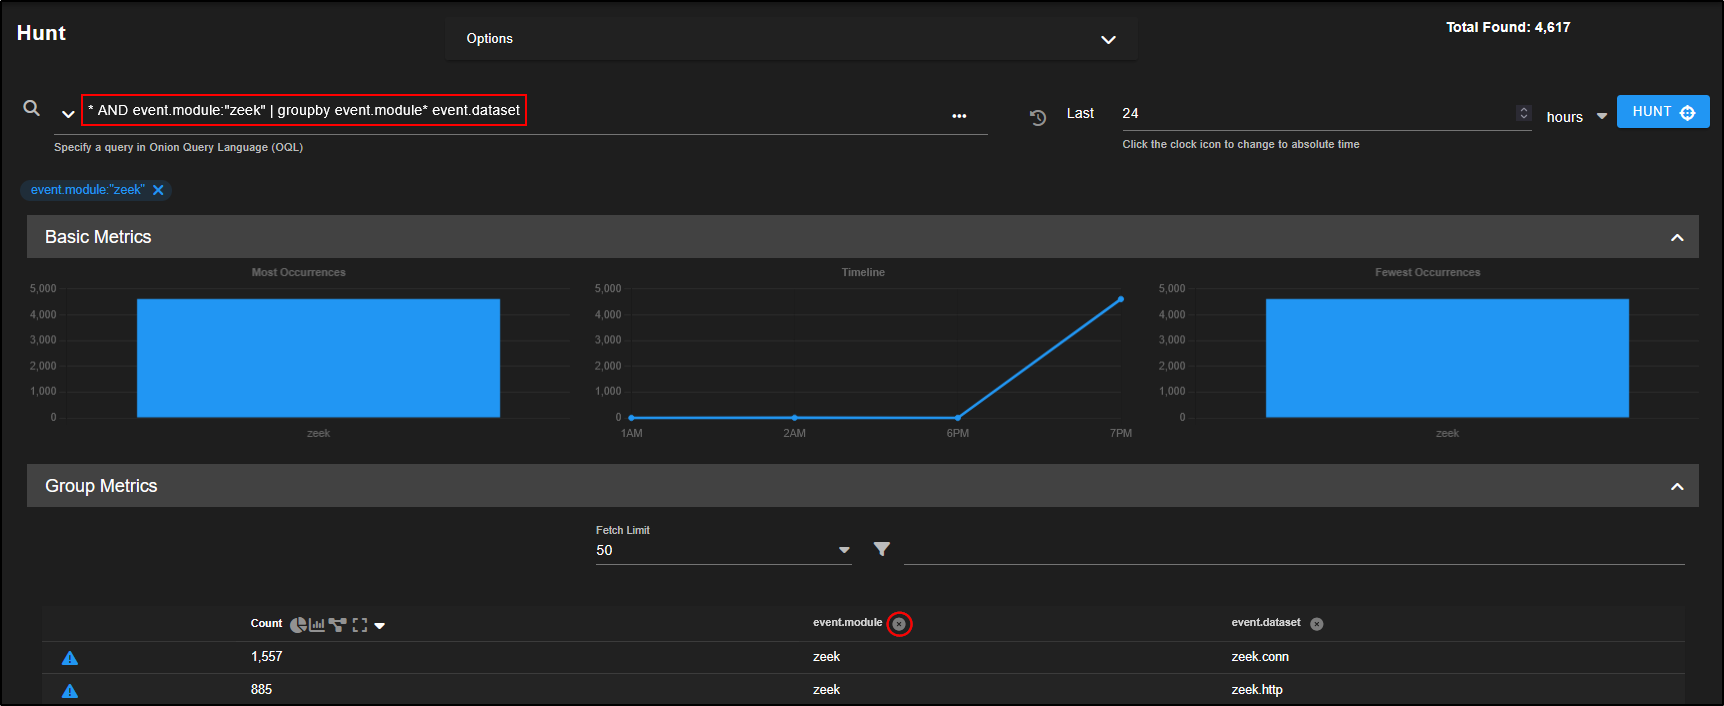
With the query now refined to only show Zeek logs grouped by dataset, we are ready to begin our threat hunt.
Our objective is to hunt for a suspicious or malicious HTTP traffic.
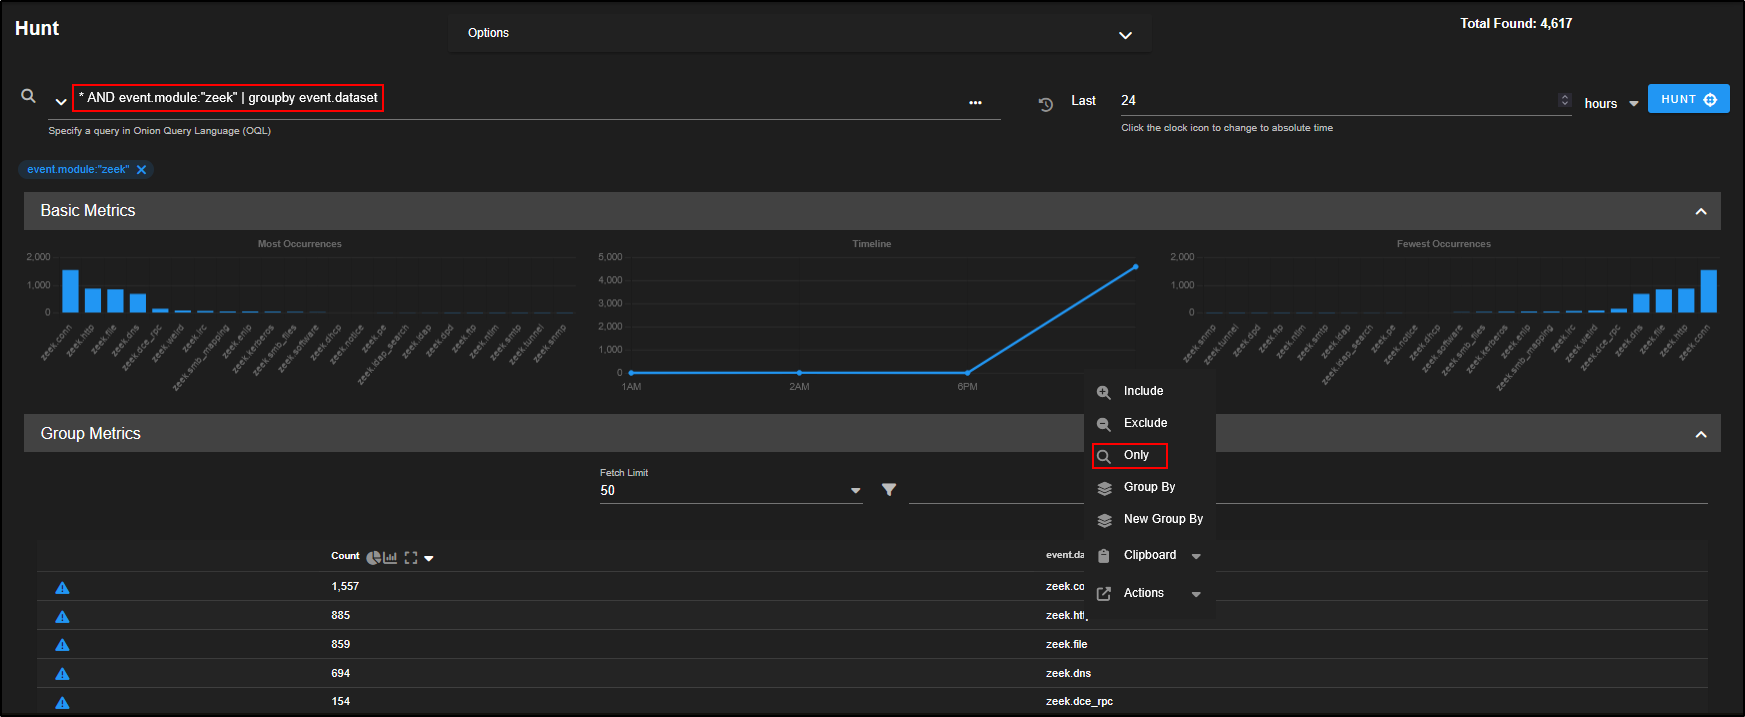
To begin:
- Locate the
zeek.httpdataset in the Group Metrics pane. - Click on it and choose Only.
This filters the view to show just HTTP traffic parsed by Zeek, which includes helpful metadata like destination port, host, URI, and user-agent which is perfect for spotting suspicious patterns.
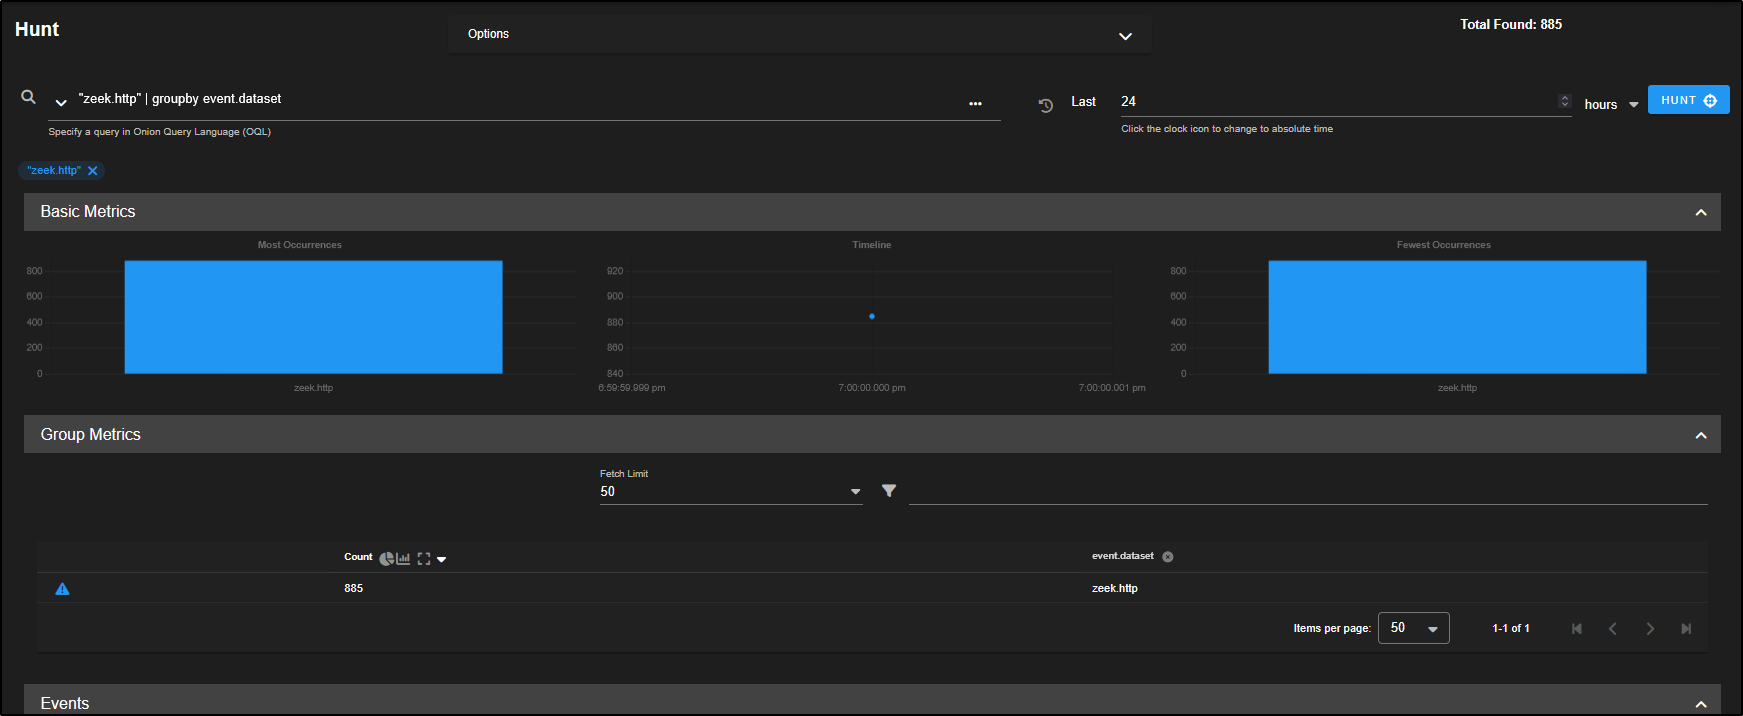
As shown by the Group Metrics, we are now looking at 885 zeek.http records.
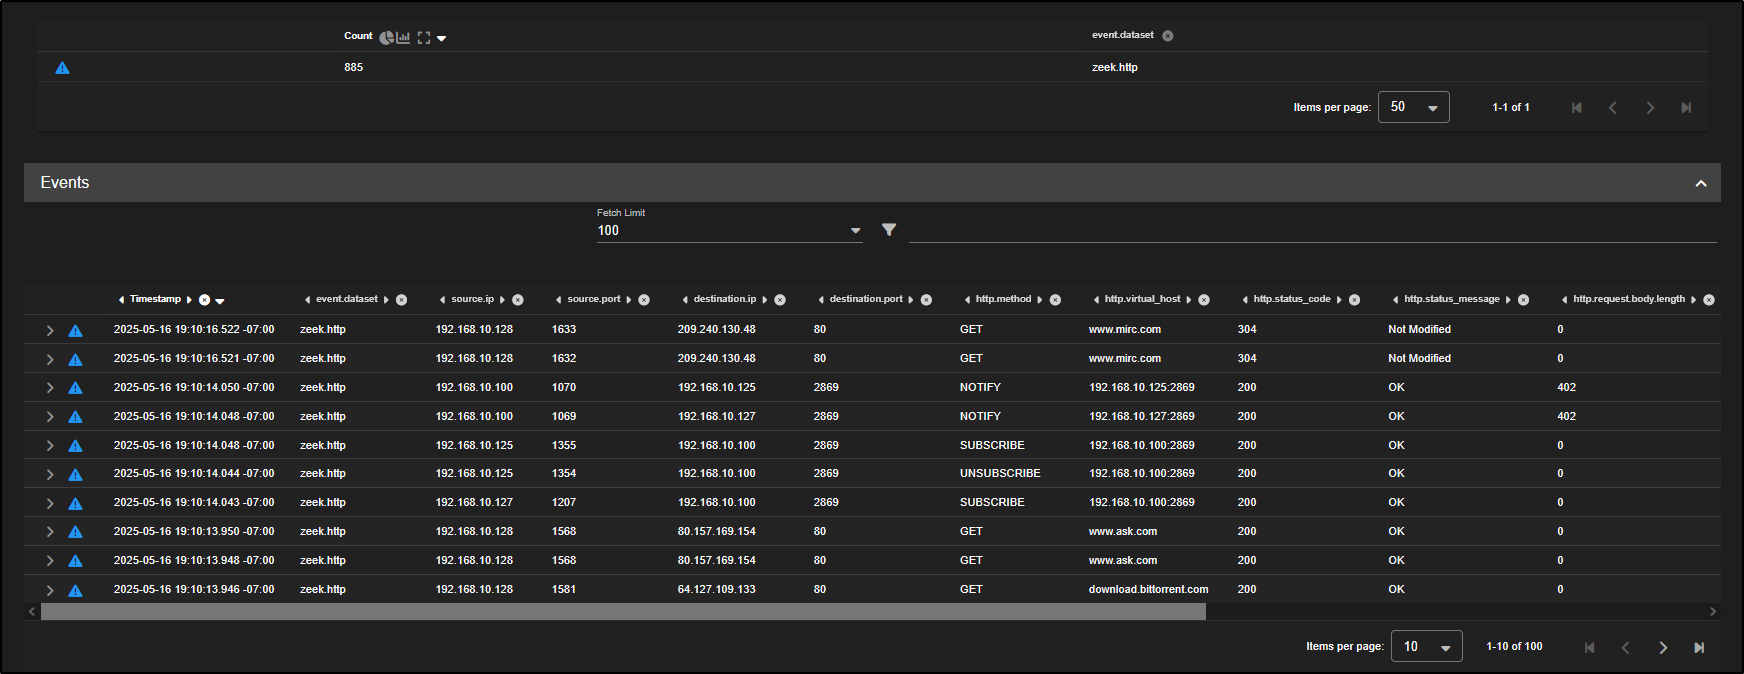
Scrolling down, we can see the list of individual events.
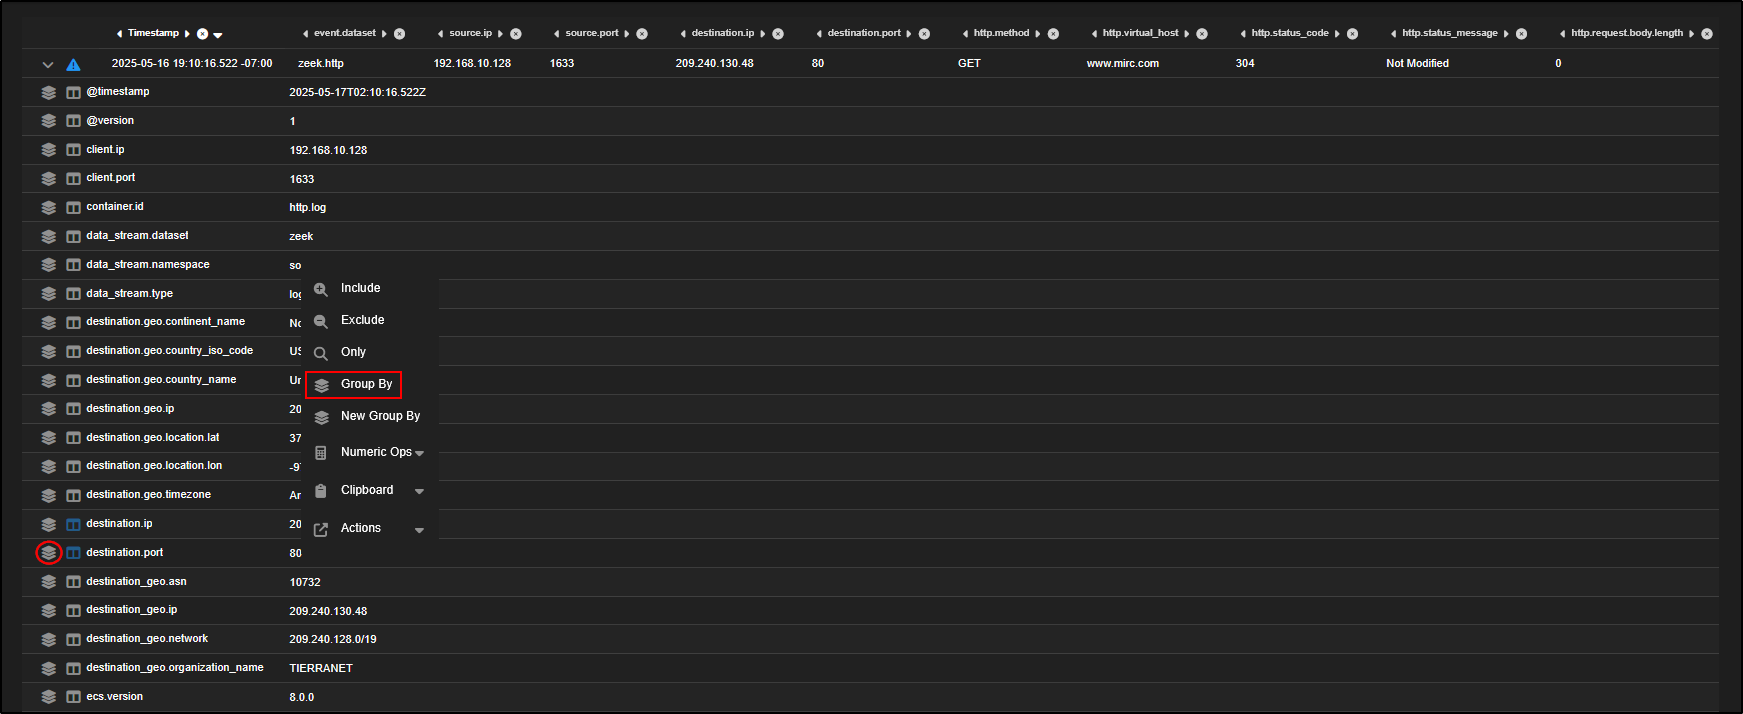
To dig deeper into the events, you can expand any individual log entry for more detail.
Every field in the event can be used as a pivot point or to refine your view. For example:
- To group HTTP logs by destination port, click on the
destination.portfield and select Group By. - Alternatively, click the stacked paper icon next to the field.
Here is the difference:
- Group By: Adds the field to your current table, refining the existing groupings.
- New Group By: Creates a separate table with the new grouping applied, keeping the original intact.
Now that we have grouped the HTTP logs by destination port, we can see they fall into four distinct buckets. While some use the standard port 80, others are going to non-standard ports like 2869.
To cross-reference this with known alerts:
- Open the Alerts tab in a new browser tab.
- Drill down into the alert titled ET MALWARE Zbot POST Request to C2.
From there, you will see that port 80 is indeed linked to command-and-control (C2) HTTP traffic, confirming its relevance to our investigation.
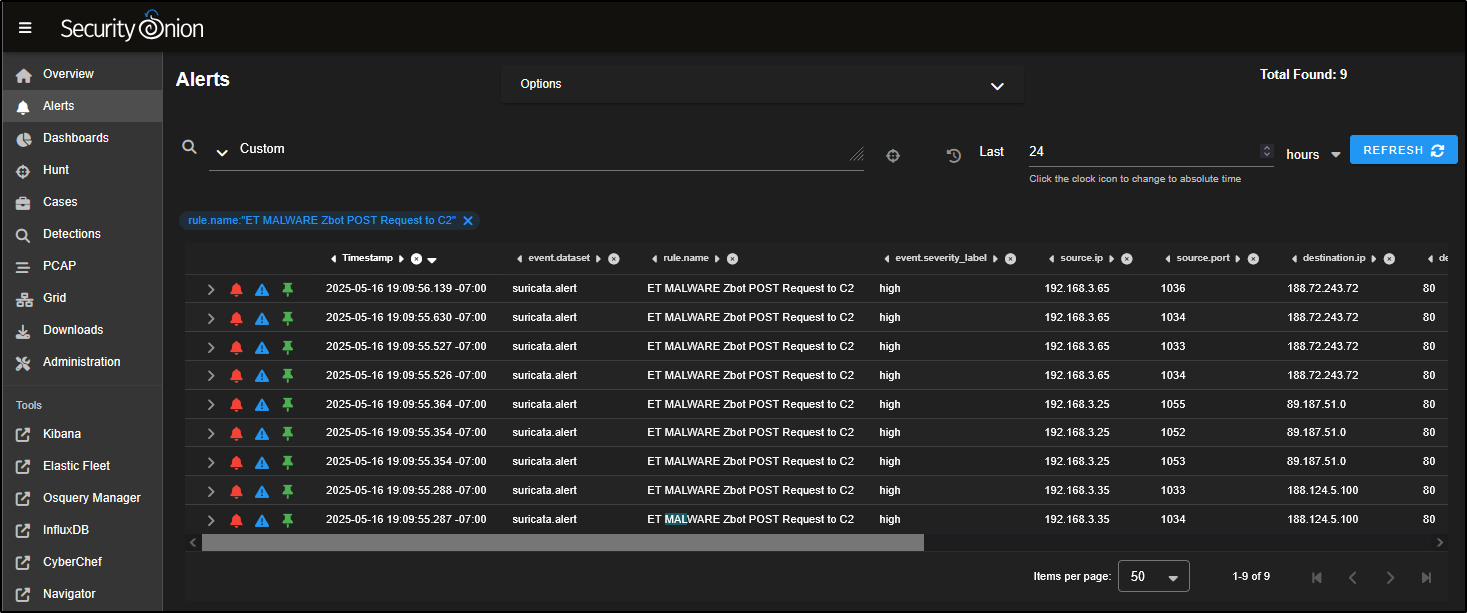
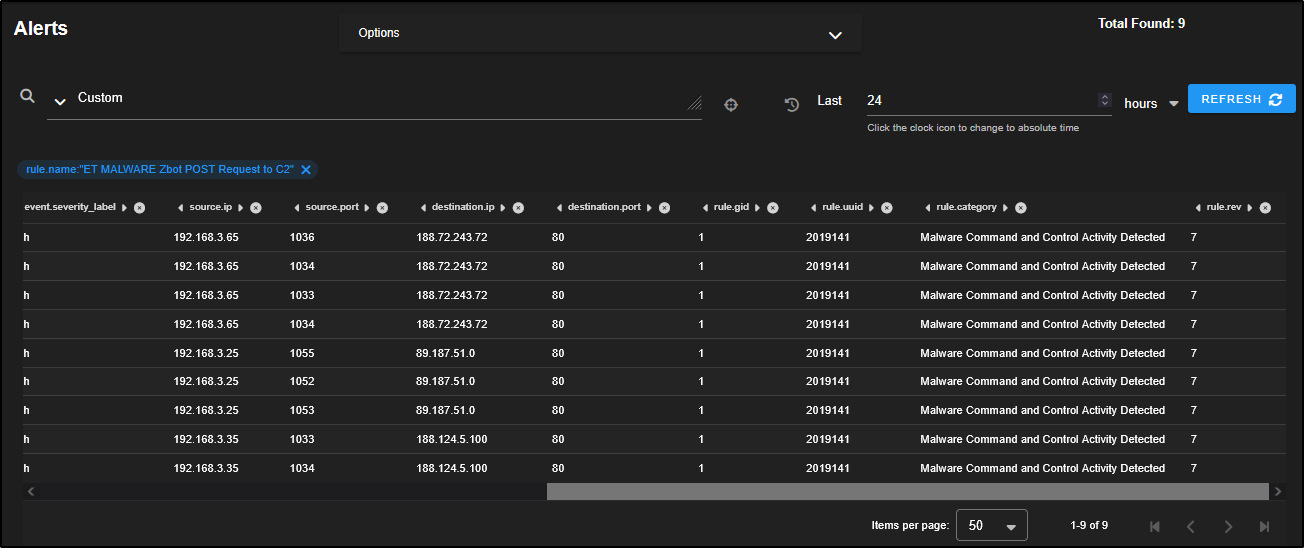
Back on the Hunt page, to focus specifically on HTTP traffic using port 80 (which we now know is linked to malicious activity):
- Click on the
destination.portvalue 80 in the table. - Select Include.
This filters your results to show only HTTP traffic on port 80 helping narrow your investigation to flows potentially related to Zbot C2 or similar threats.
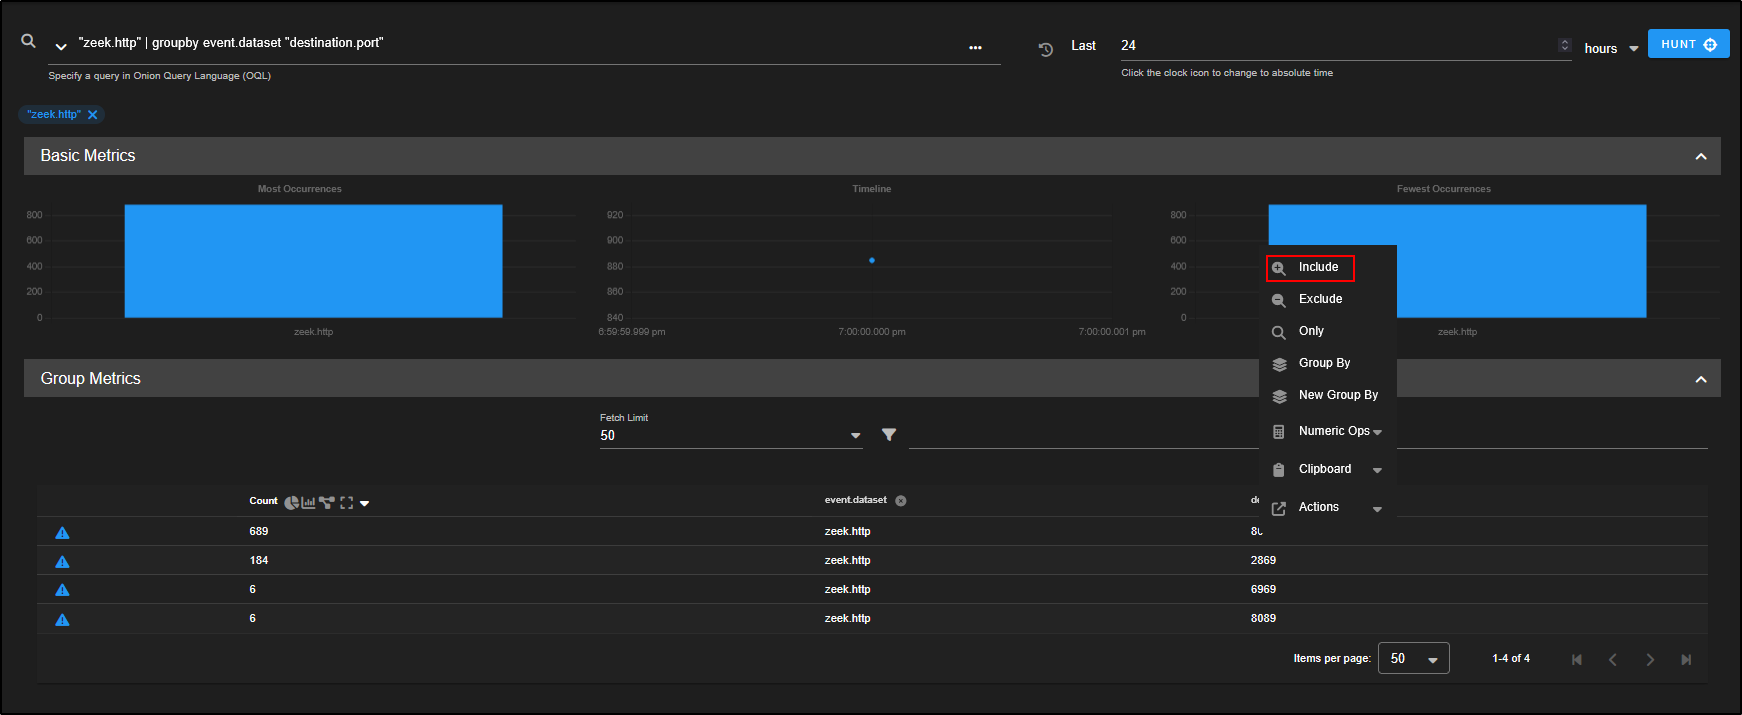
Your query now reads zeek.http AND destination.port: 80.
This means you are filtering for only Zeek HTTP logs where the destination port is 80 so your results should now be limited to standard HTTP traffic, including any potentially malicious connections using that port (like the Zbot C2 we saw earlier).
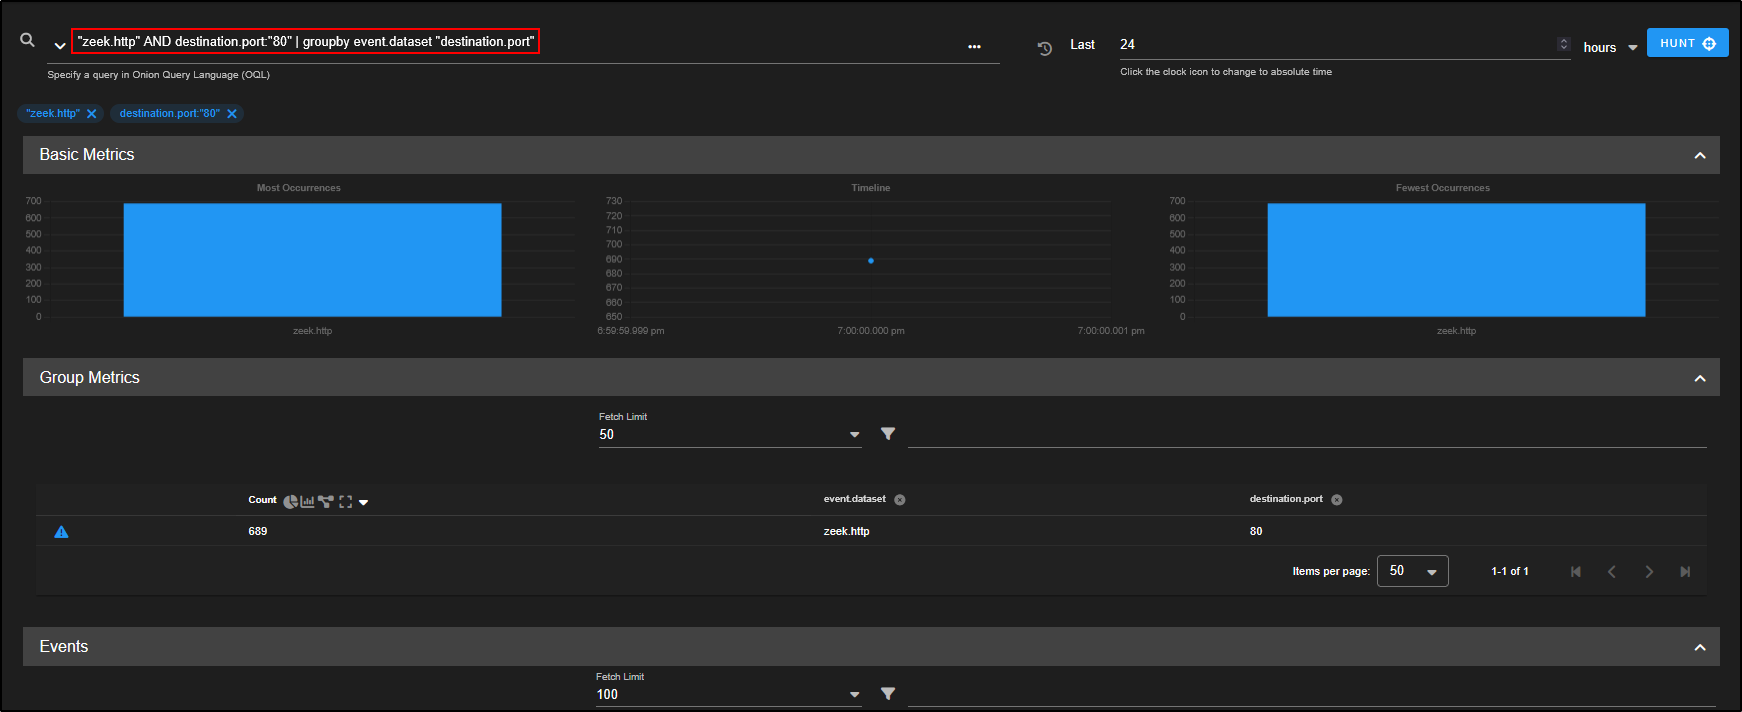
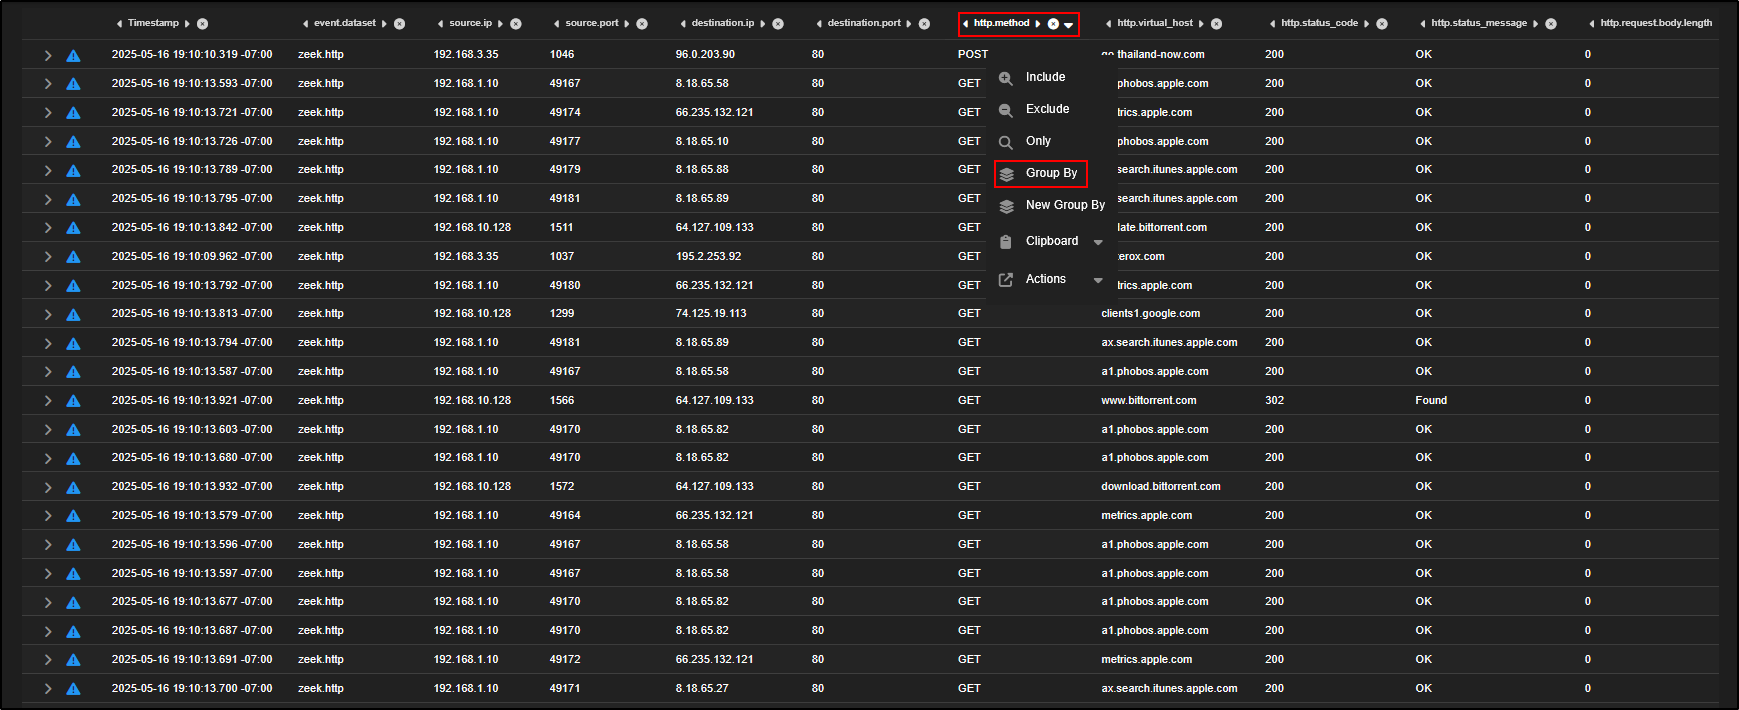
As you scroll through the filtered results, you will notice plenty of GET requests and a few POST requests.
Since the Zbot C2 alert flagged POST requests as suspicious, let’s focus on those:
- Click on the
http.methodfield where it shows POST. - Select Group By.
This will group your data by HTTP method, allowing you to isolate and analyse the POST requests more easily which are often associated with data exfiltration or C2 communication.
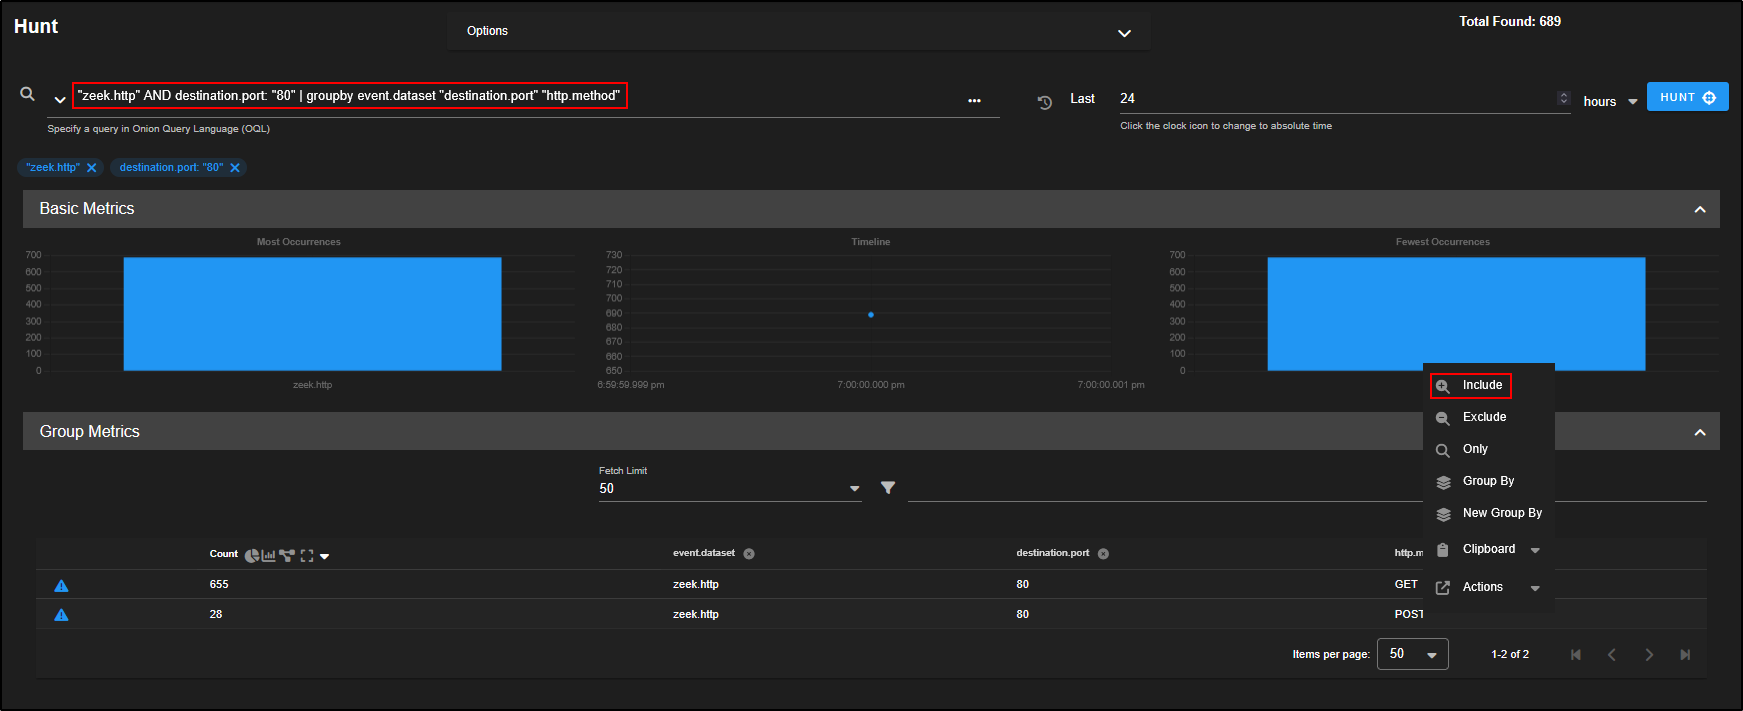
To focus on the POST requests, click on POST and select Include.
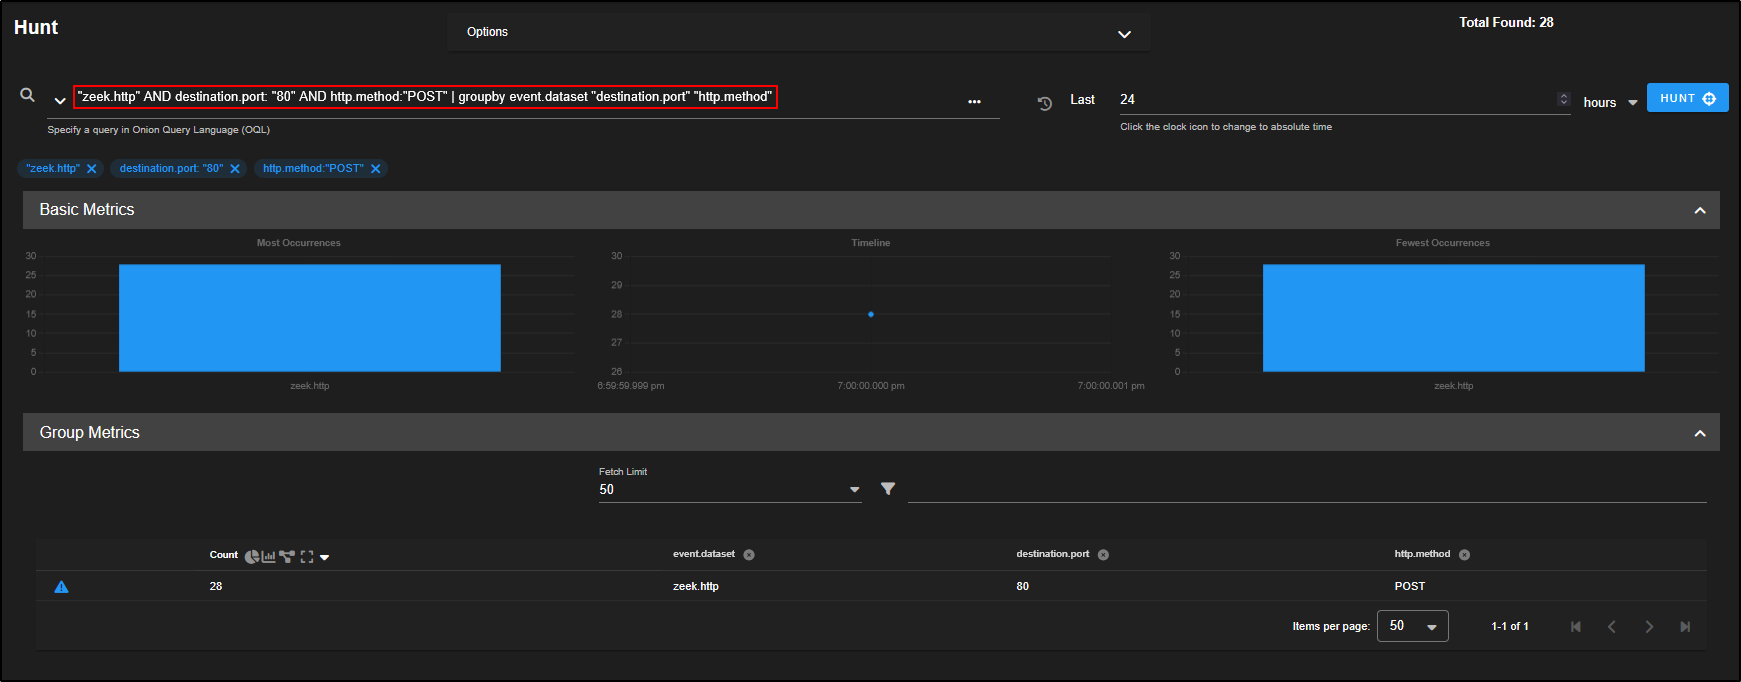
We can now see zeek.http requests using POST http method.
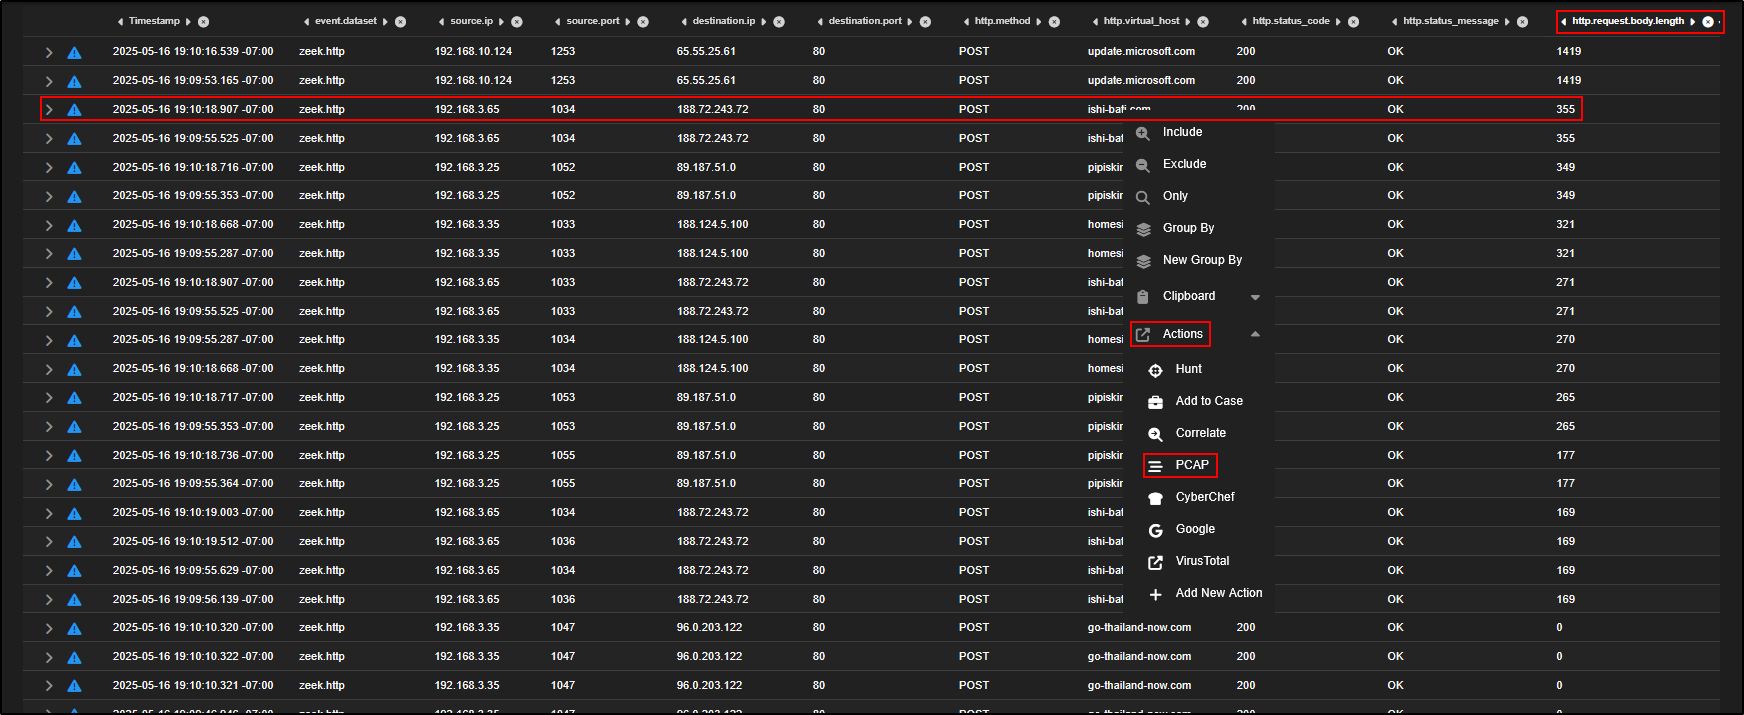
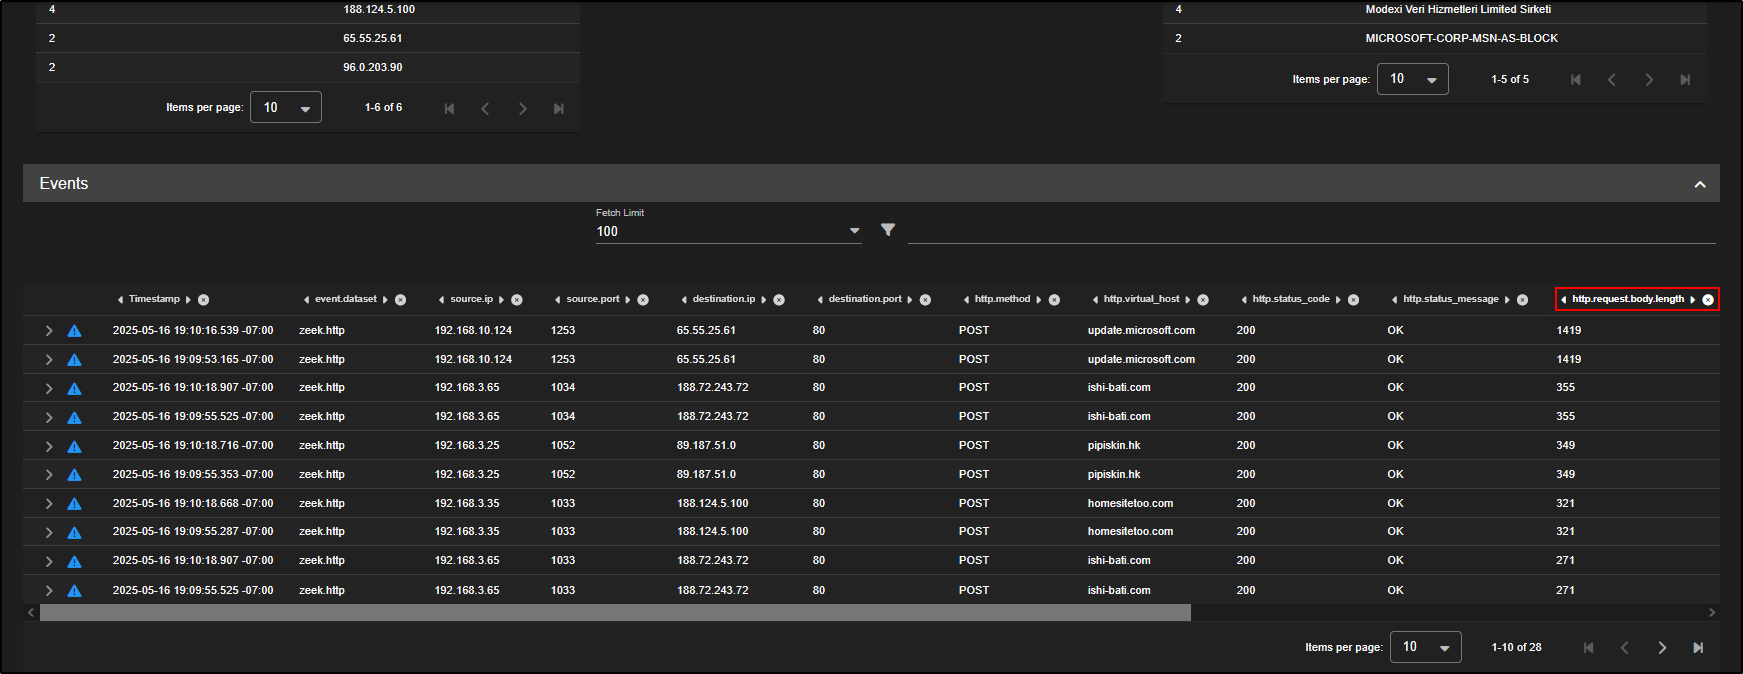
As you scroll down, you will now spot the same source IPs that were identified in the alert:
192.168.3.25, 192.168.3.35, and 192.168.3.65 which is a strong indication of a match.
To investigate further:
- Click on the
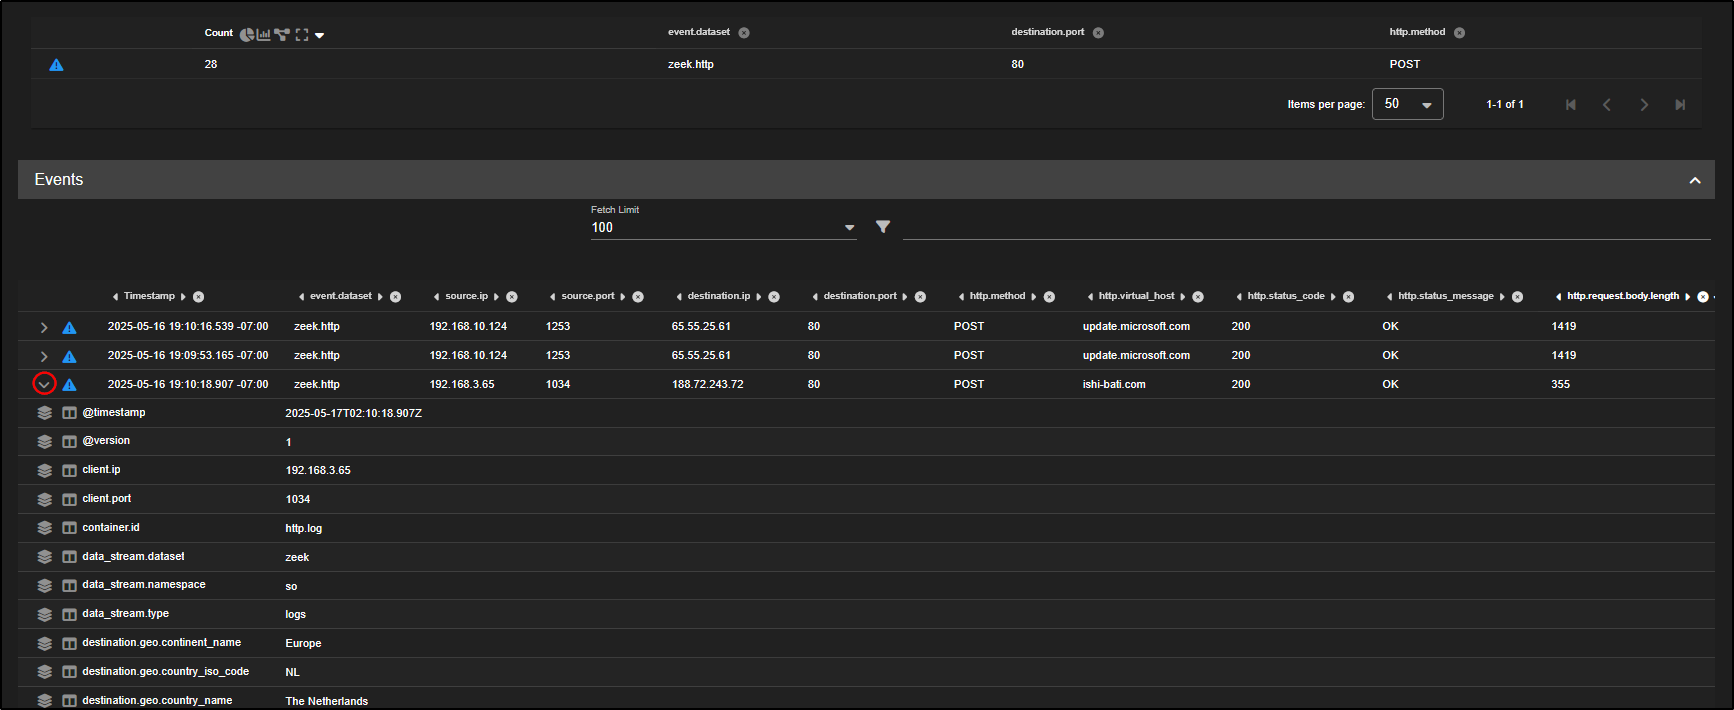
http.request.body.lengthcolumn header to sort the events by payload size. This helps surface larger POST requests which may contain encoded or exfiltrated data. - Find the first event from 192.168.3.65.
- Click Actions, then PCAP to open a packet capture view of that session.
This gives you a direct look at the traffic, making it easier to identify signs of malware communications like beaconing or data uploads.
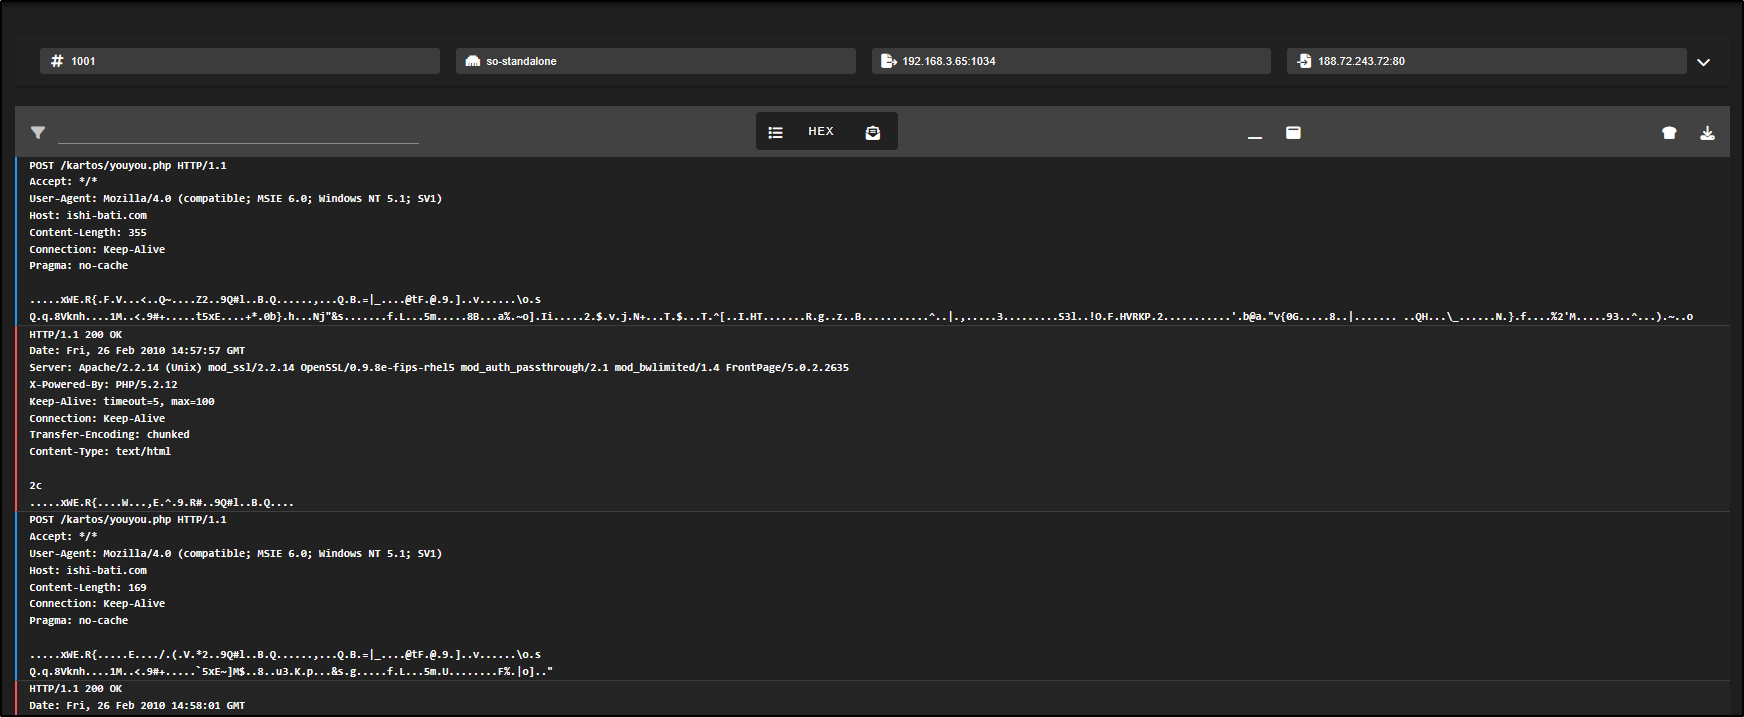
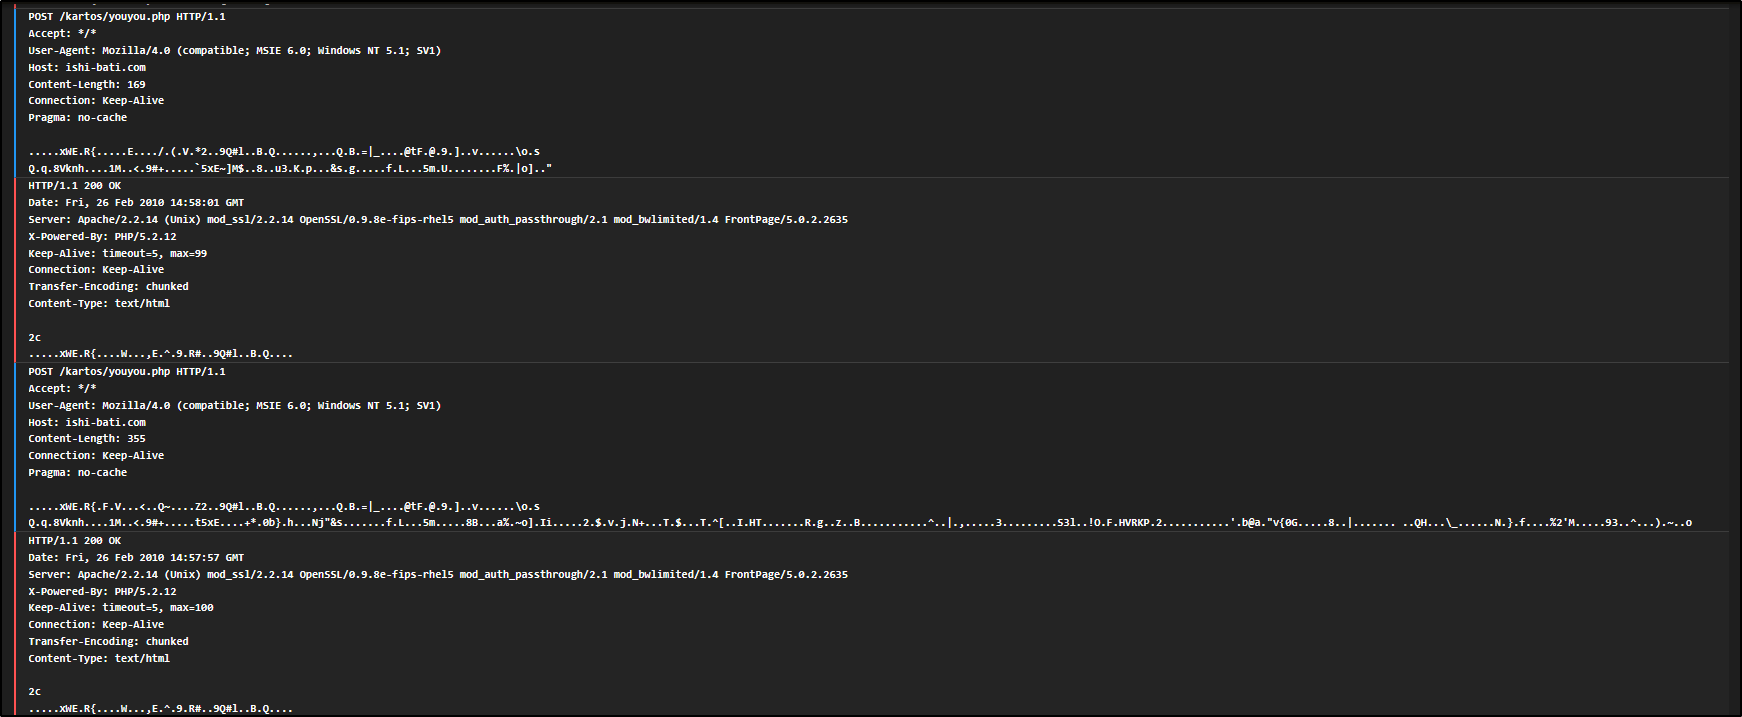
This is a typical example of beaconing behaviour, where an infected system is quietly reaching out to a remote server to check for instructions. We can tell because we are seeing repeated, identical HTTP POST requests being sent to the same URL (youyou.php).
Each of these requests contains encoded binary data, likely being sent to a command-and-control (C2) server. The fact that the requests are structured the same way and sent at regular intervals strongly suggests they are automated, not made by a person using a web browser, but by malware or a background script.
If we go back to the Hunt page and expand one of the logs, we will see a field called log.id.uid. This is an internal ID used by Zeek to link together multiple logs from the same network flow like connection records, HTTP logs, and file transfers, making it easier to follow the full picture of what happened.
There is also a field called network.community_id. This is a unique hash made up of the source and destination IP addresses, ports, and protocol. It helps analysts correlate related events across tools like Zeek, Sysmon, firewall logs, or Elastic Agent data.
To see all related logs for this HTTP event, just click the network.community_id field and choose Actions → Correlate. This will bring up all events tied to that same flow for deeper investigation.
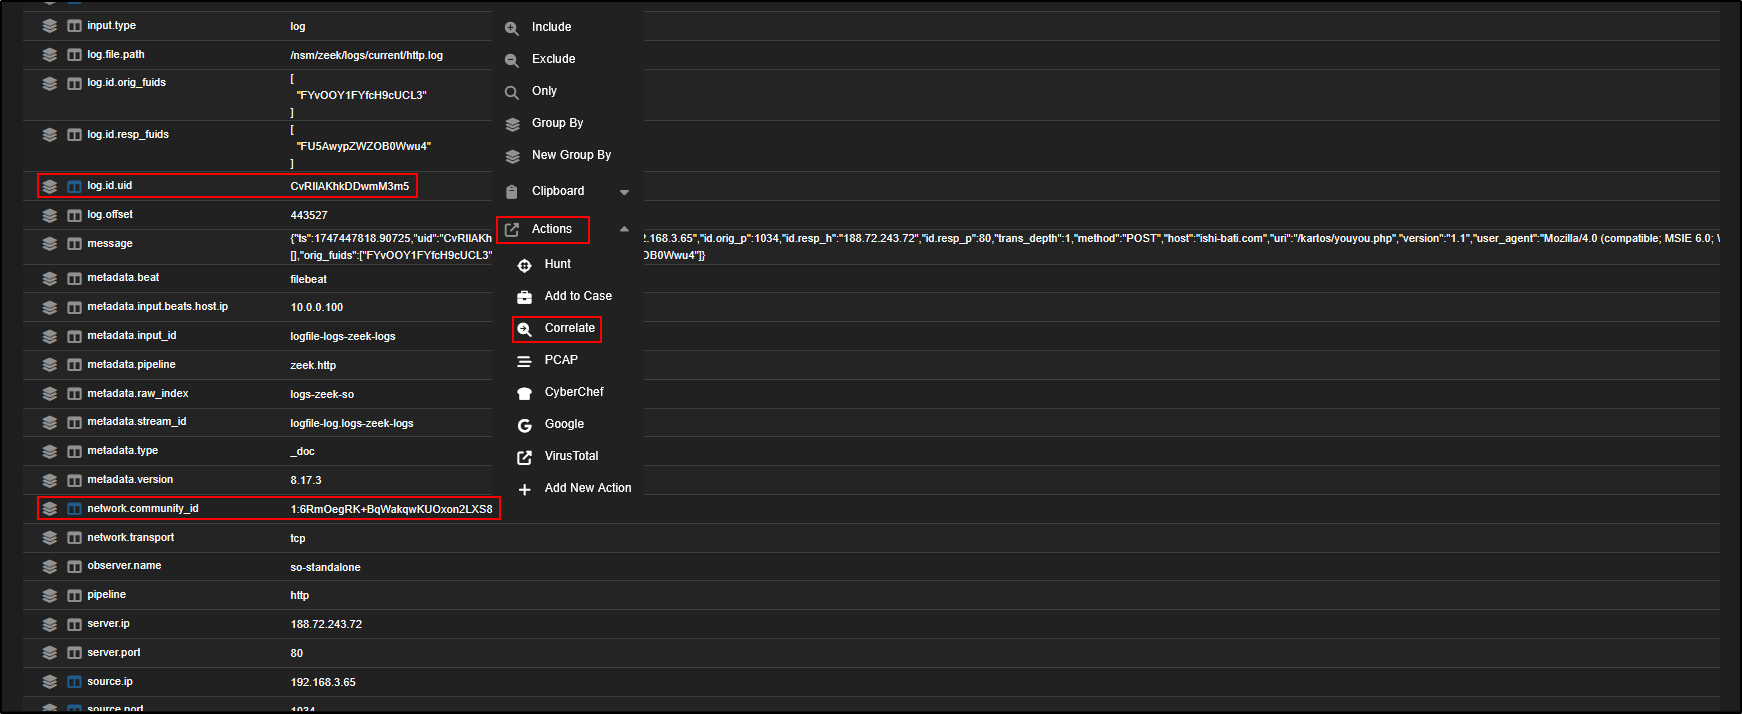
This opens a new Hunt window with an OR query that includes both the log ID and the community ID from the selected HTTP event.
This query pulls in all related data so you can now view everything Security Onion has recorded about that flow, across different sources, all within the tables and visualisations on this page.
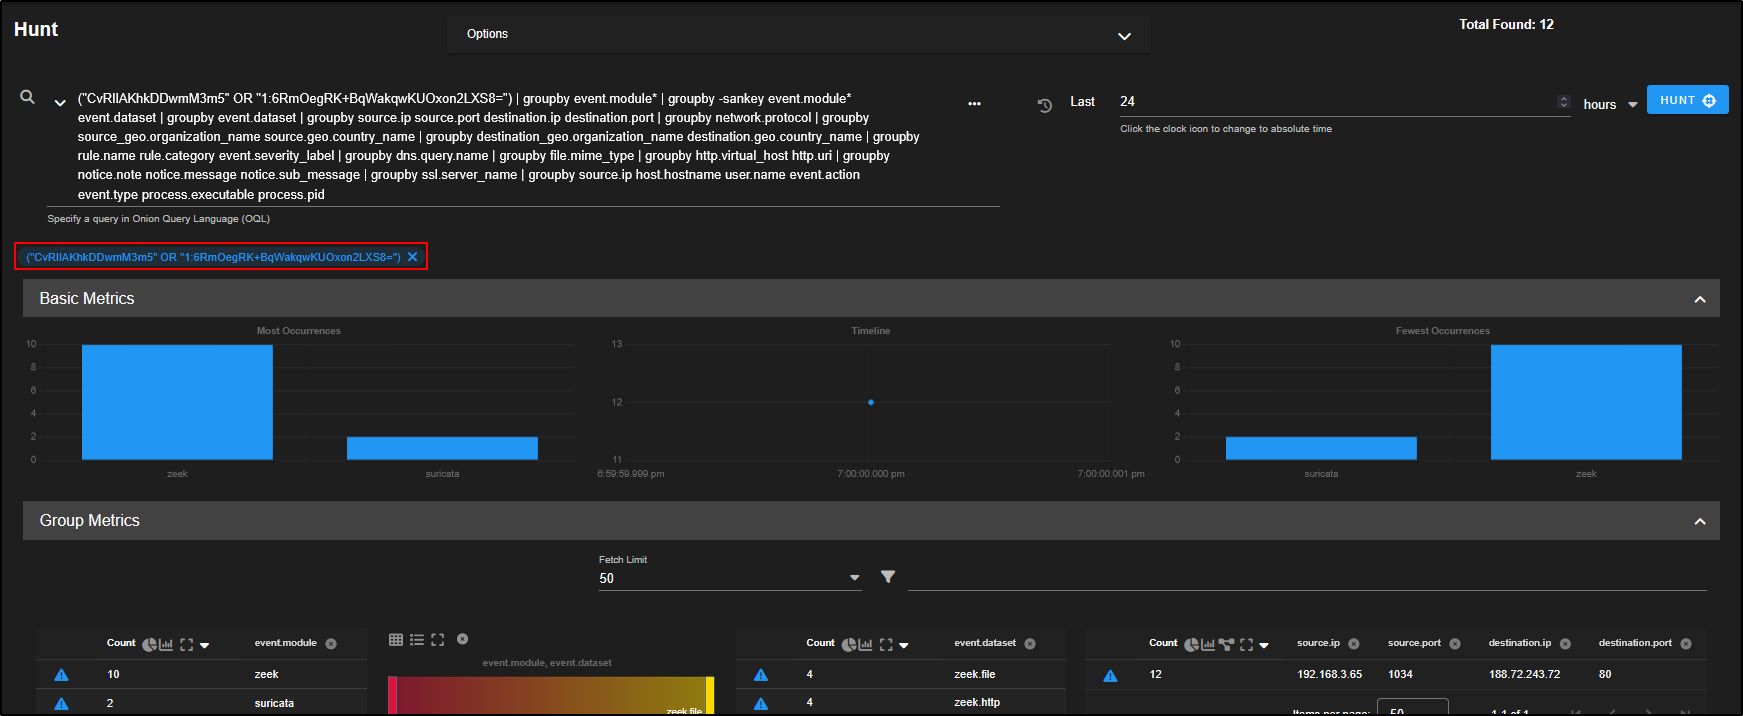
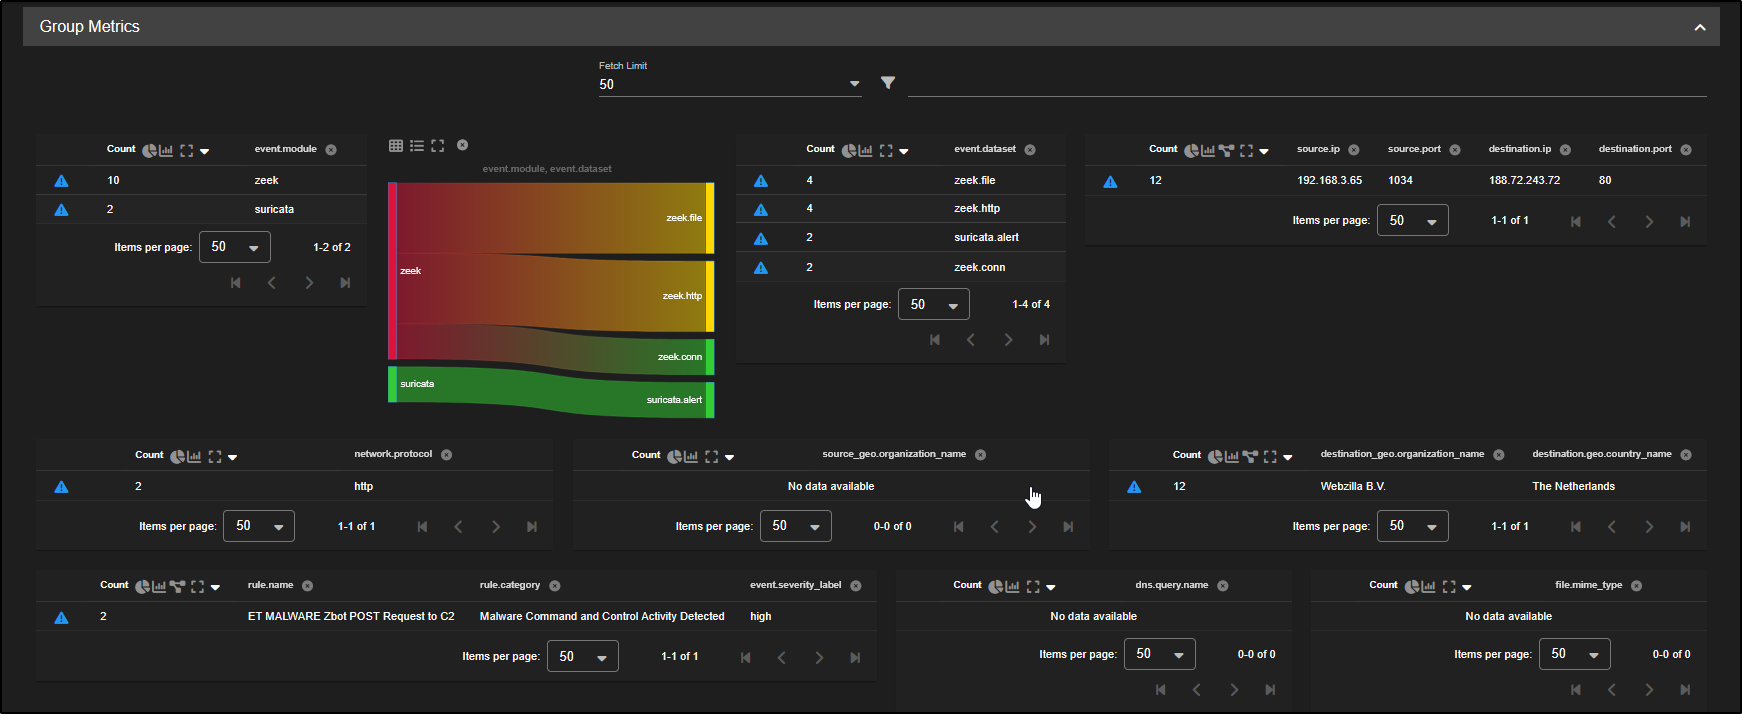
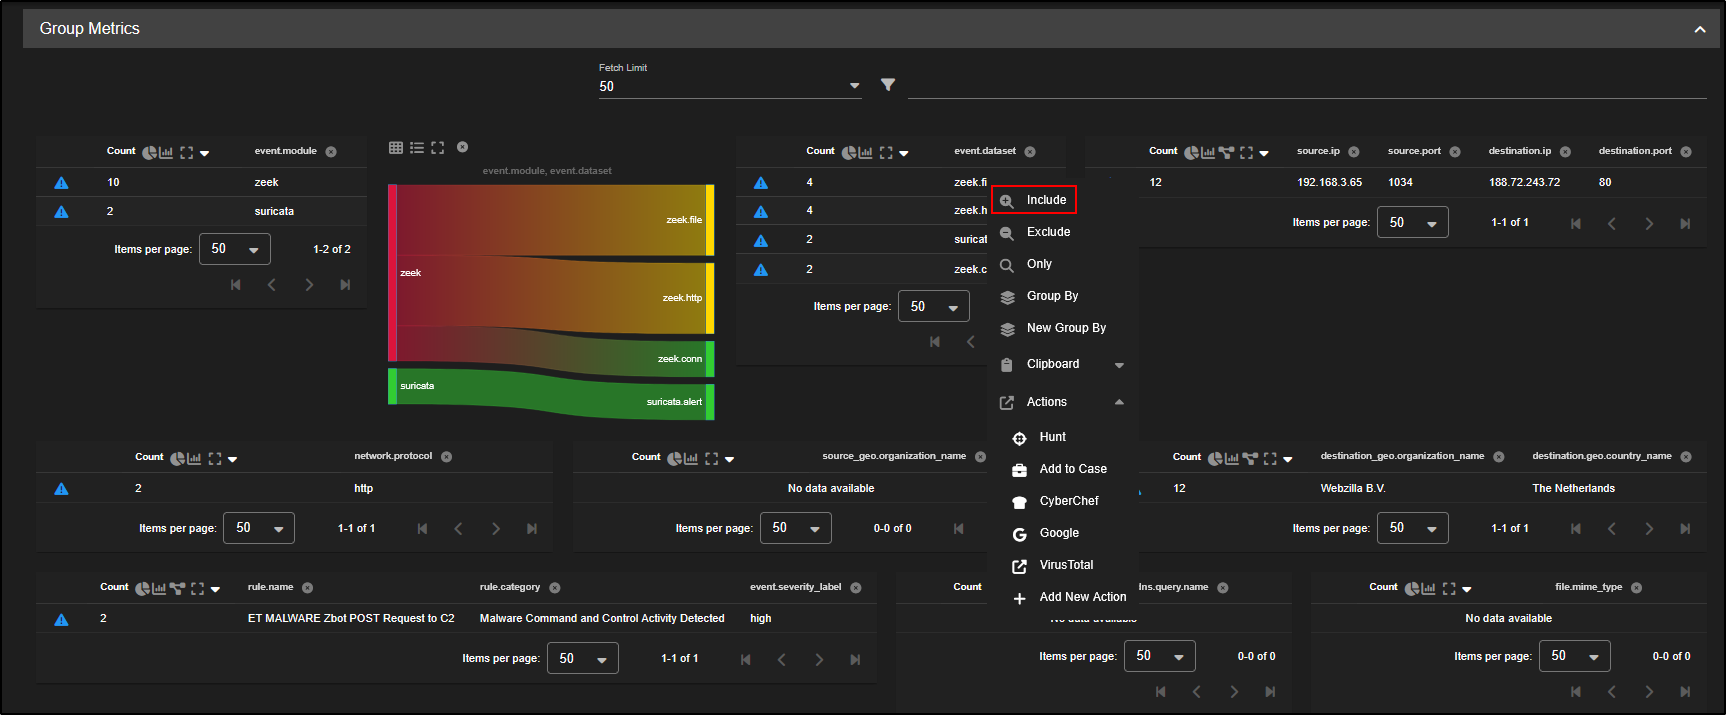
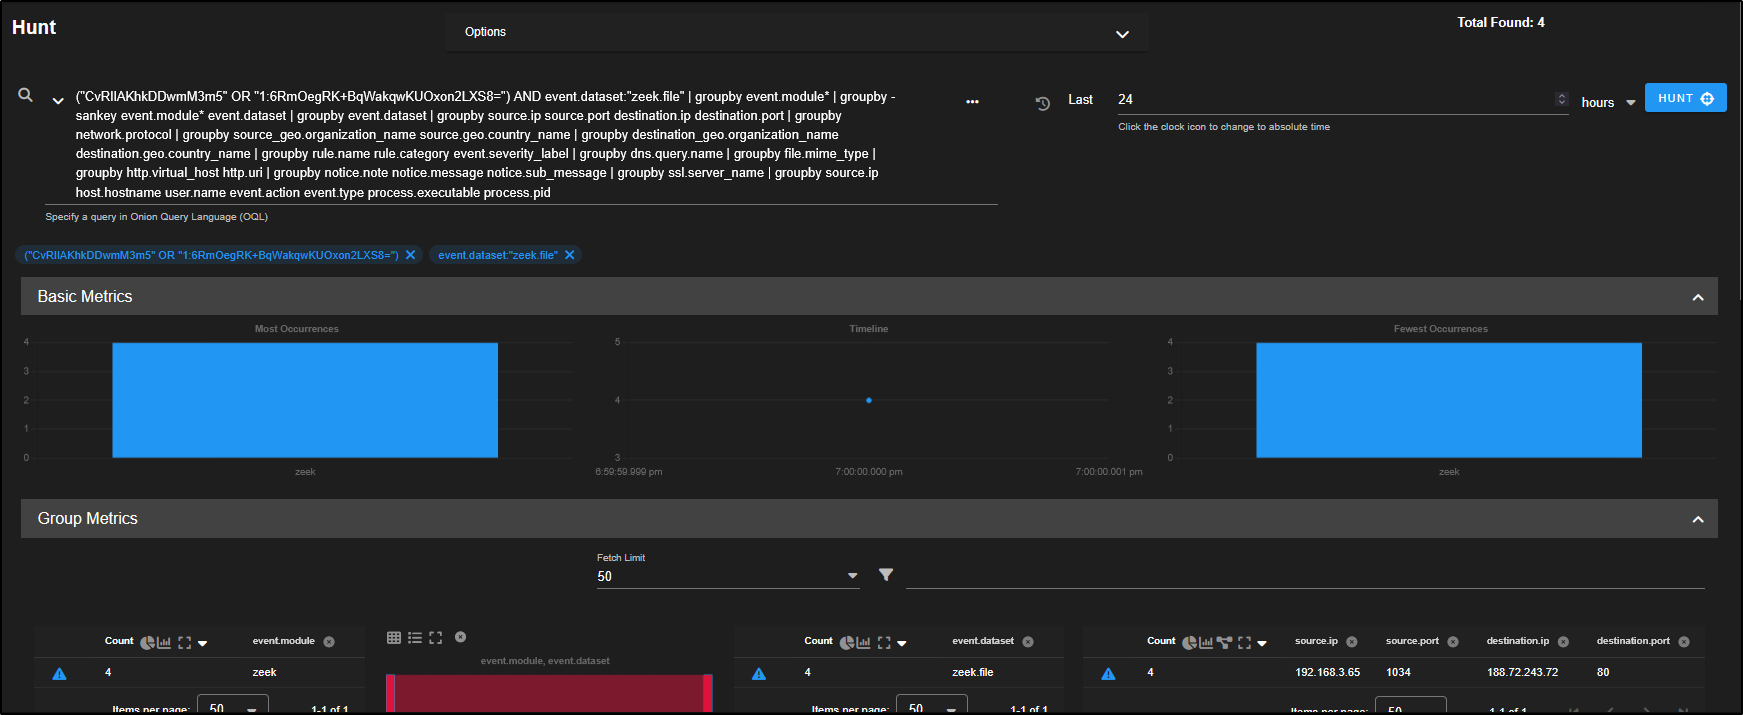
We can focus on the zeek file records by clicking on zeek.file and selecting Include.
As you scroll down, you will see the individual events tied to that network flow.
If these events occurred further along the attack chain, they may reveal what the attacker exfiltrated or accessed from your environment giving you insight into what data may have been compromised.
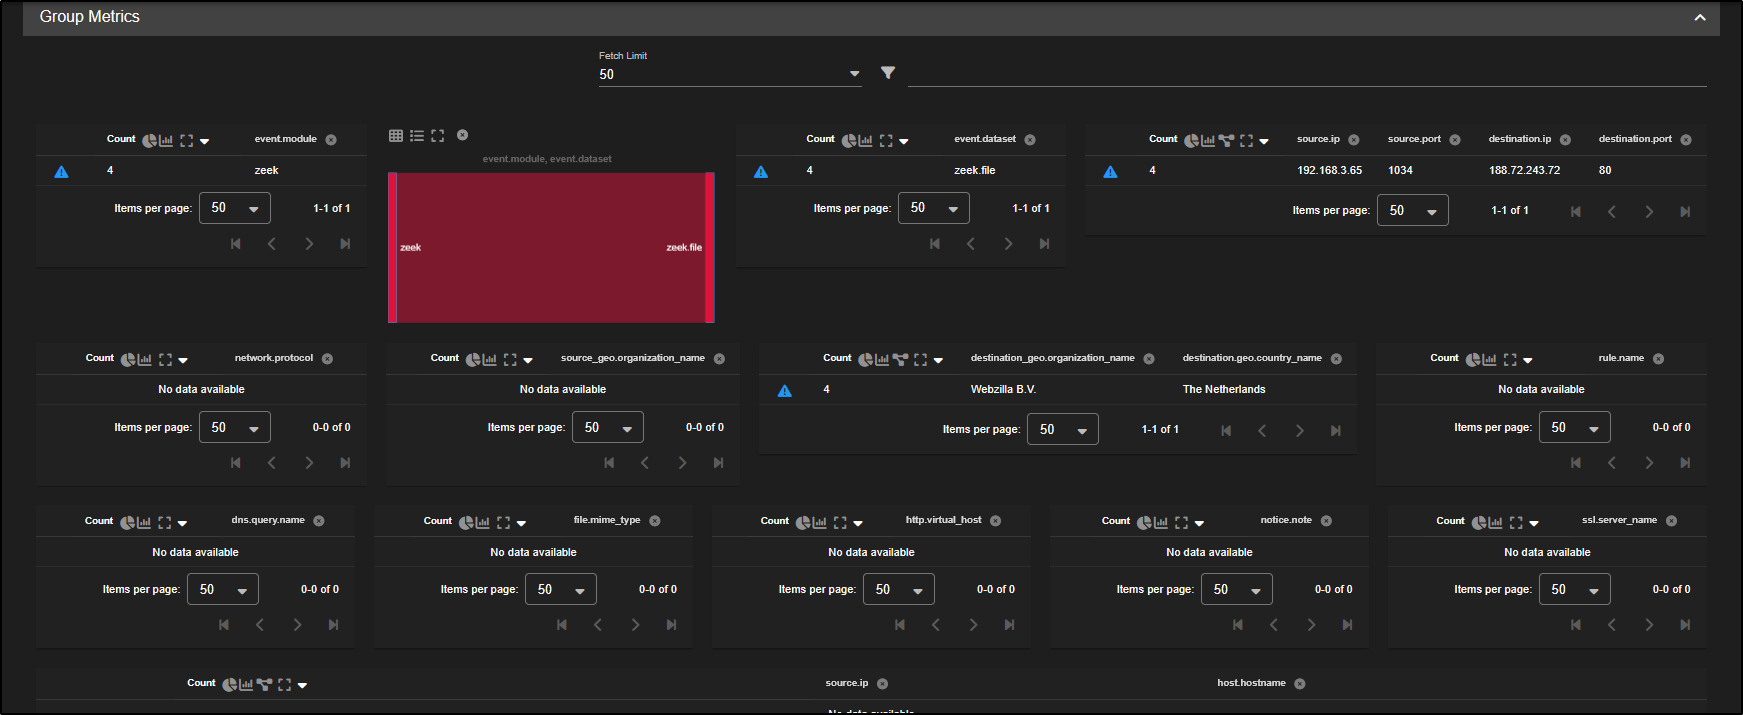
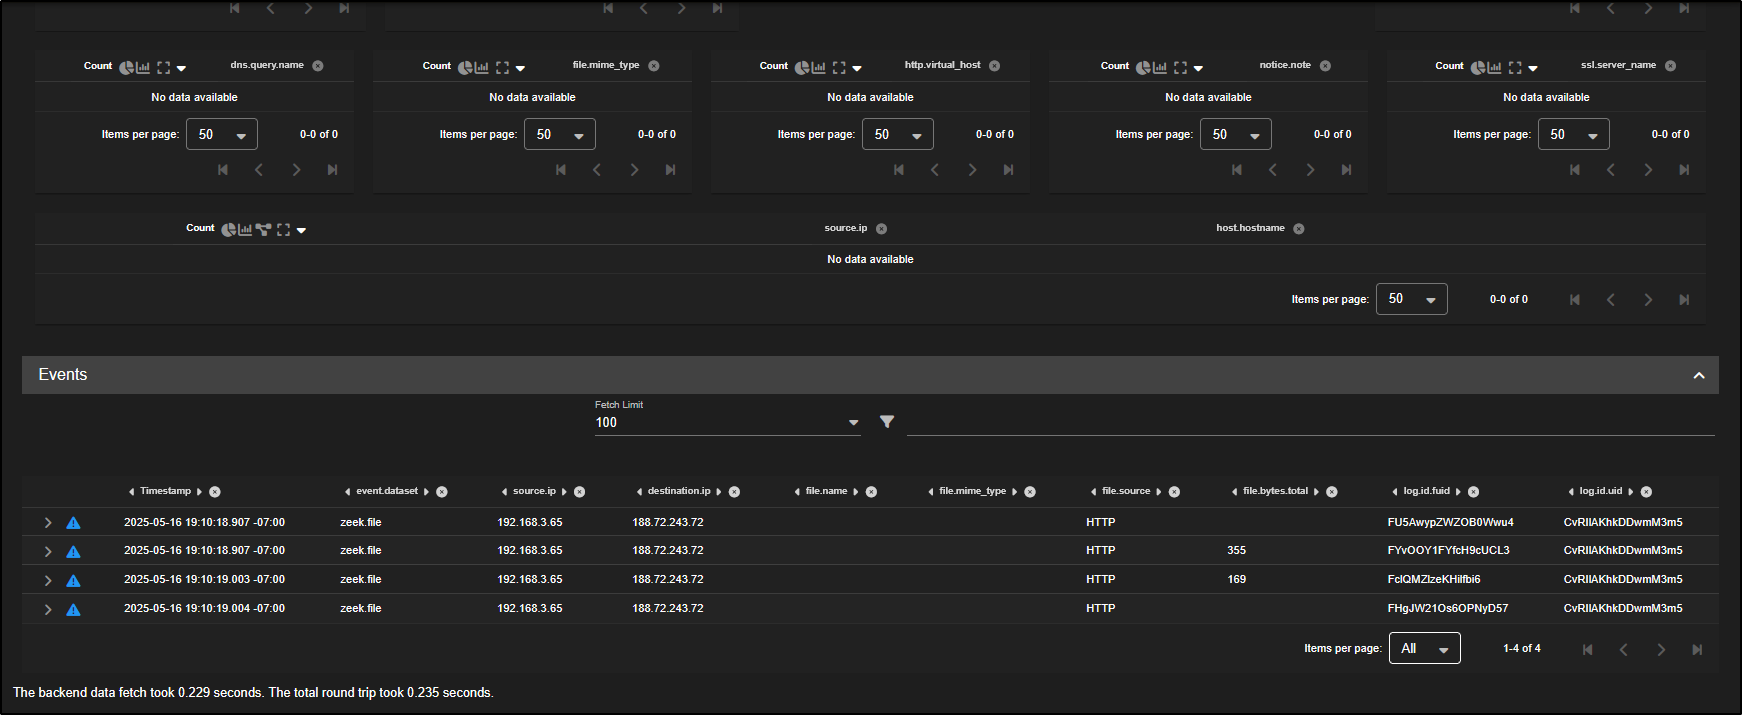
To work out where the initial infection came from, we will need to examine other Zeek file logs linked to the same system.
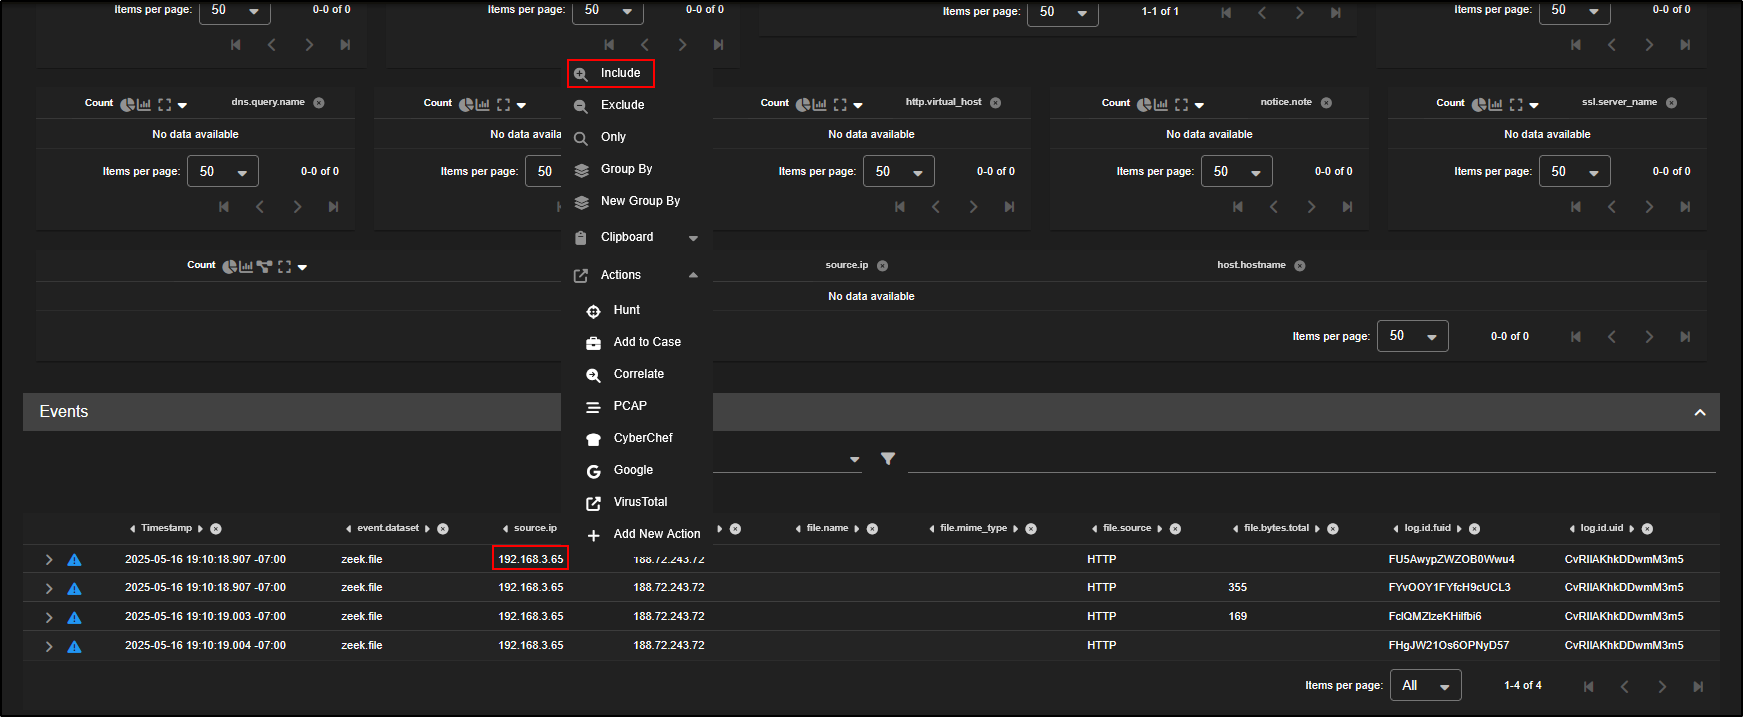
Click on the source IP address and choose Include. This filters the Hunt results to show only activity involving that particular host, helping you trace the infection’s origin.
Remove the community ID filters from your query. This allows you to see all network flows related to the selected source IP, not just the ones tied to a single session.
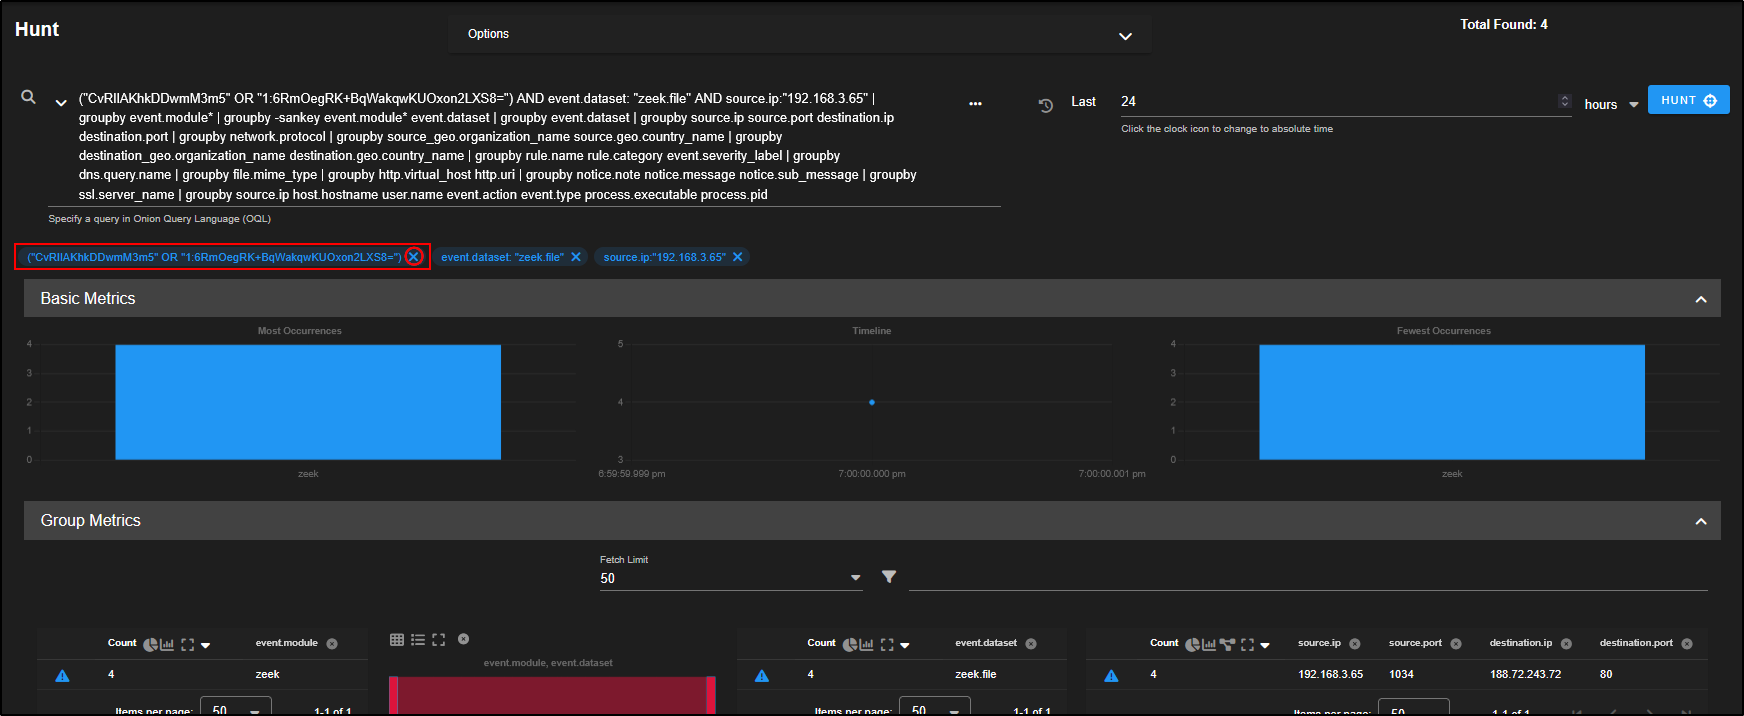
There are 22 different file records linked to the source IP 192.168.3.65, suggesting this host has been involved in multiple file transfers, which may include the original point of infection.
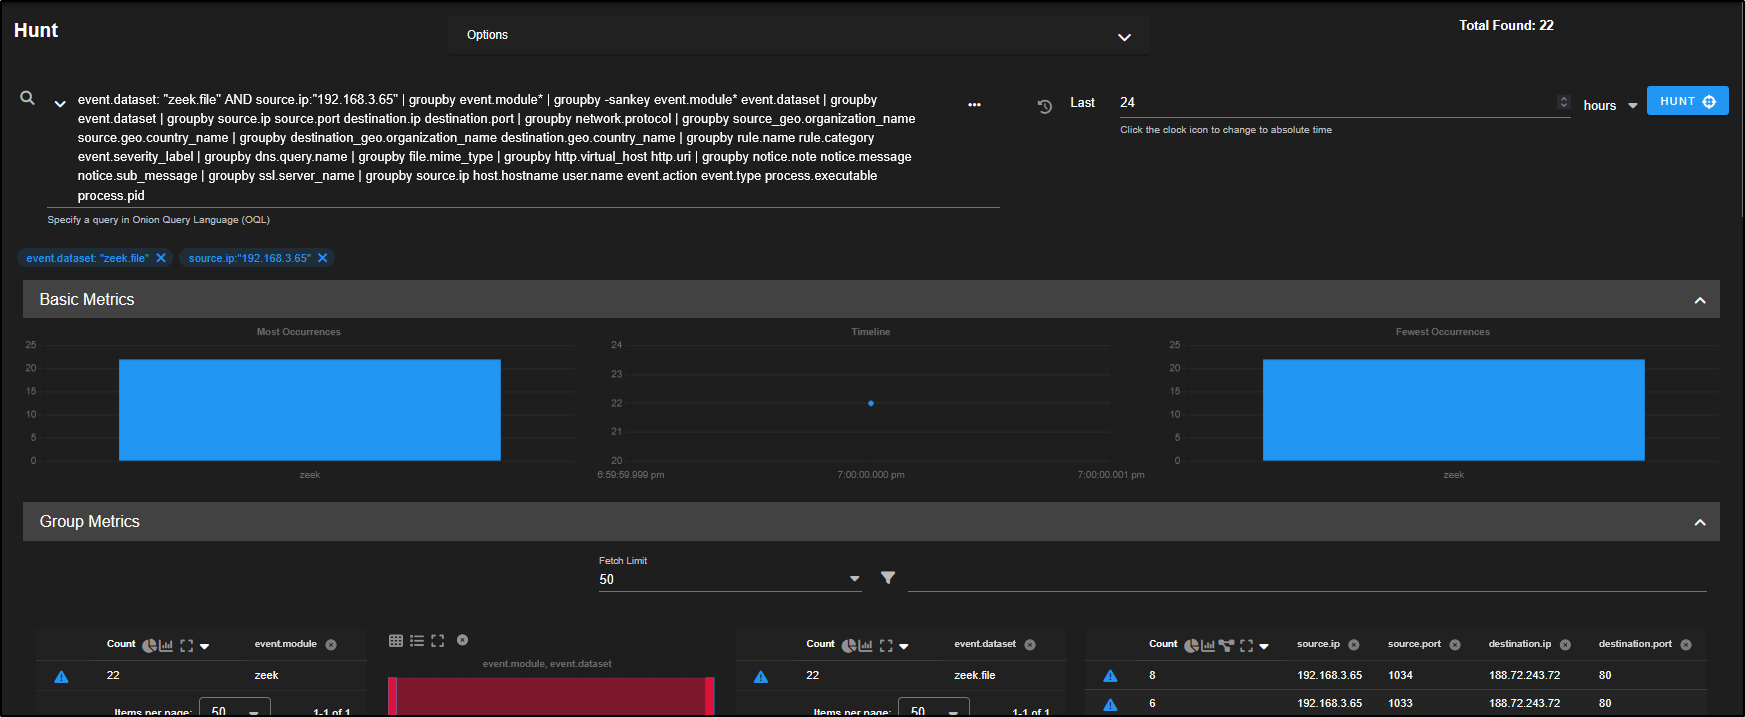
As we scroll down, we notice one file is a Windows DOS executable which is a potential indicator of a malicious payload or the initial infection file. This needs a closer inspection.
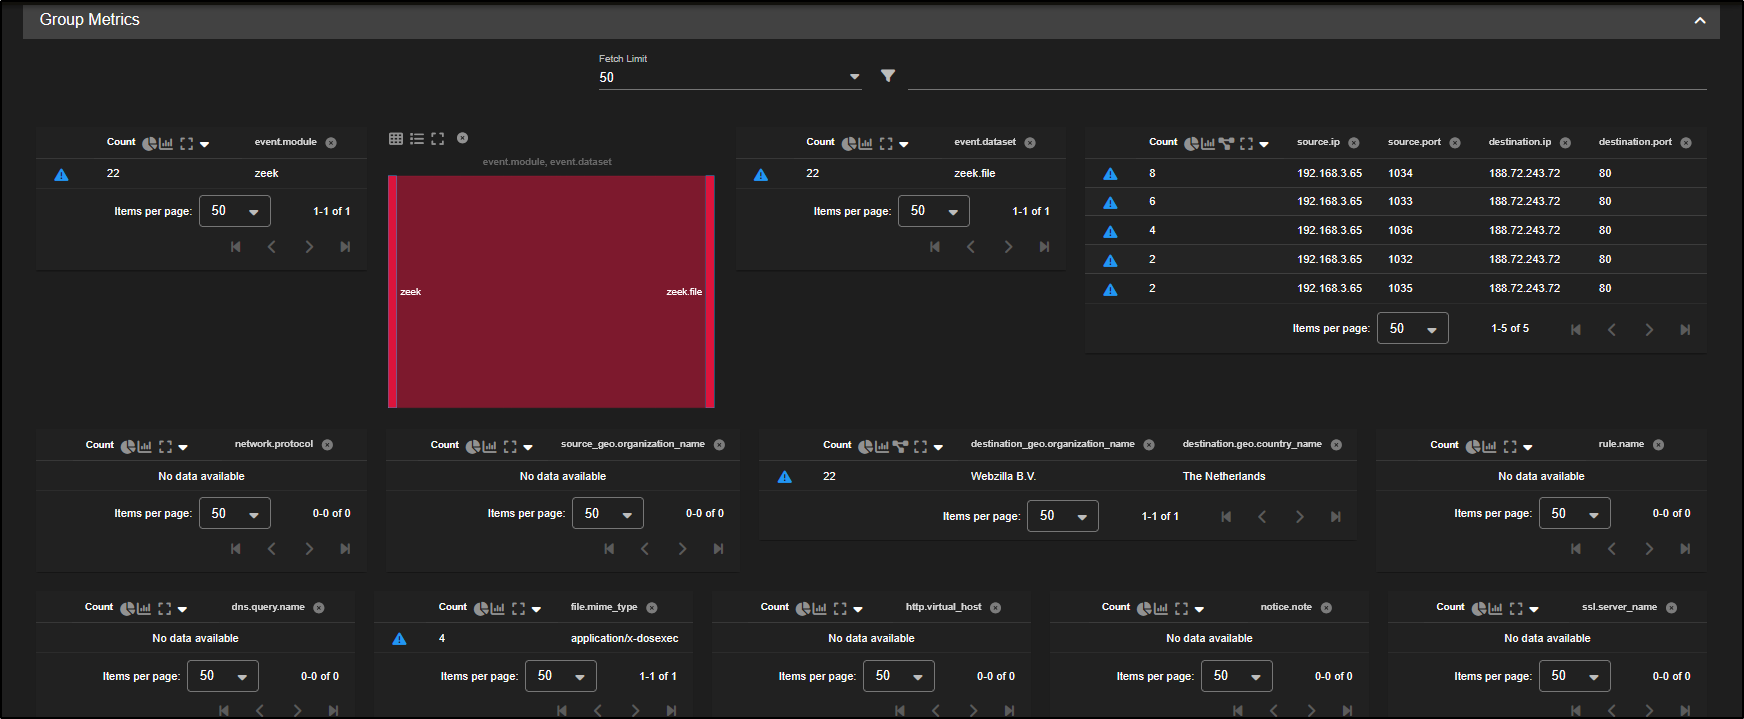
The next step is to extract the executable from the PCAP file to confirm whether it was the initial point of compromise. After that, you can hunt across your network to check if any other systems have downloaded or executed the same file.
The Hunt interface is designed for analysts to quickly explore and interpret collected data, allowing you to summarise patterns, compare records, and pivot between different log sources during an investigation.
The Dashboards feature offers similar functionality but with a wide range of prebuilt visualisations for specific use cases.
To get started, go to the Dashboards tab in the SOC web interface.
The default view gives a high-level summary of all data within Security Onion, presented through SANCII diagrams, bar charts, pie graphs, and tables that break down each dataset.
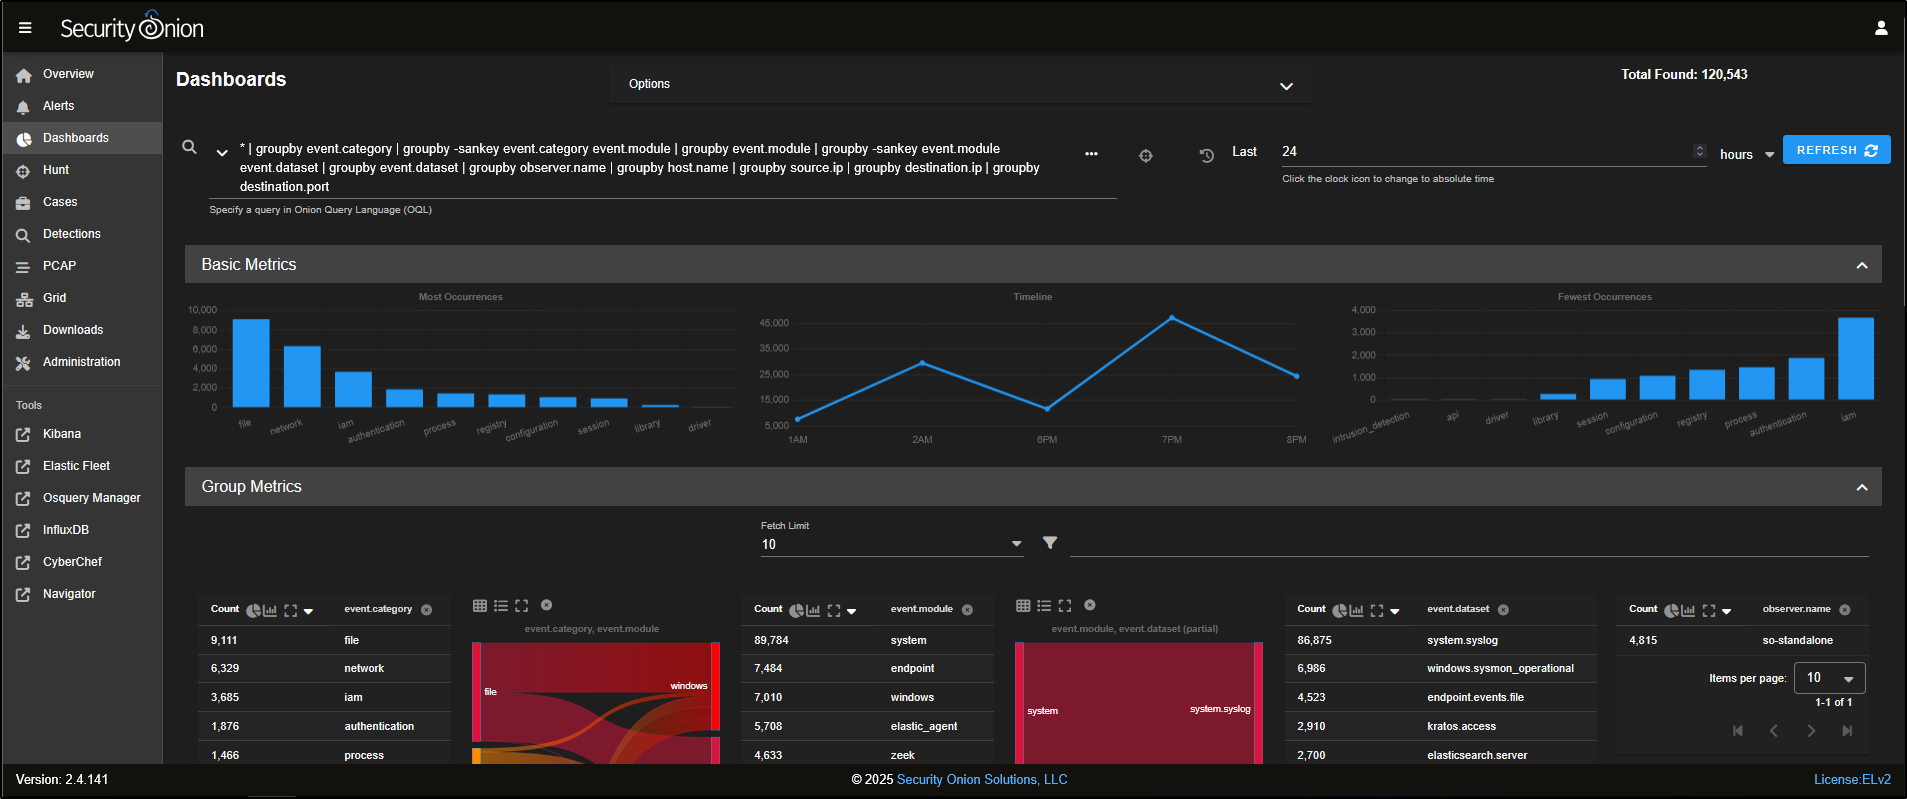
Besides the default overview, there are several prebuilt dashboards tailored to specific protocols and data sources.
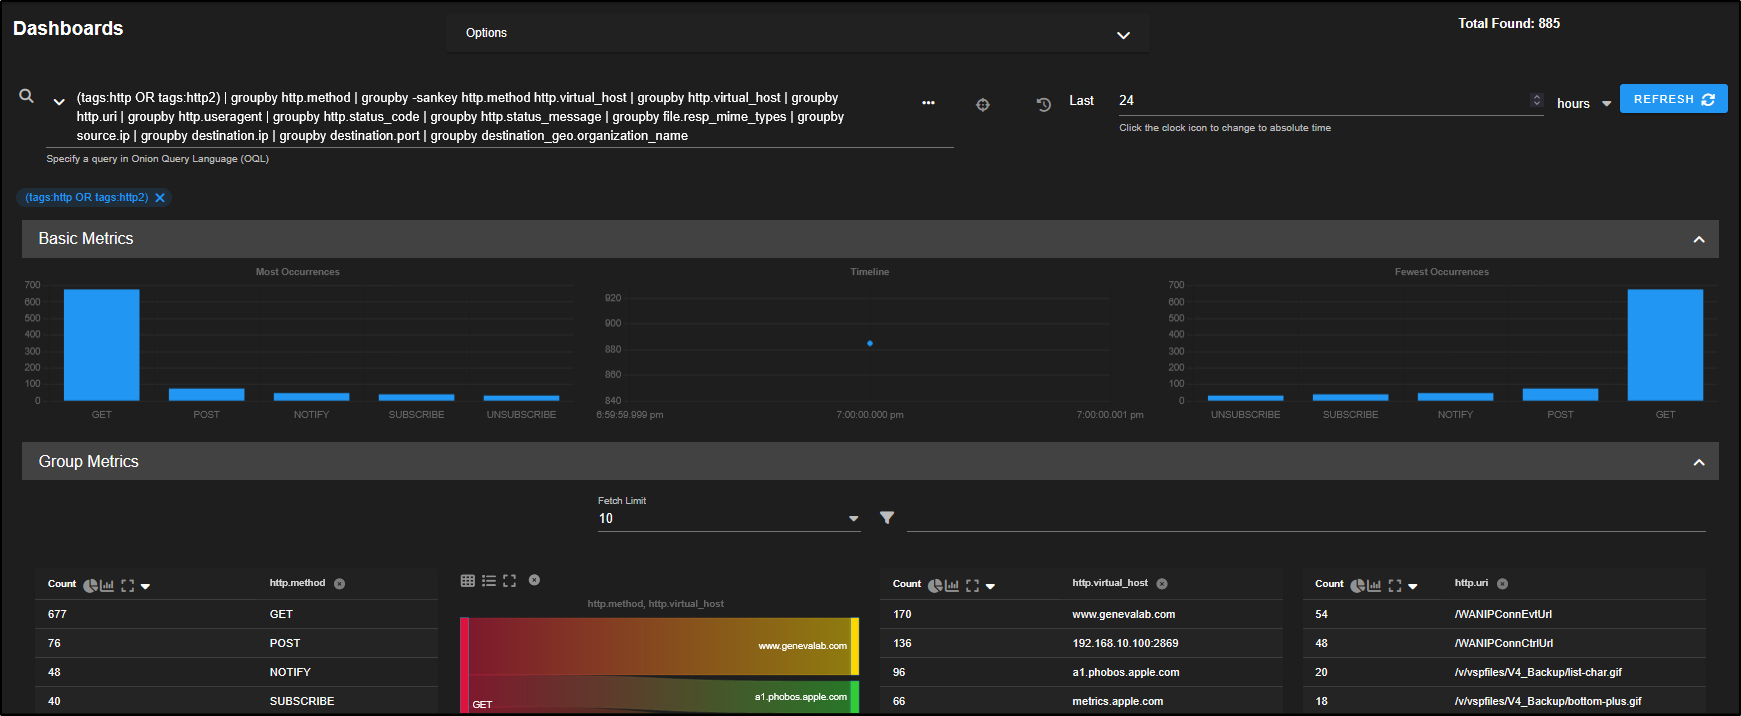
If you would like to carry out a similar threat hunt via Dashboards, a good place to begin is the HTTP dashboard, which focuses specifically on HTTP traffic patterns and related events.
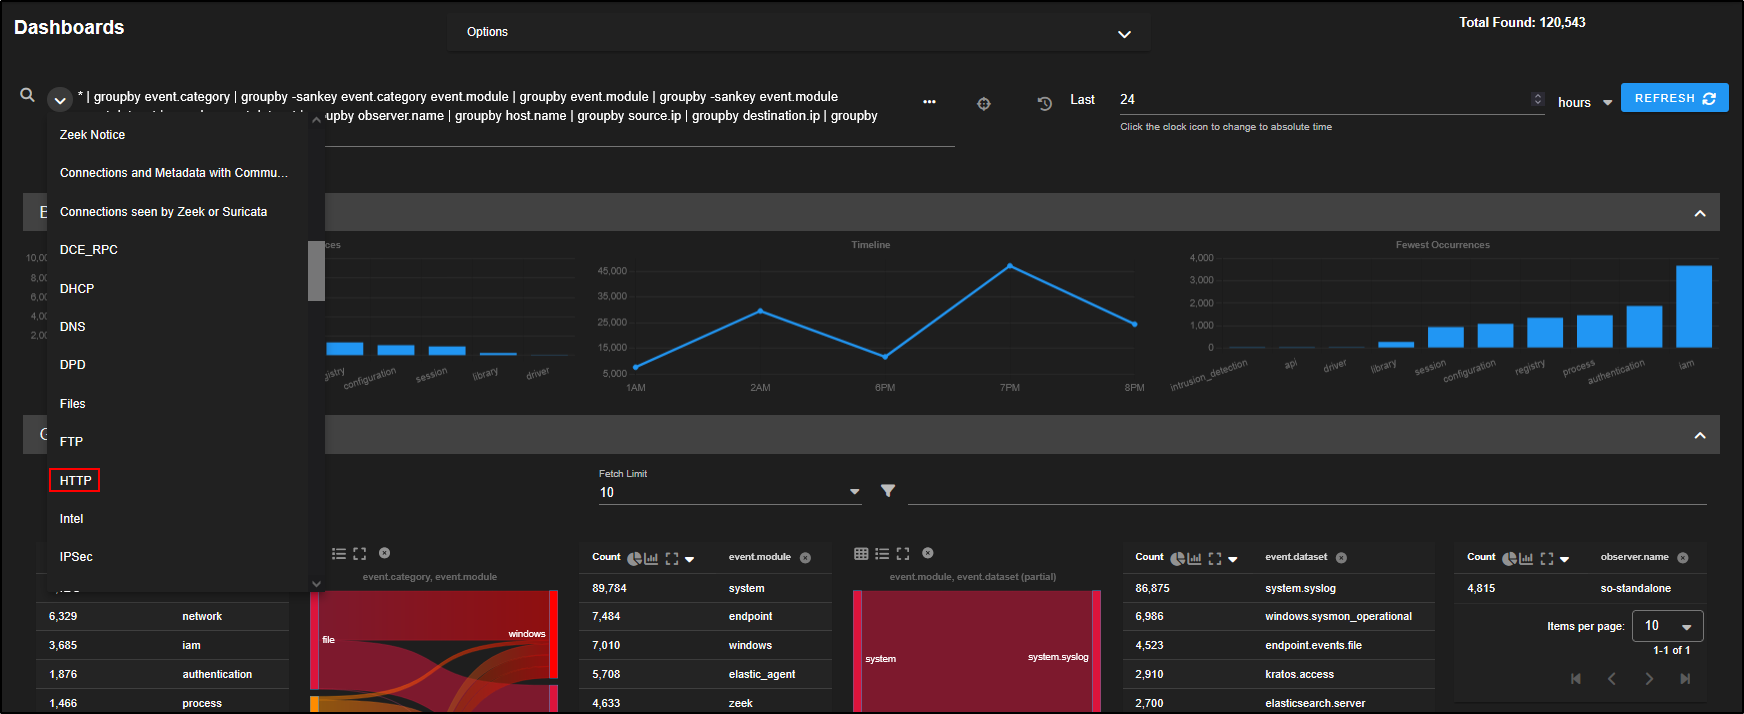
You will see a variety of tables and visualisations that summarise all HTTP connection data.
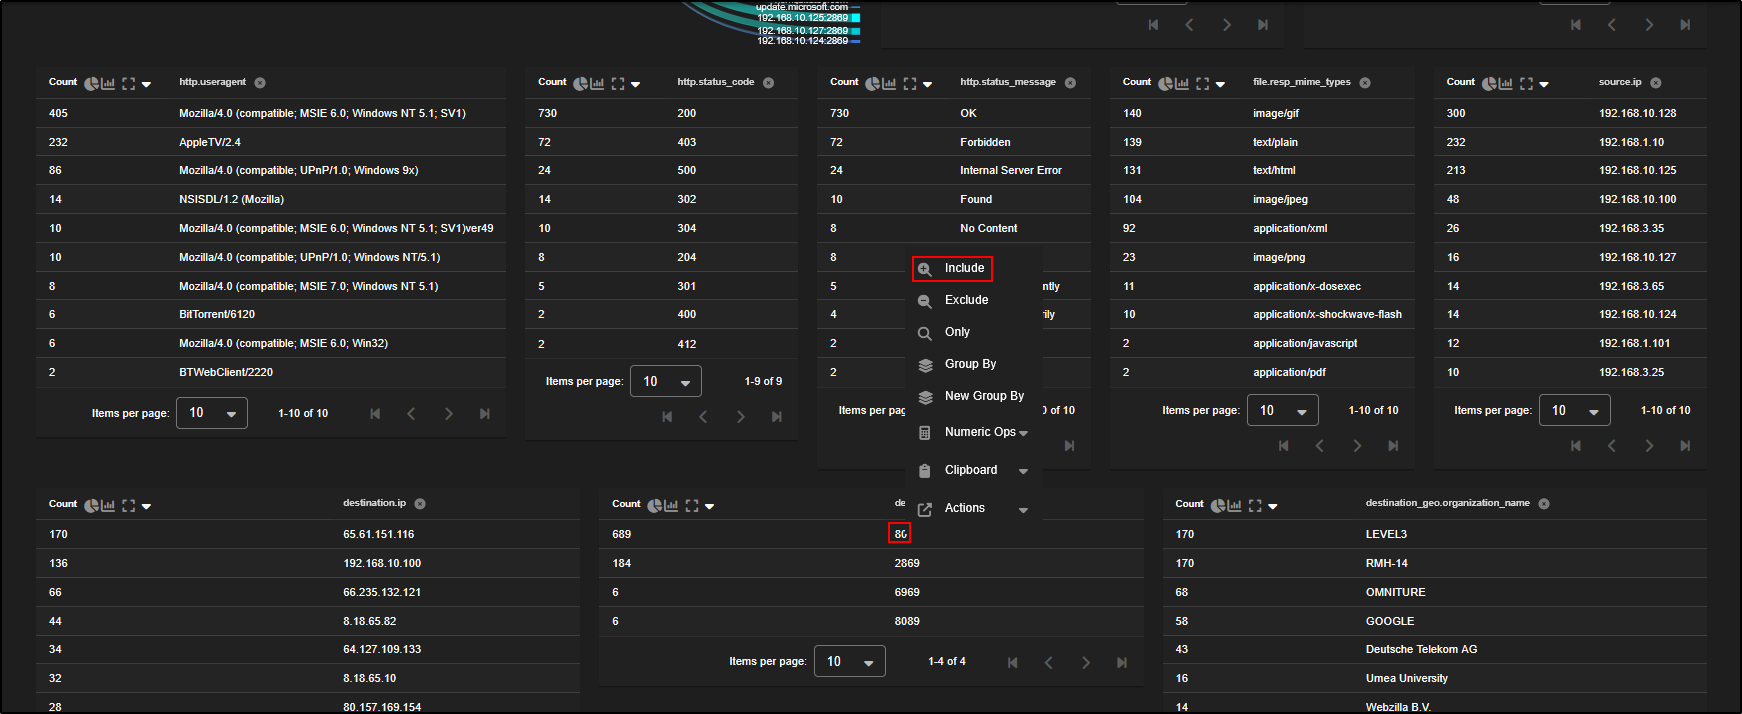
To filter for port 80 traffic, you can do it just like in the Hunt interface, by selecting destination.port 80 and choosing Include to narrow the results.
Scroll down the dashboard, find destination.port 80, and click Include to filter the results to show only HTTP traffic using port 80.
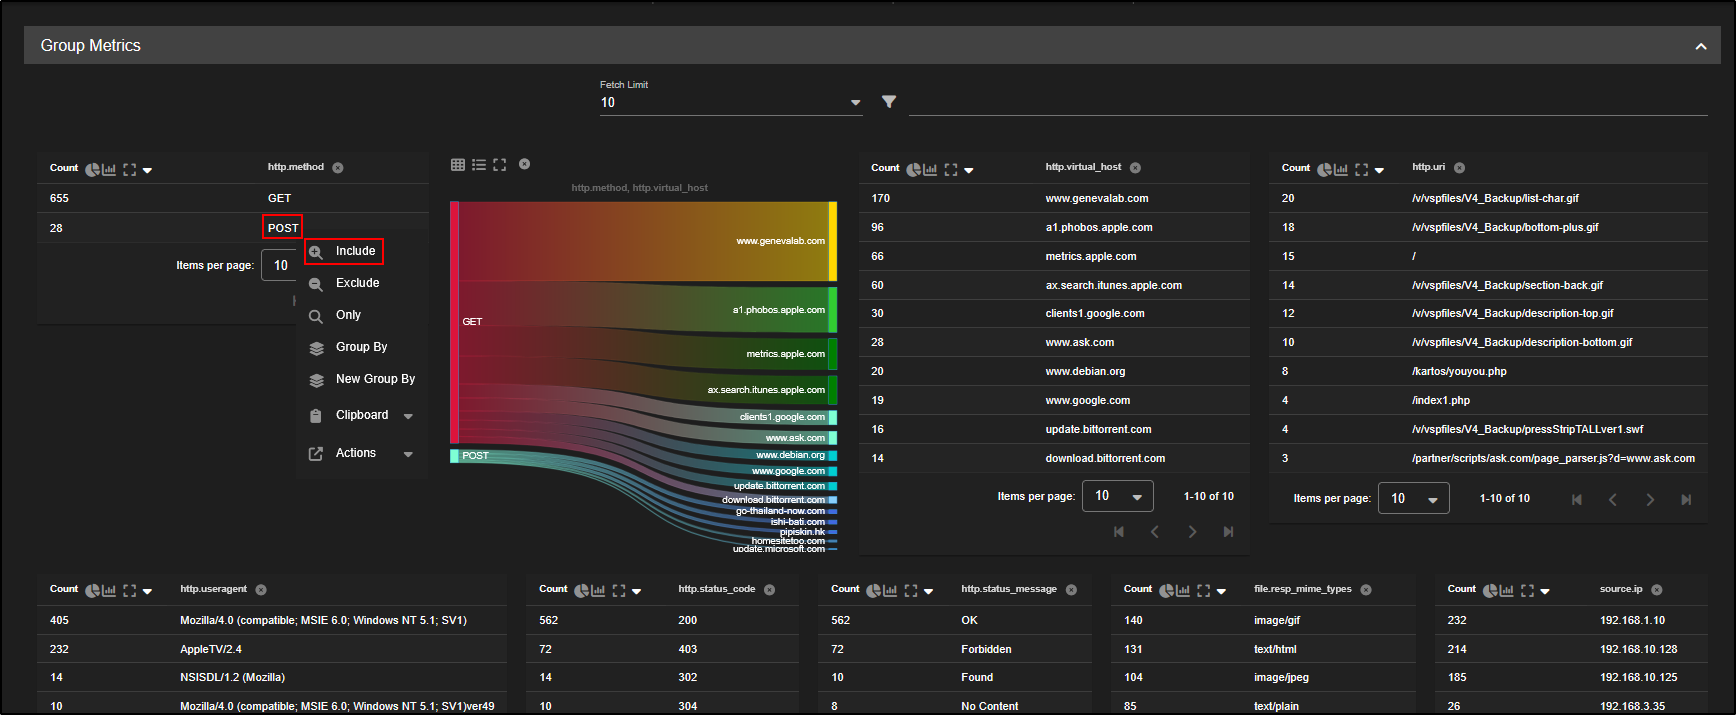
To focus on POST requests, scroll to http.method, click on POST, and choose Include. This will filter the dashboard to show only HTTP POST traffic.
The dashboard now displays only HTTP POST requests, allowing you to focus your analysis on traffic that may indicate data uploads or command-and-control activity.
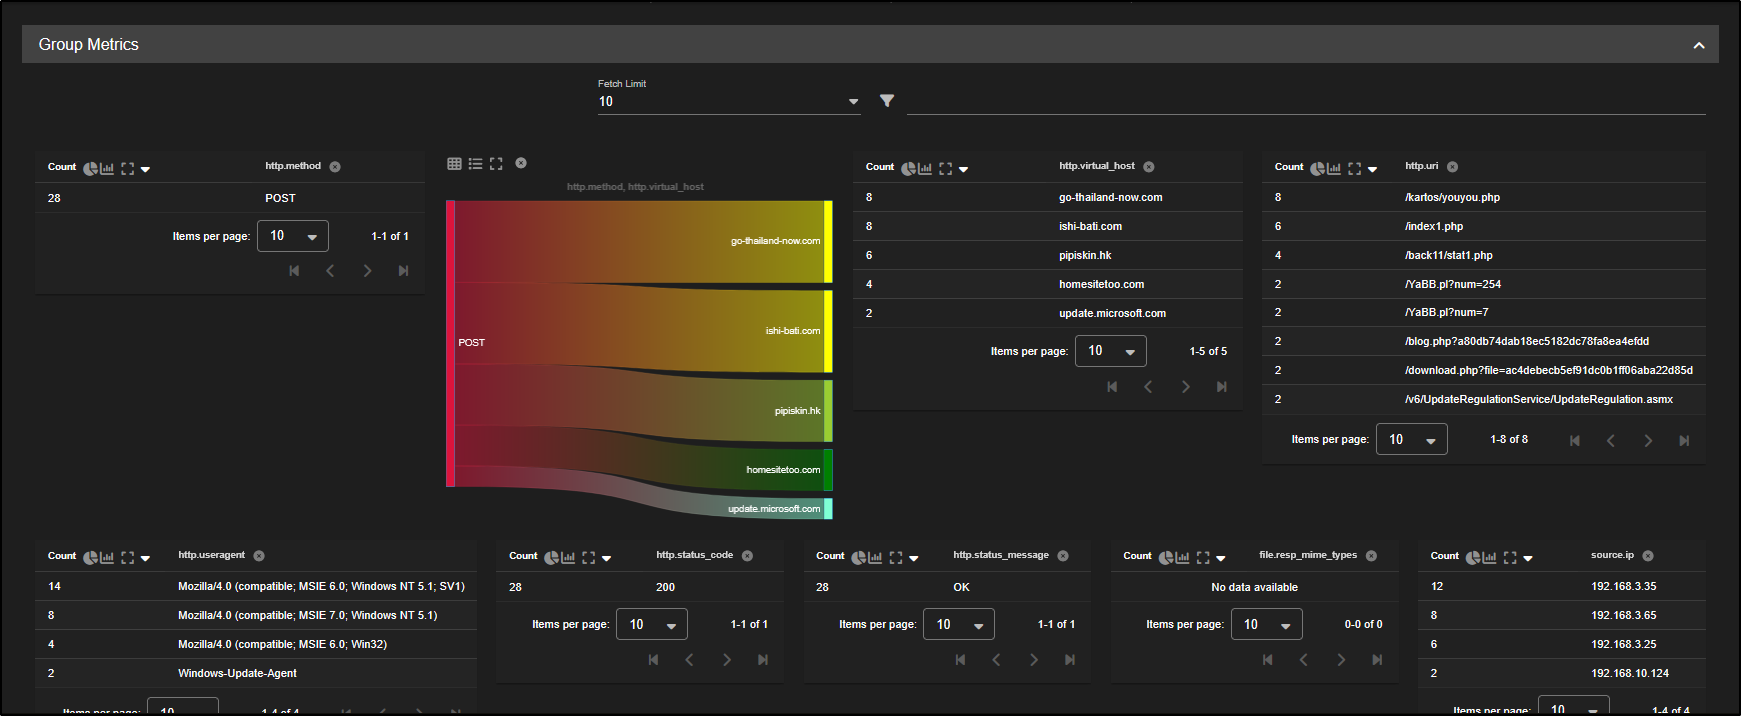
Scroll down and sort the tables by http.request.body.length to prioritise entries with larger POST payloads. You should now see the same suspicious activity identified earlier in the Hunt interface, confirming consistency across both views.
Both Dashboards and Hunt pull from the same underlying data. They just offer different ways of interacting with it.
You can use either interface for threat hunting and investigations, depending on whether you prefer visual summaries or a more flexible, query-driven approach.
Validate the hunt
Save the final OQL query and filters. Confirm the most important event against another source such as Zeek metadata, Suricata evidence, endpoint telemetry, or PCAP. State whether the hypothesis is supported, rejected, or unresolved and identify the telemetry gaps that limit confidence.