Run Suricata on pfSense
Evaluate the pfSense Suricata package in an isolated gateway lab, starting with alert-only operation and enabling blocking only after tuning and rollback tests.
Before you begin
Record the pfSense release, Suricata package version, interface mapping, protected networks, enabled sources, policy mode, and snapshot. Keep console access throughout. The detailed steps below retain the complete package installation, EVE, SID management, alert, and blocking screenshot sequence.
Do not expose a test client unnecessarily
Use an isolated client and locally controlled fixtures. Do not browse to arbitrary suspicious domains, enable broad blocking categories, or place a disposable host behind temporary public NAT unless the test is explicitly authorised and its cleanup is documented.
Build an alert-only baseline
- Install the Suricata package from the configured pfSense repository.
- Select one monitored lab interface and confirm its direction and networks.
- Enable EVE JSON output.
- Enable a small, relevant ET Open category set—not every category.
- Update rules, validate the interface, and start in alert-only mode.
- Record CPU, memory, packet rate, capture drops, and alert volume during a representative quiet and active period.
There is no universal healthy CPU threshold such as 30 percent. Judge health from stable resource use, packet throughput, capture/drop counters, service state, and the VM baseline.
Detailed package and interface configuration
The demonstrated pfSense workflow is included below with every package, ruleset, interface, EVE, resource-monitoring, service, and initial-alert screenshot. Where it selects all rule categories, follow the smaller measured category set recommended above for a new deployment.
While Suricata can be installed on a host, it can also be installed on a gateway such as pfSense. The pfSense is a free and open source firewall and router. For installing and configuring pfSense, refer to pfSense documentation and instruction video. pfSense can be downloaded from here.
Full demonstration video on configuring Suricata on pfSense can be found here.
After competing basic configuration on pfSense, navigate to System > Package Manager > Available Packages on pfSense web UI.
Search for suricata and click install (confirm when prompted). Internet connection is required.
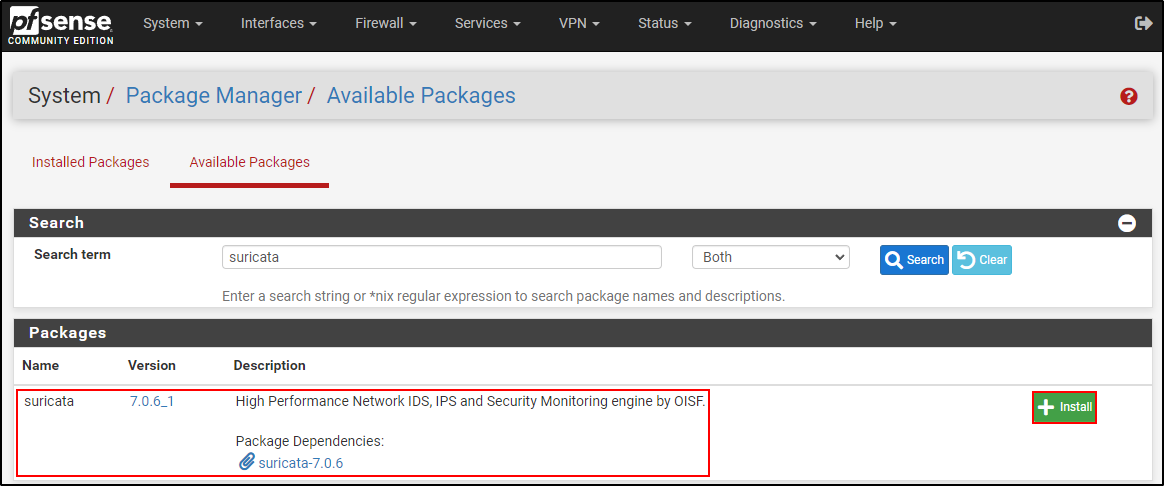
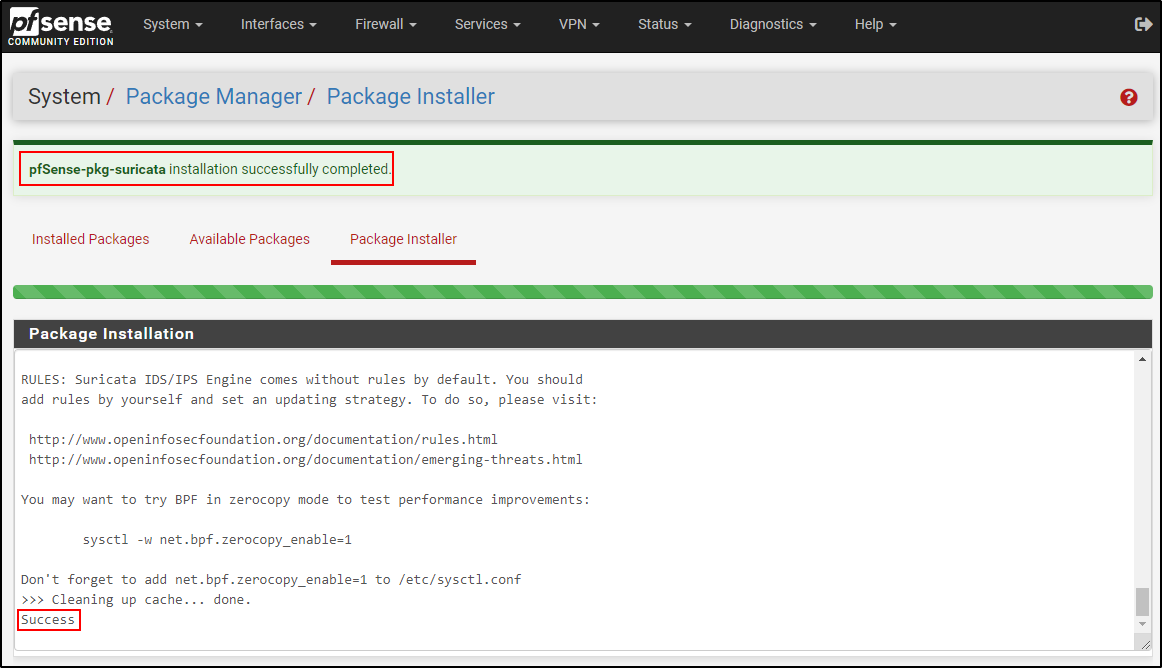
Once install is complete, navigate to Services > Suricata > Global Settings.
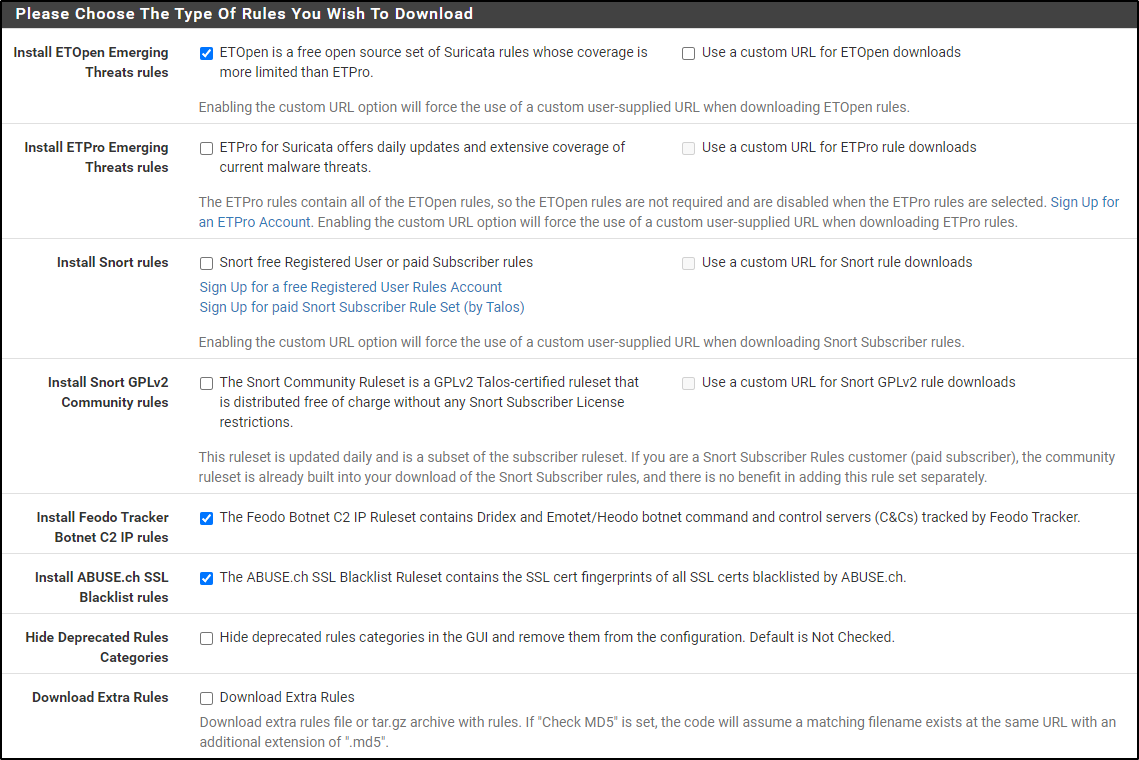
Select Install ETOpen Emerging Threats rules, Install Feodo Tracker Botnet C2 IP rules and Install ABUSE.ch SSL Blacklist rules.
Select 1 Day for Update Interval and select Live Rule Swap on Update.
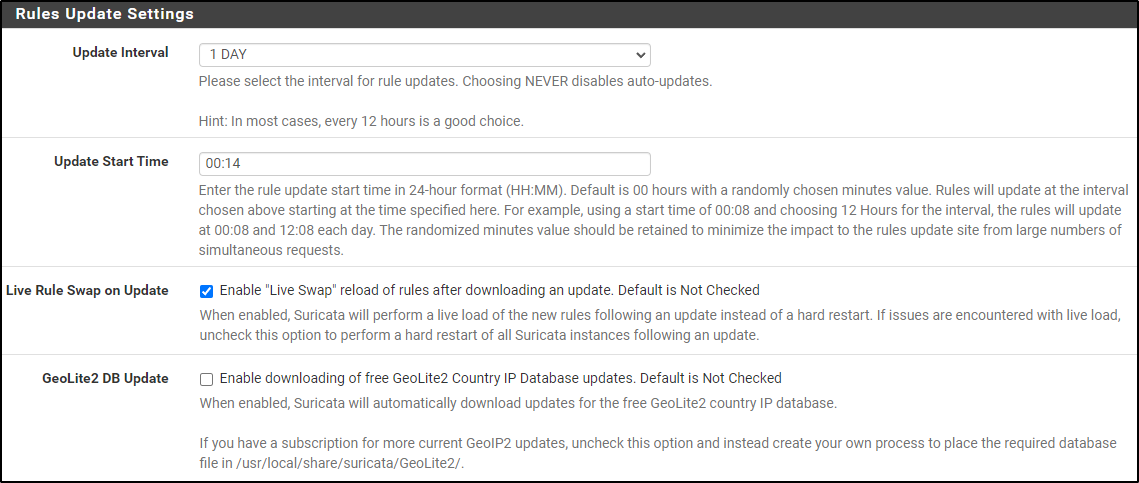
Leave rest of settings default and click save.
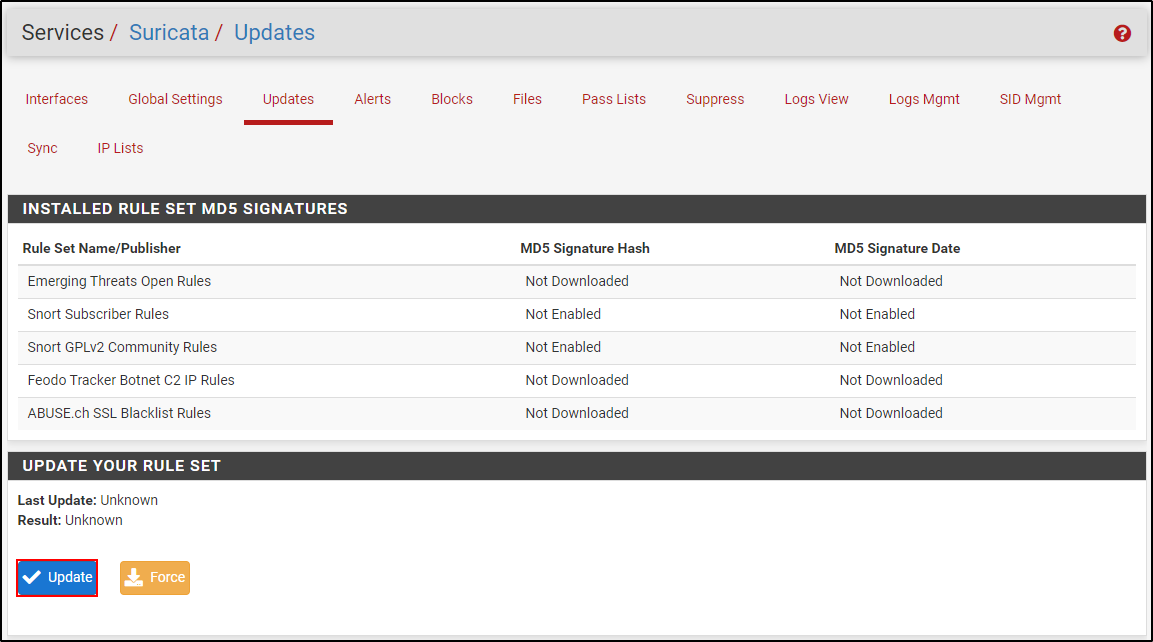
Navigate to Update section and click Update.
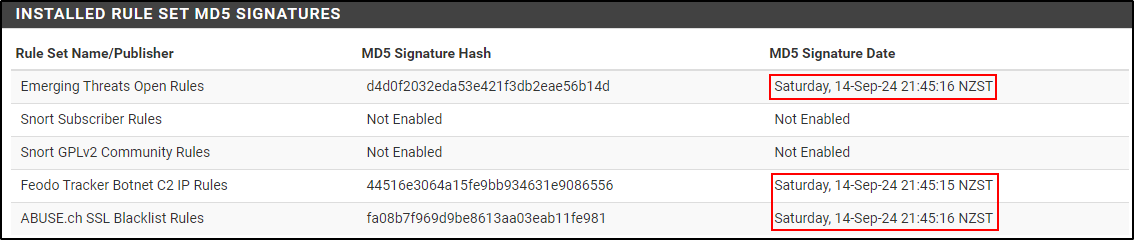
Once rule set update is complete, you will see timestamps of recent update.
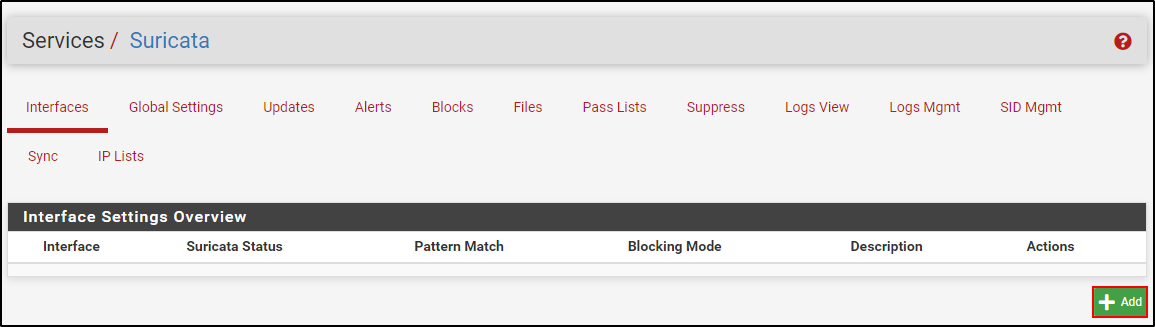
Navigate to Interfaces section and click Add.
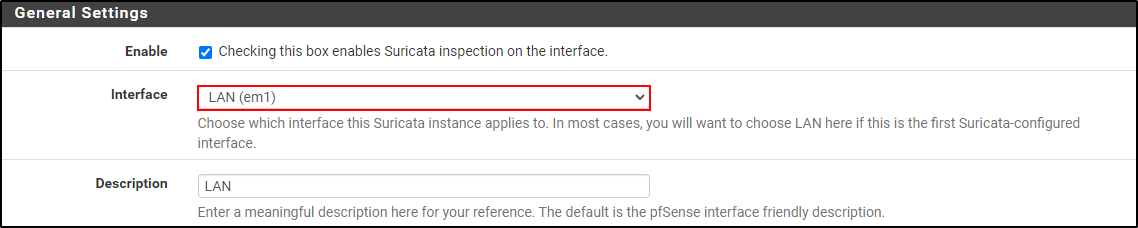
Select interface to run Suricata. In this demonstration, Suricata is installed on the LAN interface.
For the EVE Output Settings, select EVE JSON Log and Output Type as FILE. Leave rest of the settings as default values and click Save.
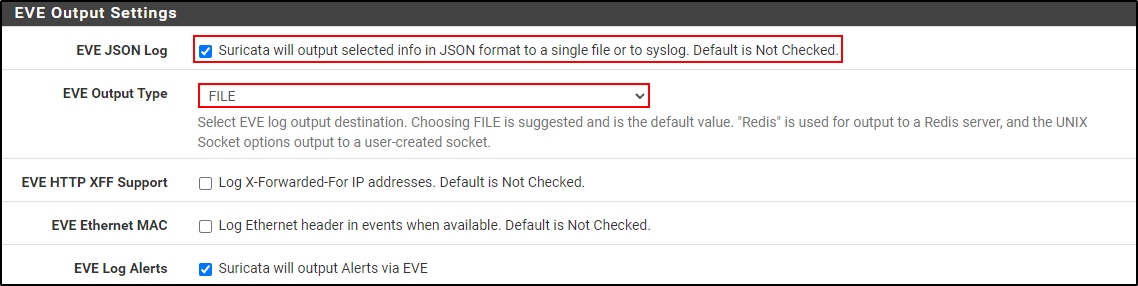
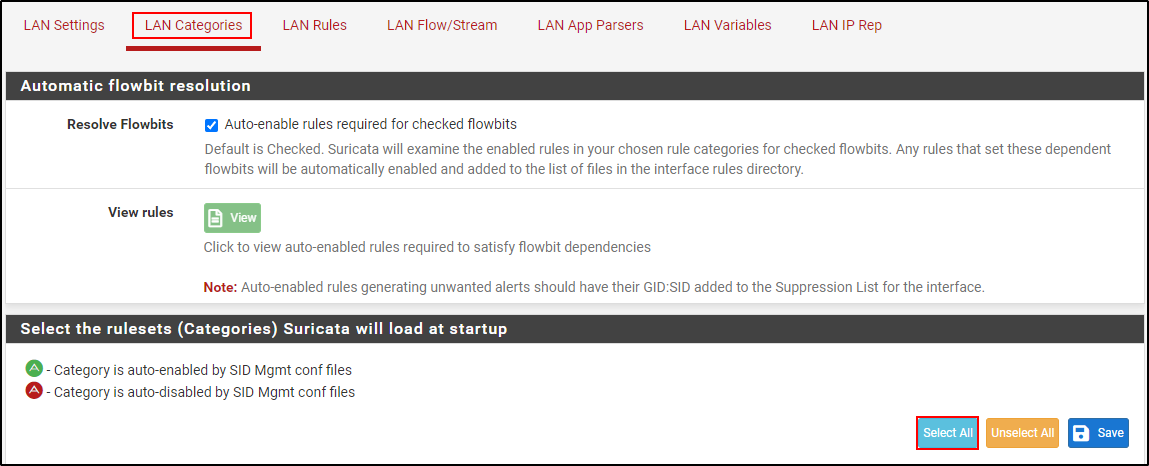
Within the Interface section, the demonstrated PoC selected all rulesets. Preserve that step only when reproducing its screenshots. For a maintained deployment, enable a small relevant category set, measure alert and resource impact, and expand deliberately rather than selecting all content at once.
You can read about each rule in the LAN Rules section and enable certain rule instead of enabling all rules. Pointproof documentation explains about the emerging rules.
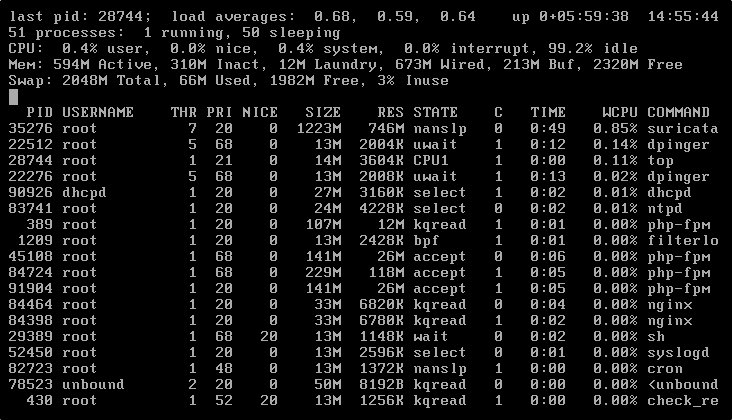
On pfSense VM, selection option 8 for shell and run top -s 1 to monitor CPU
Navigate back to Interfaces section and run Suricata by clicking the play button.
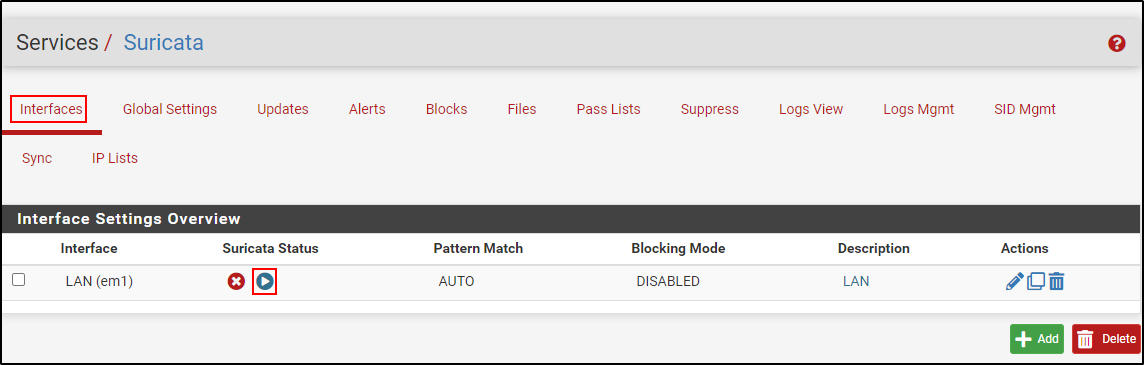
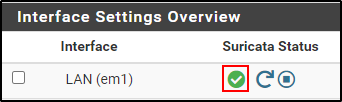
After a while, you will see a green tick box on Suricata Status, but CPU usage is still at 99%. Wait until CPU usage drops below 30% of pfSense VM CLI.
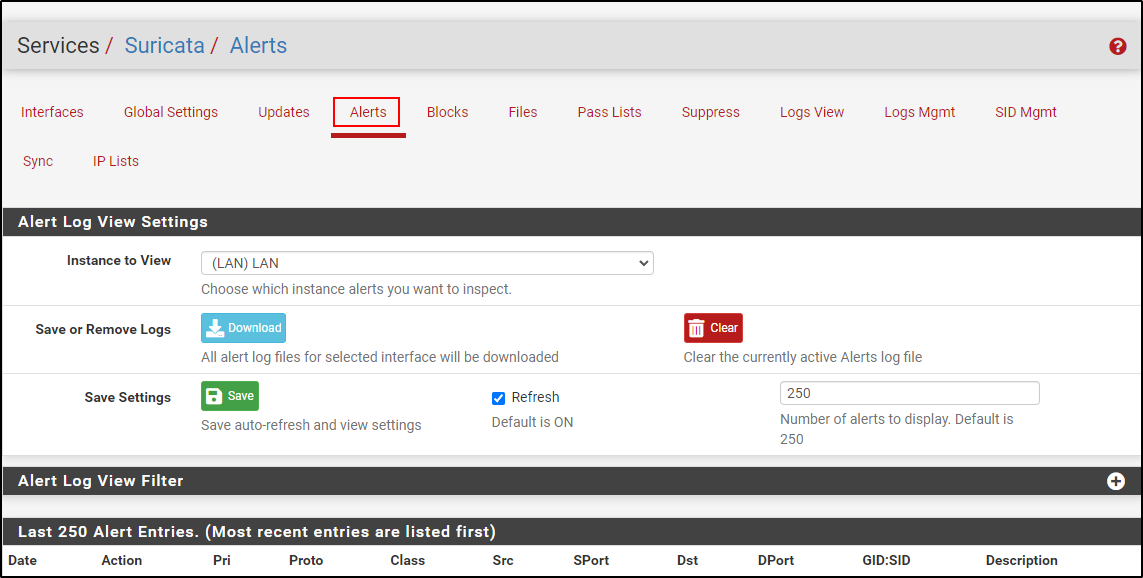
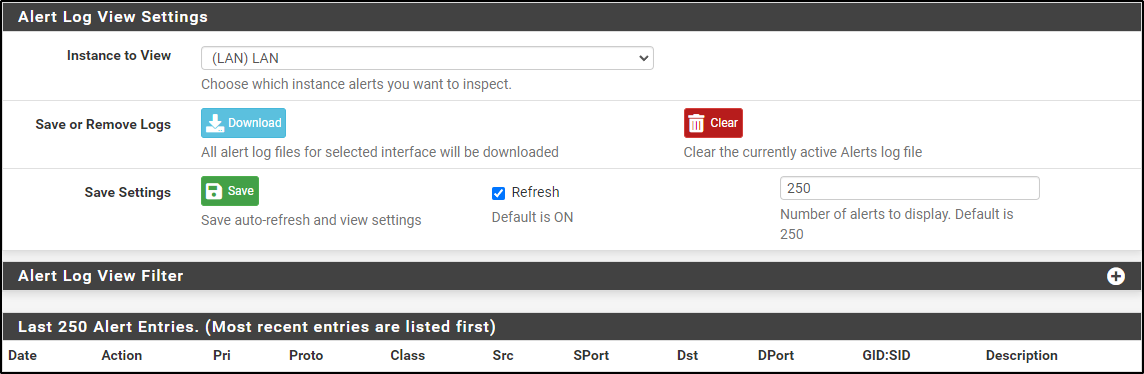
Navigate to the Alerts tab, and verify that there are no alerts.
Demonstrated IDS test
The PoC used a public redirect to exercise an ET Open .to signature. The
observed alert and screenshot are retained, but the endpoint and signature can
change. Prefer a locally controlled fixture for a repeatable new test.
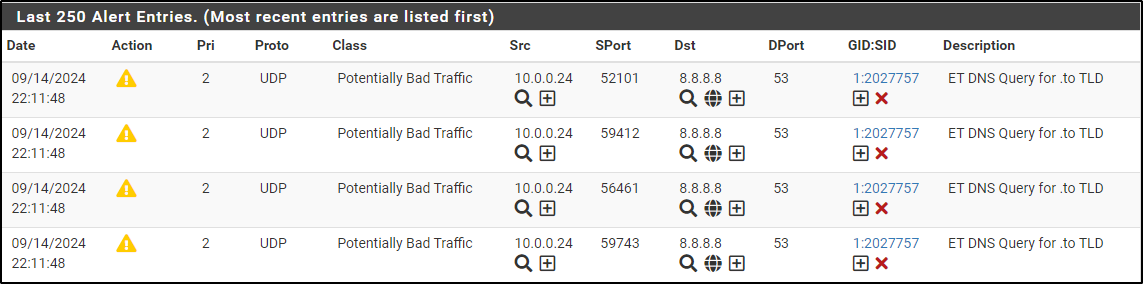
Suricata by default generates alert when a user access .to domain. From the Windows host connected to pfSense on an internal network, navigate to https://amzn.to/3xPjJbS on a web browser.
Note that the alerts have been generated but these are false positives.
Tune a controlled detection
Generate one benign local marker or authorised test event. Record its SID and evidence, then use SID Management to disable, enable, or change action for only that signature. Rebuild the assigned lists and repeat the same positive and negative tests.
The complete SID Management sequence follows, including the .to
false-positive exercise and screenshots. Public redirects, DNS results, and
signatures can change, so they are not a stable maintained test.
Detailed SID Management procedure
Copy GID:SID 1:2027757 . Navigate to SID Mgmt tab, select Enable Automatic SID State Management. Edit the disablesid-sample.conf
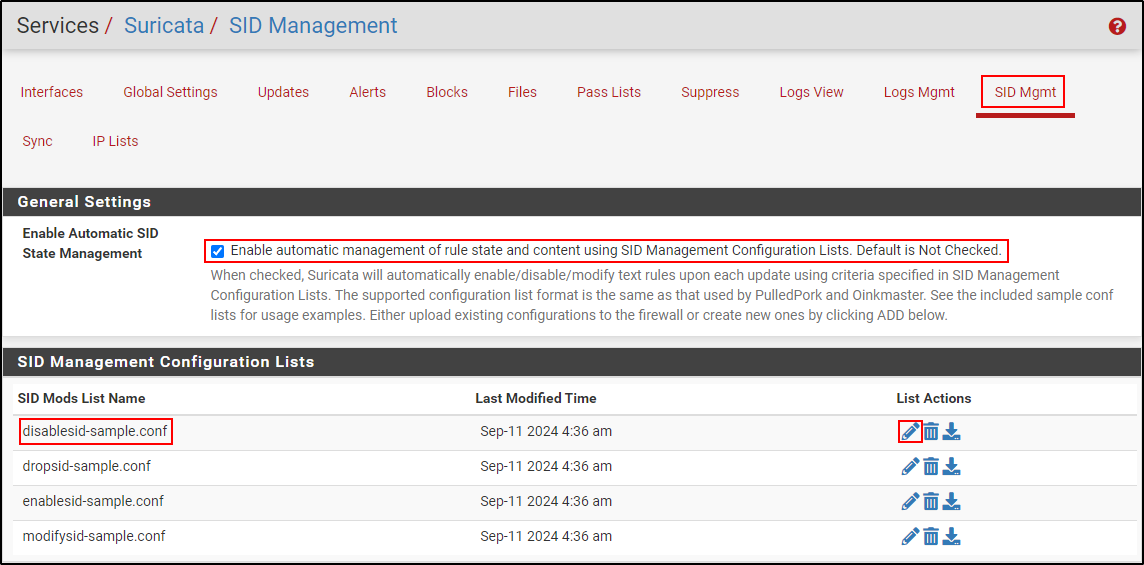
Edit the List Name as LAN-Disabled. Delete the existing content and copy and paste the following:
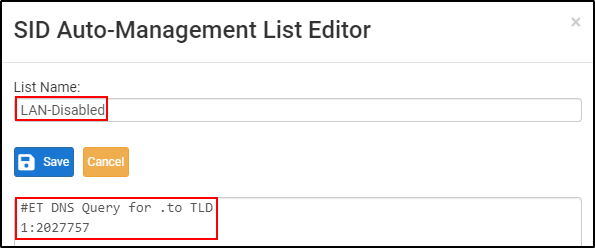
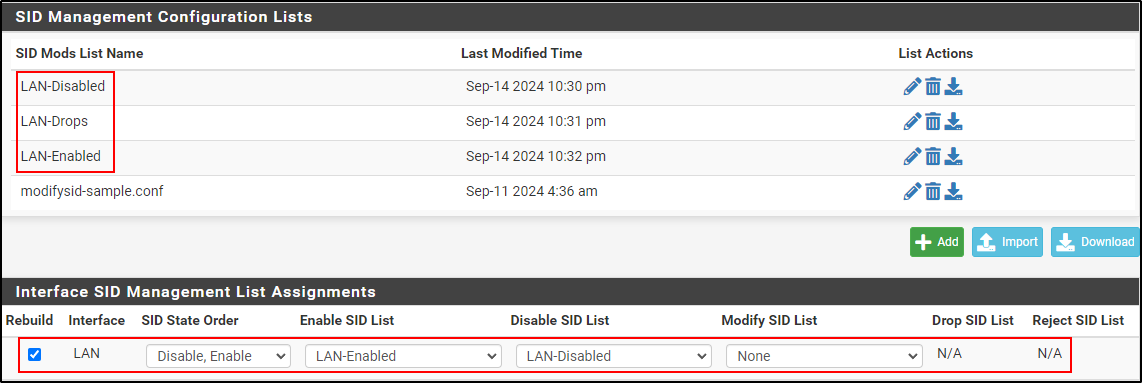
Repeat the same process for dropsid-sample.conf and enablesid-sample.conf. Change the List Name of dropsid-sample.conf to LAN-Drops and enablesid-sample.conf to LAN-Enabled. Make sure they each have nothing in the content.
For Interface SID Management List Assignments, select Rebuild. Select LAN-Enabled for Enable SID List, LAN-Disabled for Disable SID List.
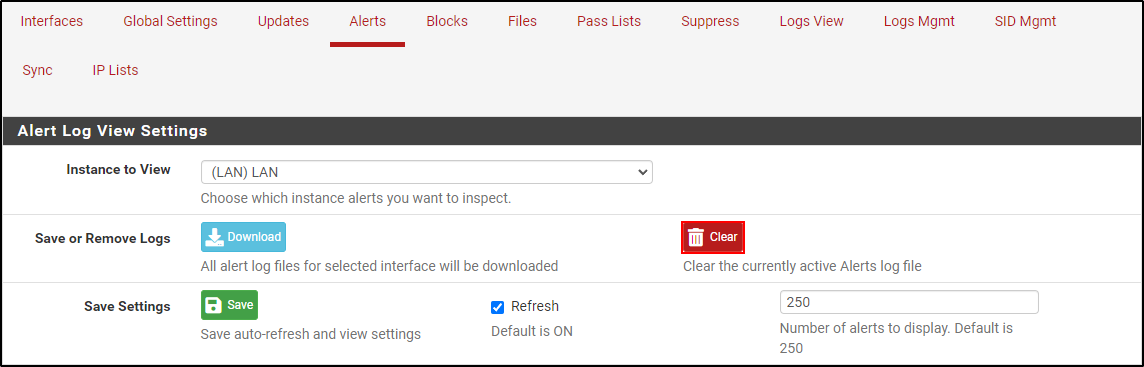
Navigate back to Alerts tab and clear alerts
From the Windows host connected to pfSense on an internal network. Wait for CPU percentage to drop. Navigate to https://amzn.to/3xPjJbS on a web browser. Verify that alerts have not been generated.
Navigate to Interface Settings > LAN Rules. Select emerging-dns.rules.
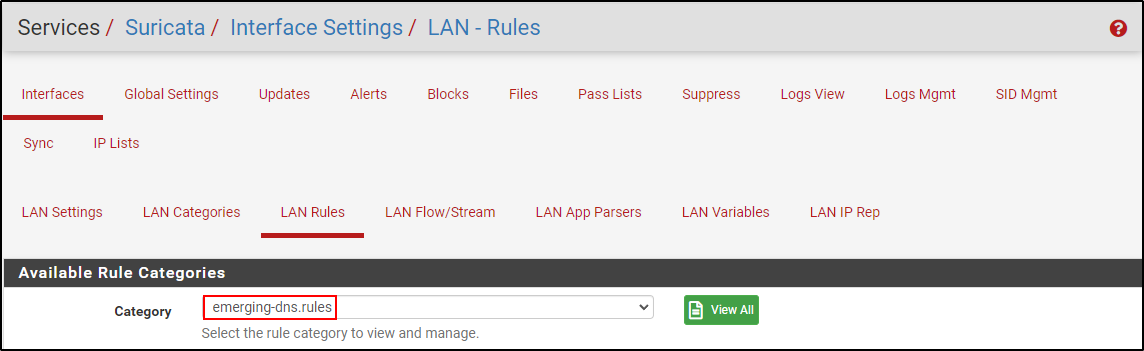
Search for .to . Verify that ET DNS Query for .to TLD is Auto-disabled by settings on SID Mgmt tab.

Stage blocking
Before selecting inline mode:
- confirm the NIC and virtual switch support the chosen mode;
- record hardware checksum-offload settings;
- export the pfSense configuration;
- prepare console recovery;
- select one proven SID for
drop; and - define expected client and gateway behavior.
Enable blocking for only the controlled SID, repeat the tests, verify the block and alert evidence, and confirm DNS, management, and unrelated client traffic still work. Broad category lists such as malware, scan, TOR, DNS, and reputation feeds should not all become drop rules in one unmeasured change.
Detailed IPS demonstration
The demonstrated blocking sequence retains the checksum-offload setting,
inline-mode selection, drop-list assignment, WICAR alert, .cc DNS test, and
all supporting screenshots. Treat the broad drop list as PoC evidence; apply a
single proven SID first when following the maintained workflow above.
Disable Hardware Checksum Offloading. Navigate to System > Advanced > Networking.
Select Disable hardware checksum offload and save. pfSense will reboot to apply changes.

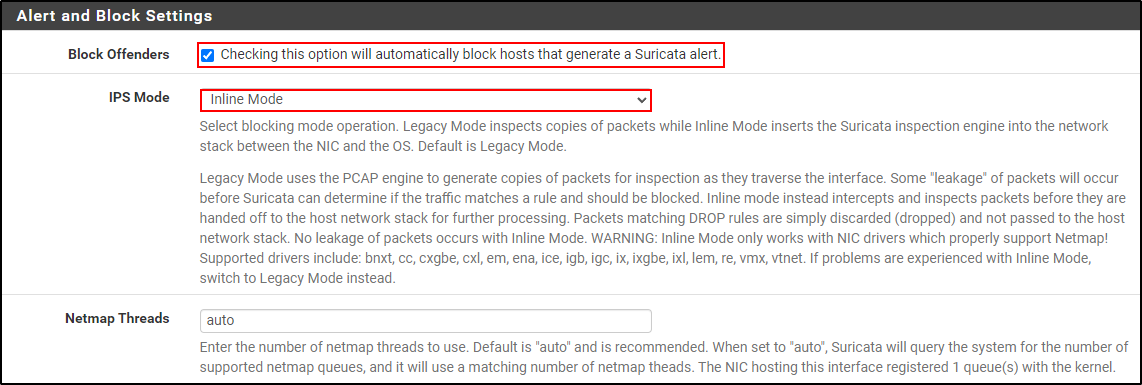
Navigate to Suricata > LAN Interface settings
In the Alert and Block Settings, select Block Offenders and Inline mode for IPS mode.
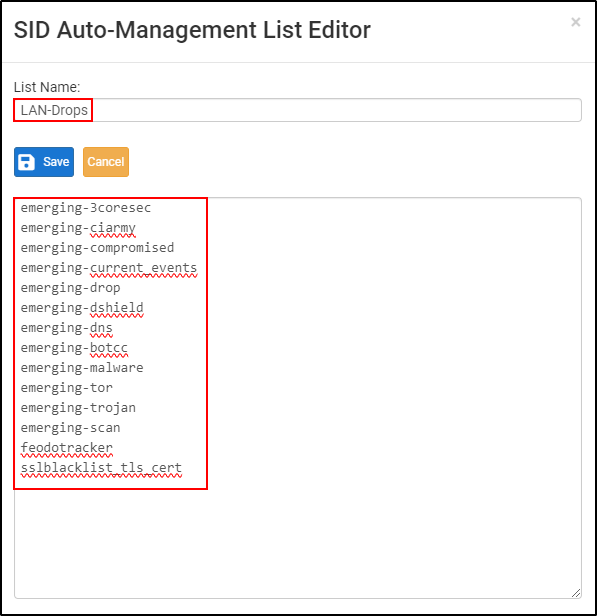
Navigate to SID Mgmt and edit LAN-Drops. Copy and paste the following list:
emerging-3coresec
emerging-ciarmy
emerging-compromised
emerging-current_events
emerging-drop
emerging-dshield
emerging-dns
emerging-botcc
emerging-malware
emerging-tor
emerging-trojan
emerging-scan
feodotracker
sslblacklist_tls_cert
For Interface SID Management List Assignments, select Rebuild and select LAN-Drops for Drop SID LIst. Click Save.

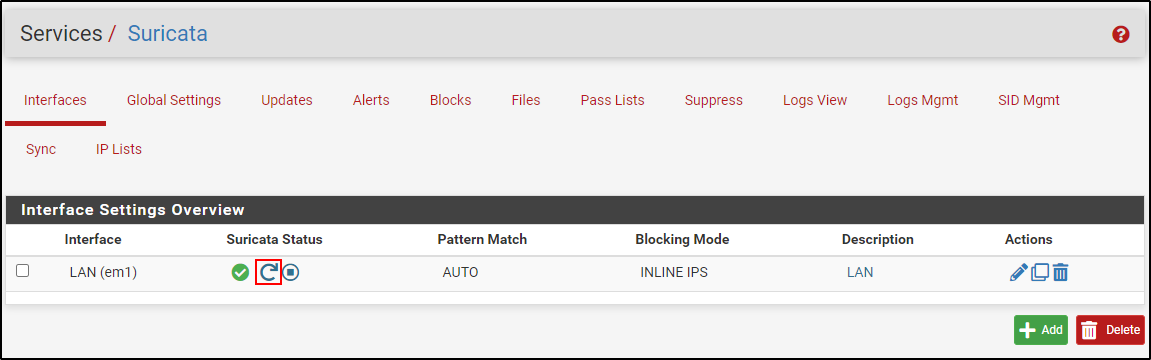
Navigate to Interface tab and restart Suricata
On Windows host, browse through http://malware.wicar.org/: This site hosts files and URLs that trigger IPS/IDS signatures without actually hosting real malware.
Verify that the alerts have been generated.
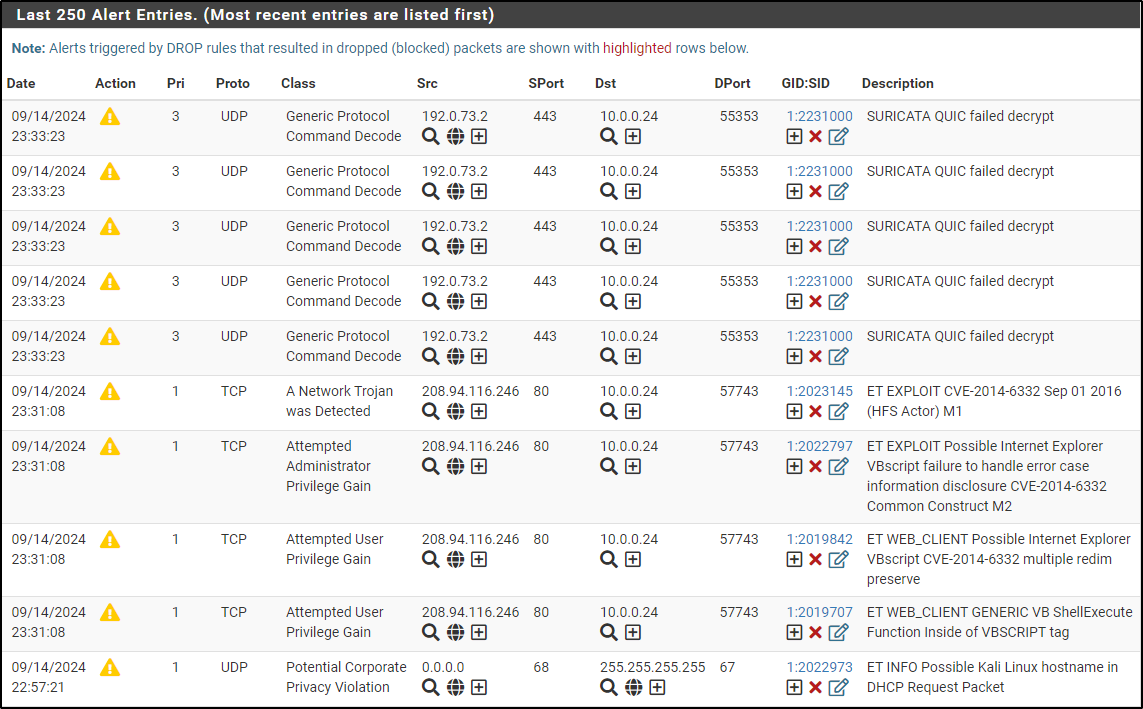
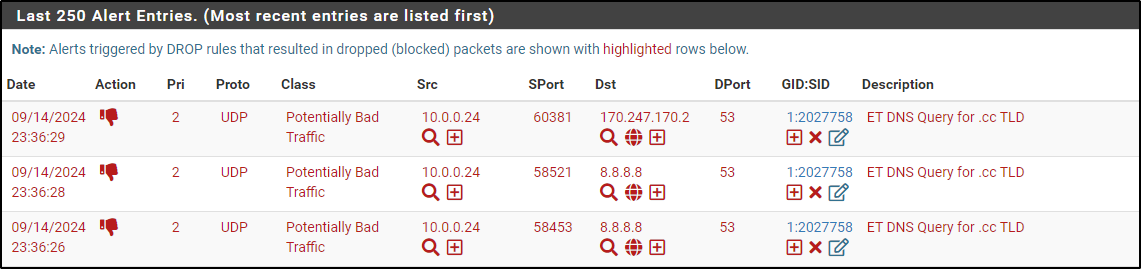
Part of our LAN-Drops includes a rule that will drop a traffic when a user visits .cc TLD
From Windows host, run nslookup something.cc
PS C:\Users\Administrator\Downloads> nslookup something.cc
Server:  UnKnown
Address:  ::1

DNS request timed out.
    timeout was 2 seconds.
DNS request timed out.
    timeout was 2 seconds.
*** Request to UnKnown timed-out
Alerts log shows that DNS query to .cc TLD has been dropped
Recovery
If traffic or management fails, use console access to stop the Suricata interface, return to alert-only mode, remove the drop assignment, restore the recorded offload setting if changed, and confirm routing and DNS. Restore the exported pfSense configuration if normal rollback fails.