Detect and Investigate
Generate controlled endpoint activity, find the supporting telemetry, and explain why Wazuh did or did not create an alert.
Use only an authorised isolated lab
Review the test and cleanup command before execution. Snapshot the endpoint when a test changes binaries, packages, accounts, or services.
Choose a guided scenario
| Scenario | Primary evidence | Learning goal |
|---|---|---|
| Signed binary proxy execution | Windows and Sysmon events | Trace ATT&CK technique T1218.010 |
| Suspicious binary | Rootcheck result | Explain an endpoint anomaly detection |
| File integrity monitoring | File change event | Distinguish create, modify, and delete activity |
| Vulnerability detection | Endpoint inventory and CVE record | Interpret an active vulnerability finding |
Detailed detection procedures
The complete signed-binary, suspicious-binary, file-integrity, and vulnerability-detection exercises are retained below with their commands, screenshots, investigation steps, and troubleshooting.
Use case: detect signed binary proxy execution
Signed binary proxy execution is a technique threat actors use to bypass application whitelisting by using trusted binaries to run malicious code. This technique is identified as T1218.010 based on the MITRE ATT&CK framework.
In this use case, we show how to abuse the Windows utility, regsvr32.exe, to bypass application controls. We then analyse events in the Wazuh archives to detect suspicious activity related to this technique.
Install Atomic Red Team
Perform this exercise only on an authorised disposable Windows endpoint. Record the current process execution policy, relax it only for this PowerShell process, and restore it during cleanup:
$originalExecutionPolicy = Get-ExecutionPolicy -Scope Process
Set-ExecutionPolicy -Scope Process -ExecutionPolicy RemoteSigned -Force
Install the ART execution framework only from a reviewed release or commit. The bootstrap command below downloads and executes code: inspect the script, record its commit, and verify its hash before running it. Do not use a floating branch in a production environment.
IEX (IWR 'https://raw.githubusercontent.com/redcanaryco/invoke-atomicredteam/master/install-atomicredteam.ps1' -UseBasicParsing);
Install-AtomicRedTeam -getAtomics
Import the ART module to use Invoke-AtomicTest function
Review one test and check its prerequisites before execution:
Invoke-AtomicTest T1218.010 -TestNumbers 1 -ShowDetails
Invoke-AtomicTest T1218.010 -TestNumbers 1 -CheckPrereqs
#Example output
PathToAtomicsFolder = C:\AtomicRedTeam\atomics

T1218.010-1 Regsvr32 local COM scriptlet execution
T1218.010-2 Regsvr32 remote COM scriptlet execution
T1218.010-3 Regsvr32 local DLL execution
T1218.010-4 Regsvr32 Registering Non DLL
T1218.010-5 Regsvr32 Silent DLL Install Call DllRegisterServer
Run the controlled test
Emulate one signed-binary proxy execution test. Do not invoke the entire technique because its tests have different prerequisites and effects.
#Example output
PathToAtomicsFolder = C:\AtomicRedTeam\atomics

Executing test: T1218.010-1 Regsvr32 local COM scriptlet execution
Done executing test: T1218.010-1 Regsvr32 local COM scriptlet execution
Executing test: T1218.010-2 Regsvr32 remote COM scriptlet execution
Done executing test: T1218.010-2 Regsvr32 remote COM scriptlet execution
Executing test: T1218.010-3 Regsvr32 local DLL execution
Done executing test: T1218.010-3 Regsvr32 local DLL execution
Executing test: T1218.010-4 Regsvr32 Registering Non DLL
Done executing test: T1218.010-4 Regsvr32 Registering Non DLL
Executing test: T1218.010-5 Regsvr32 Silent DLL Install Call DllRegisterServer
Done executing test: T1218.010-5 Regsvr32 Silent DLL Install Call DllRegisterServer
Confirm that the expected process and Sysmon events were generated. After collecting the evidence, run the cleanup and restore the process policy:
Invoke-AtomicTest T1218.010 -TestNumbers 1 -Cleanup
Set-ExecutionPolicy -Scope Process -ExecutionPolicy $originalExecutionPolicy -Force
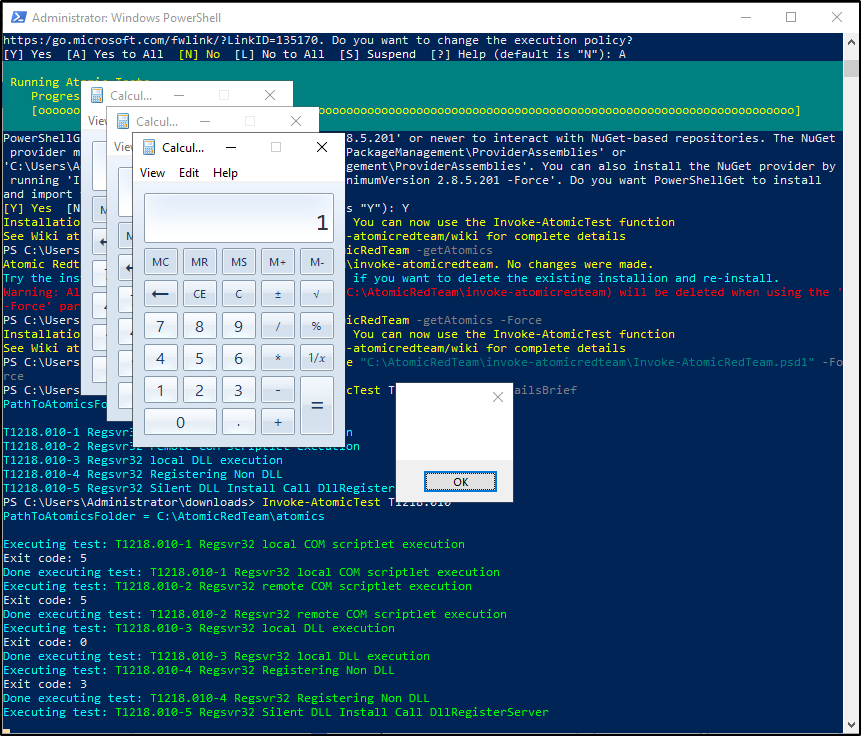
Investigate in the Wazuh dashboard
Use the Wazuh archives to query and display events related to the technique being hunted. It's important to note that while consulting the archives, some events might already be captured as alerts on the Wazuh dashboard. You can use information from the Wazuh archives, including alerts and events that have no detection to create custom rules based on your specific requirements.
Apply a time range filter to view events that occurred within the last five minutes of when the test was performed. Filter to view logs from the specific Windows endpoint using agent.id, agent.ip or agent.name.
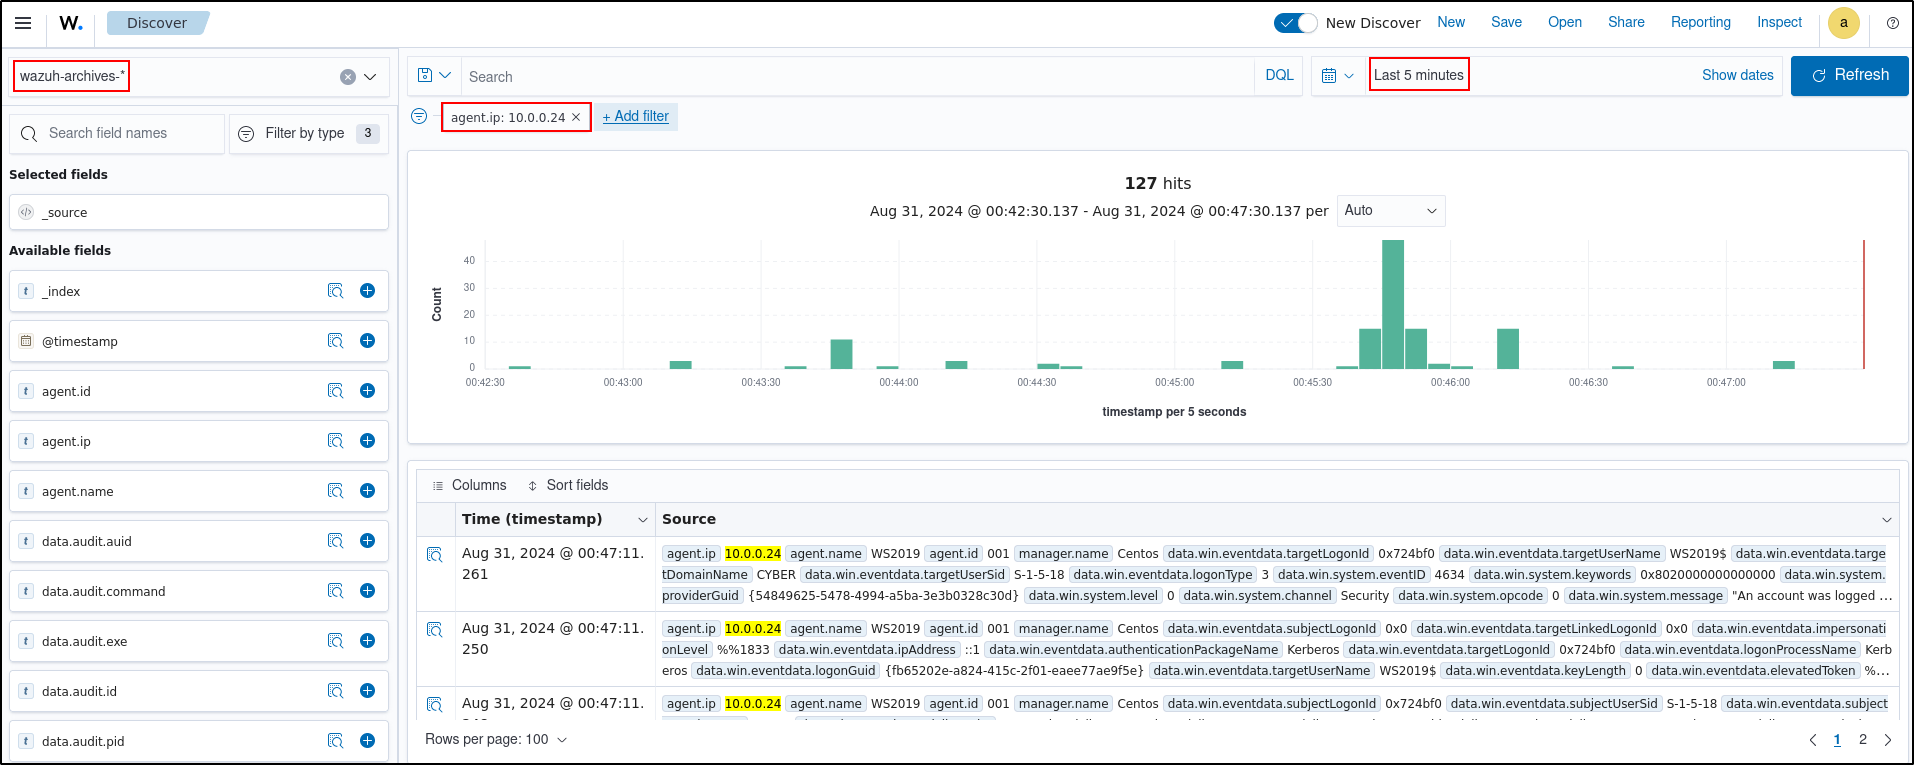
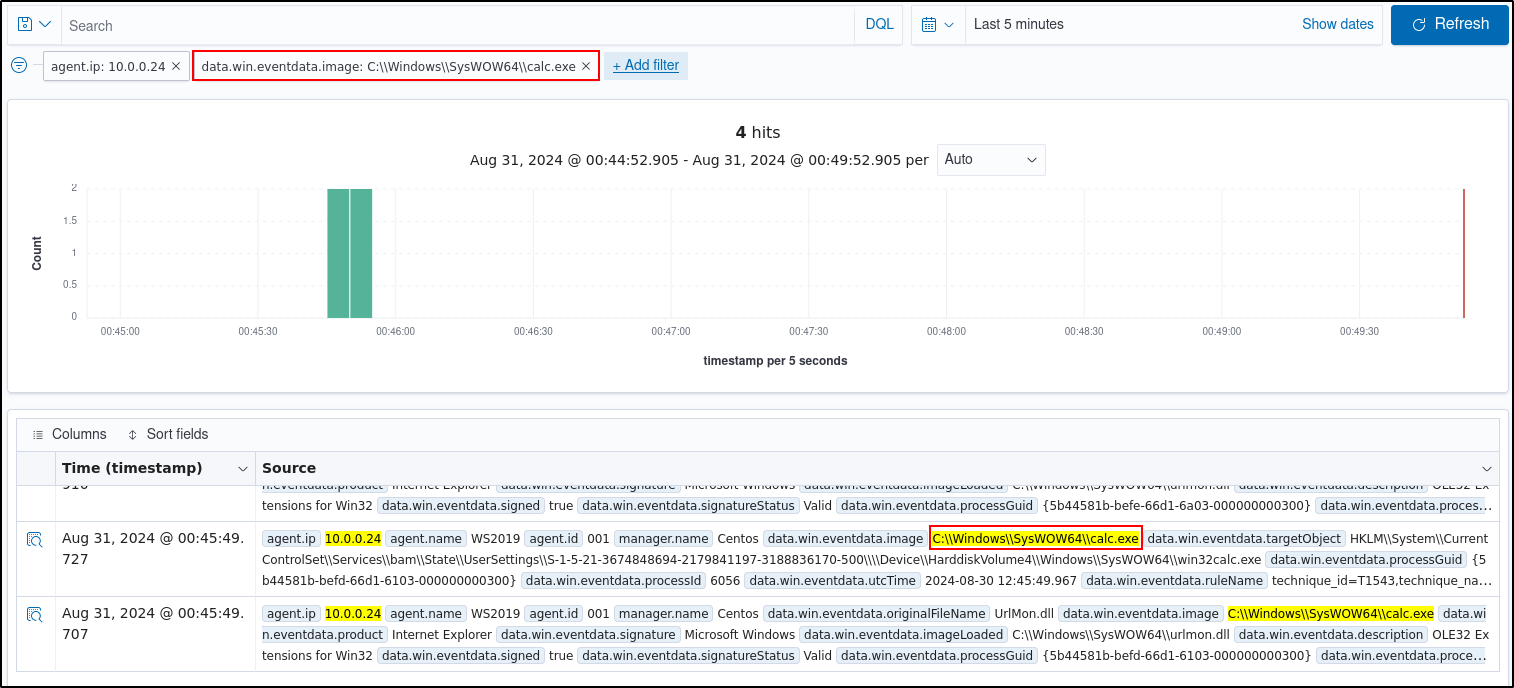
There are multiple hits that you can investigate to determine a correlation with the earlier attack emulation. For instance, you may notice a calculator spawning event similar to the one observed on the Windows endpoint during the test.
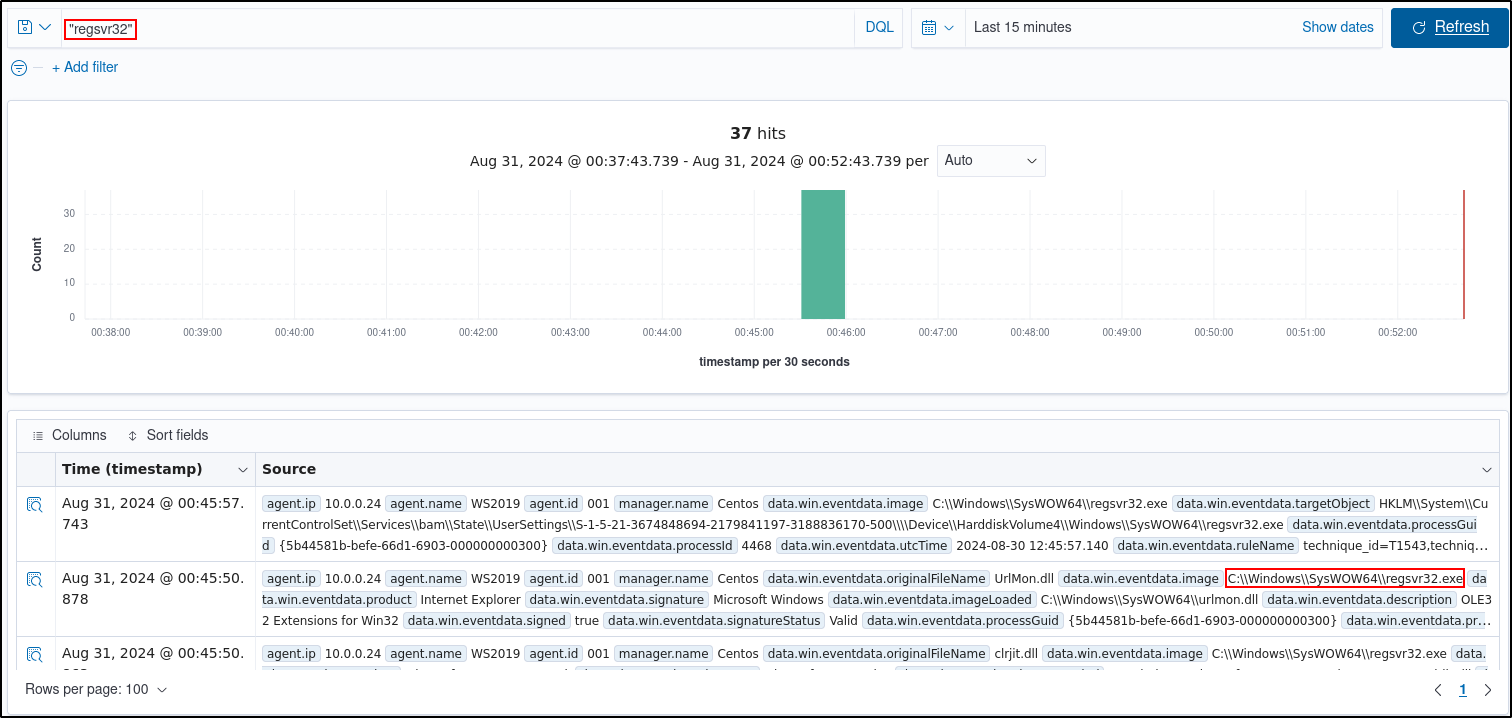
Type regsvr32 in the search bar to streamline and investigate events related to the regsvr32 utility.
Expand any of the events to view their associated fields.
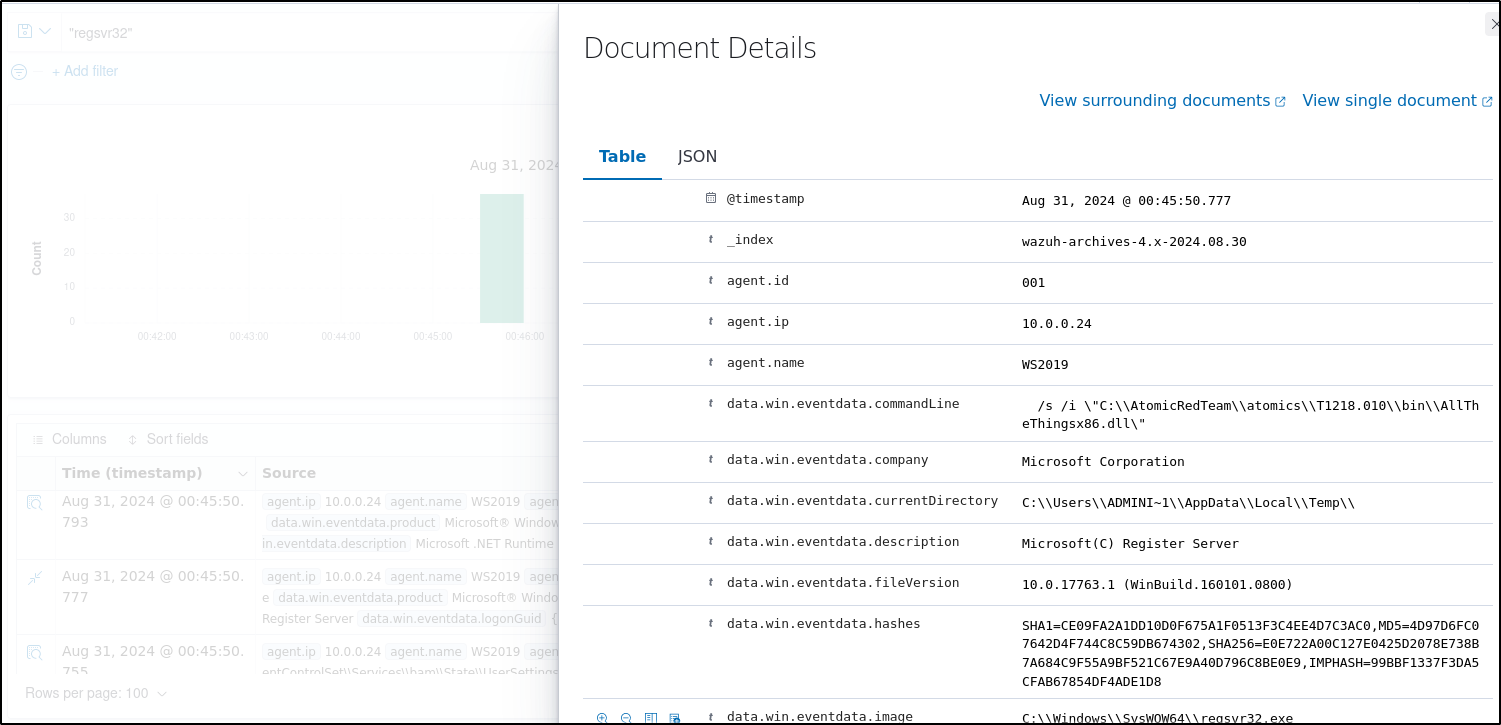
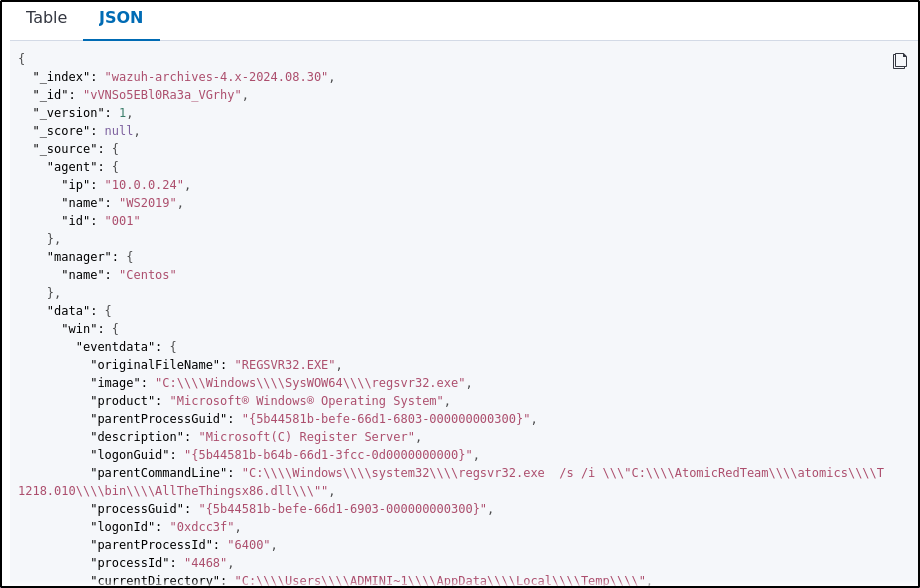
Click on the JSON tab to view the JSON format of the archived logs.
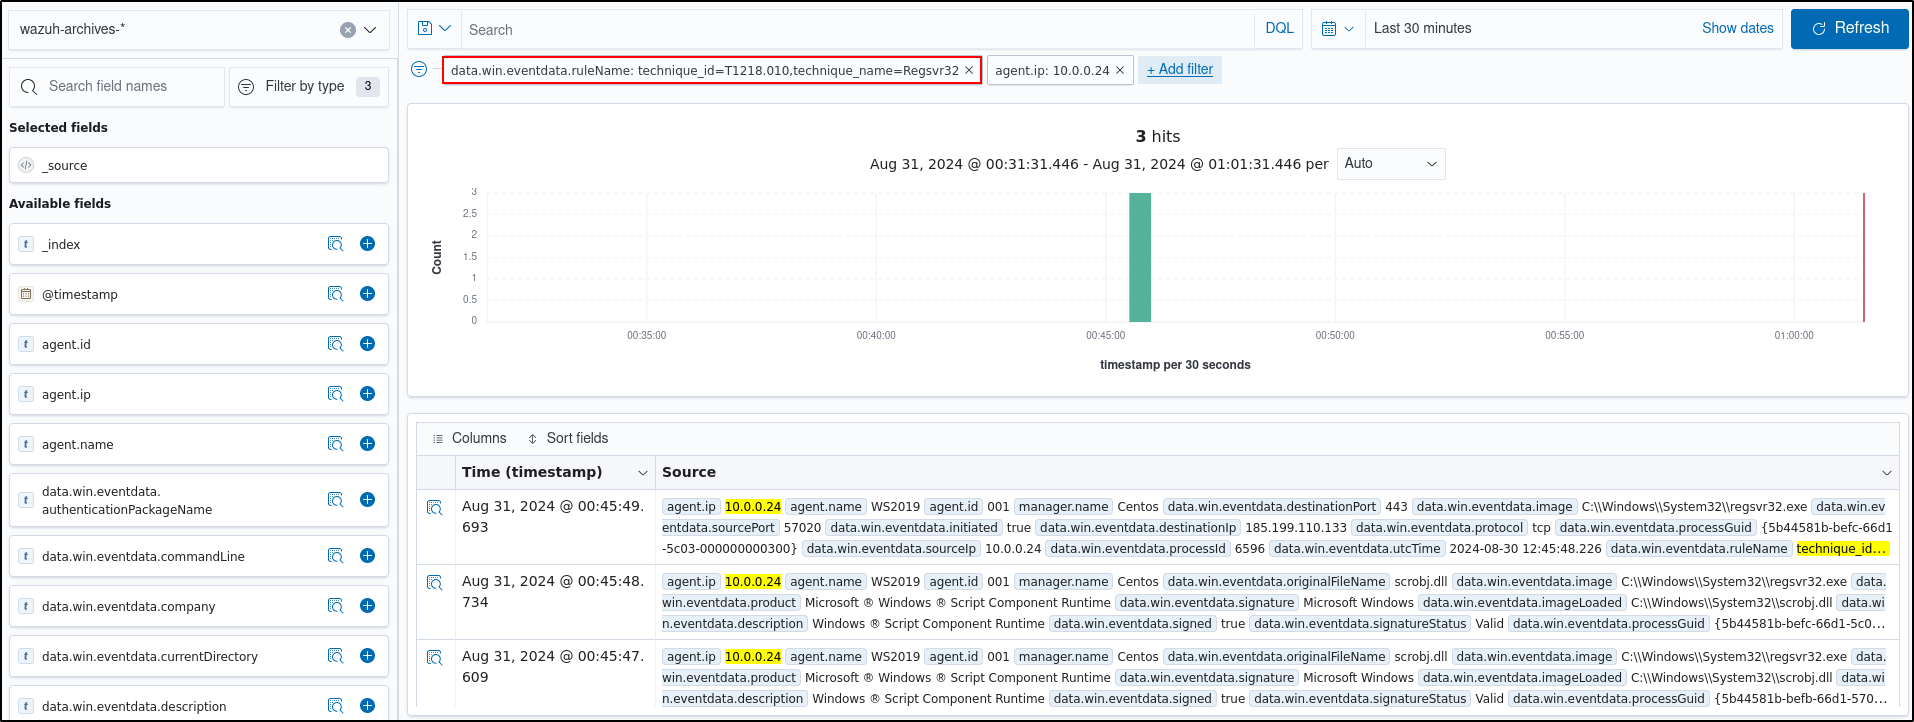
Apply the data.win.eventdata.ruleName:technique_id=T1218.010,technique_name=Regsvr32 filter to see the technique ID as shown below.
It is recommended to enable archiving as it allows users to view logs from network devices. However, if you prefer not to enable archiving, similar search can be performed on wazuh-alerts- (default) index instead of wazuh-archives- index.
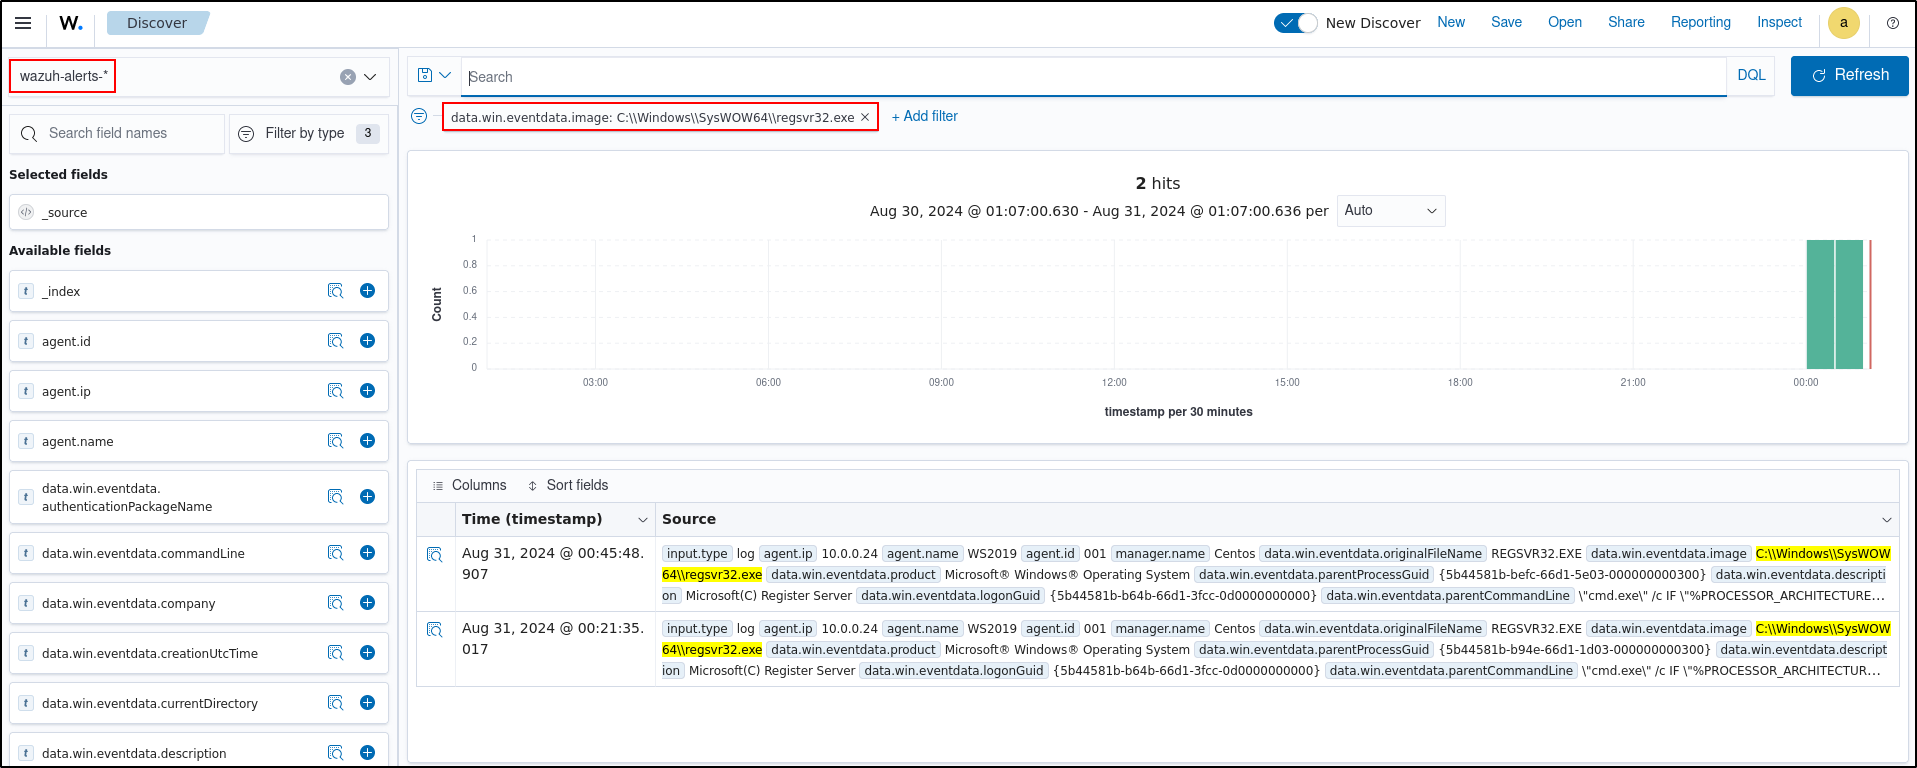
Navigate to Home, then Overview on the web UI
Select number displayed on the Critical severity

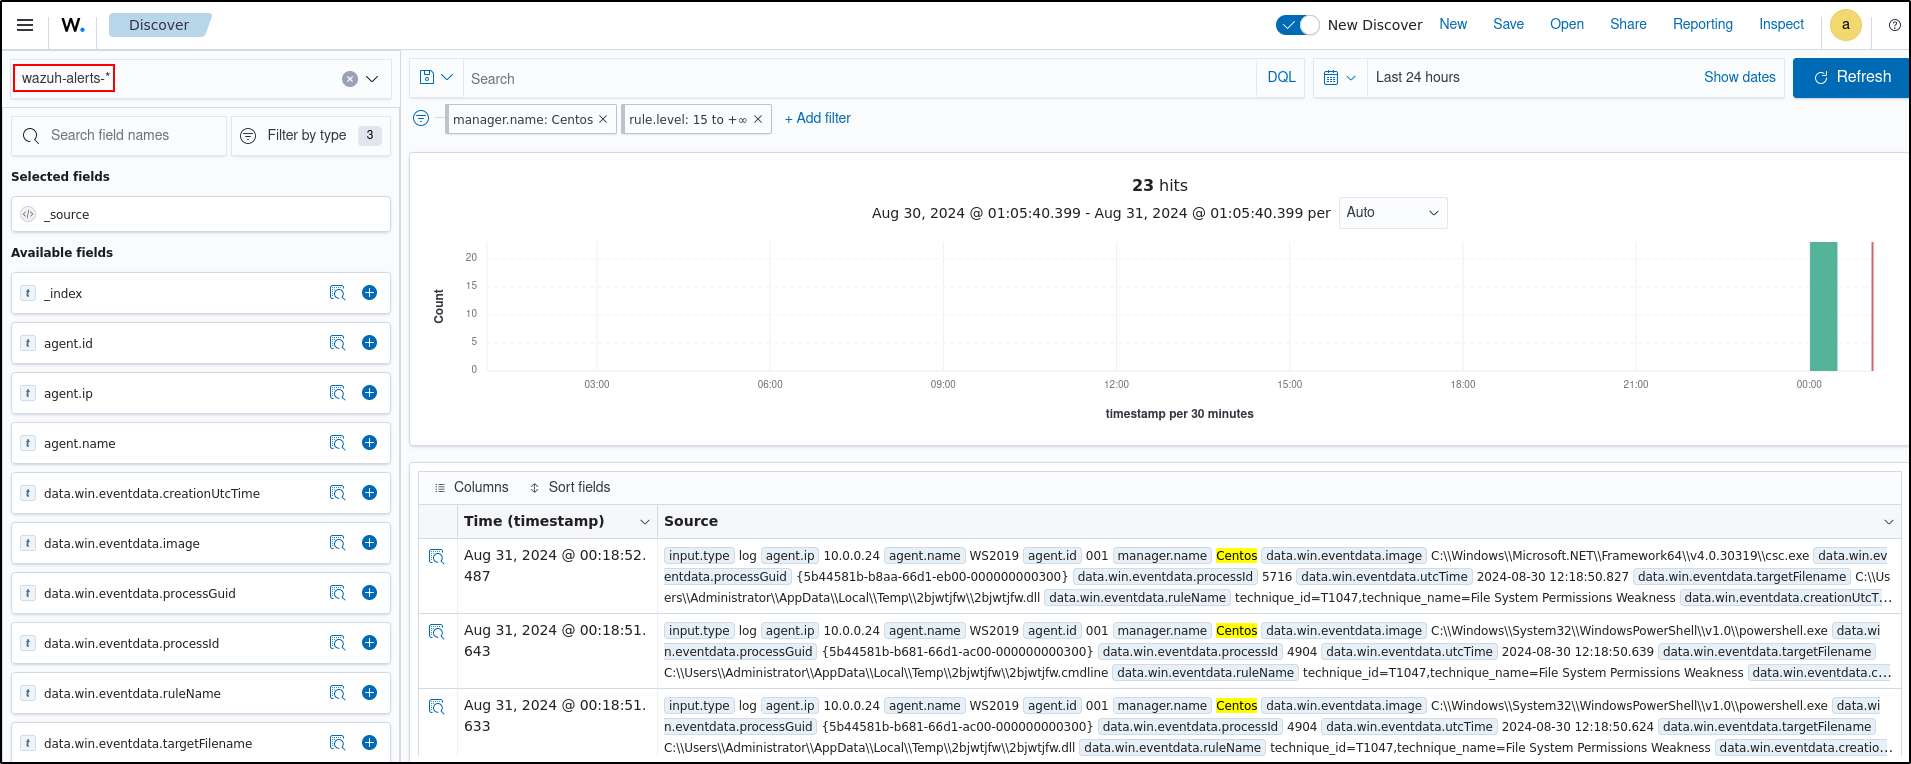
Clear all filters then add the filter data.wineventda.image is C:\Windows\SYSWOW64\regsvr32.exe
Troubleshoot index patterns
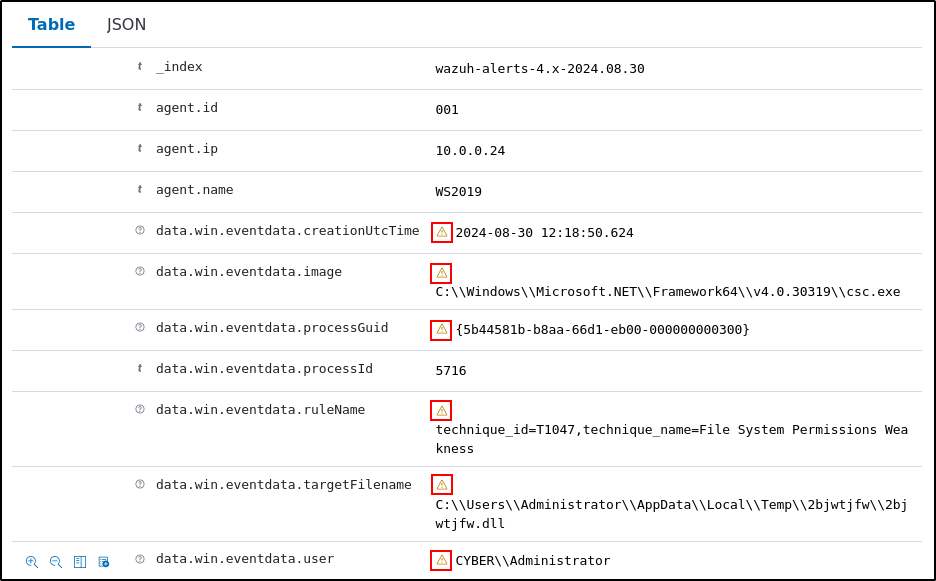
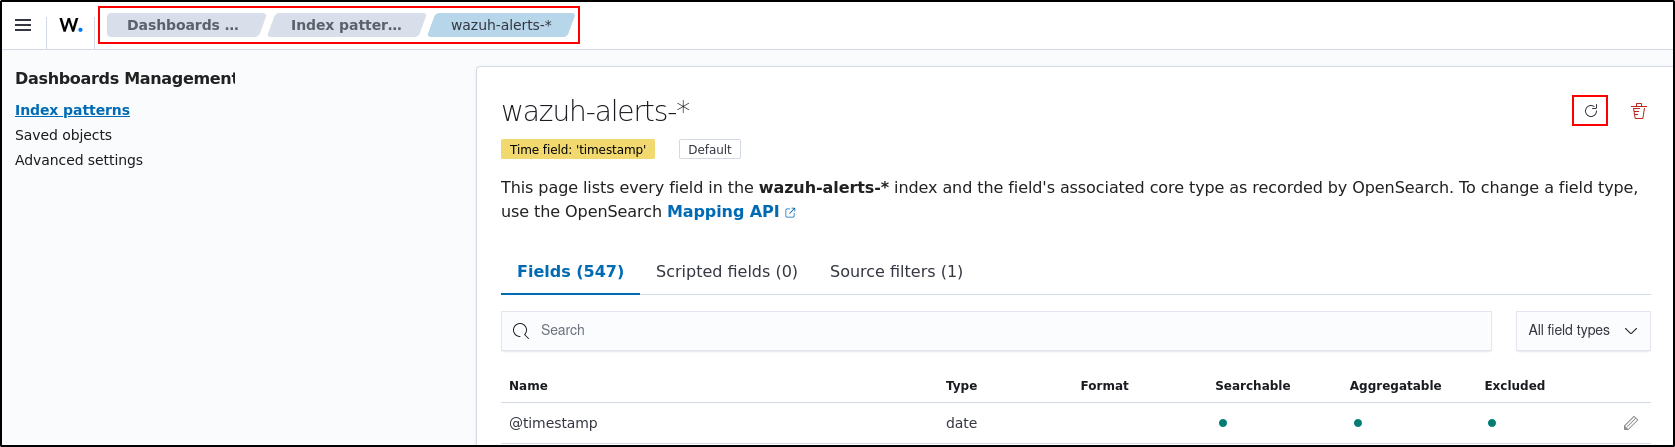
If search results displays the error icon and the message “No cached mapping for this field. Refresh field list from the index patterns page,” go to Dashboard Management, Index patterns and select each index. Click refresh button.
Detect suspicious binaries
Wazuh has anomaly and malware detection capabilities that detect suspicious binaries on an endpoint. Binaries are executable code written to perform automated tasks. Malicious actors use them mostly to carry out exploitation to avoid being detected.
In this use case, we demonstrate how the Wazuh rootcheck module can detect a trojan system binary on an Ubuntu endpoint. You perform the exploit by replacing the content of a legitimate binary with malicious code to trick the endpoint into running it as the legitimate binary.
The Wazuh rootcheck module also checks for hidden processes, ports, and files.
Configure the detection
Take the following steps on the Ubuntu endpoint to enable the Wazuh rootcheck module and perform anomaly and malware detection.
By default, the Wazuh rootcheck module is enabled in the Wazuh agent configuration file. Check the <rootcheck> block in the /var/ossec/etc/ossec.conf configuration file of the monitored endpoint and make sure that it has the configuration below:
<rootcheck>
    <disabled>no</disabled>
    <check_files>yes</check_files>

    <!-- Line for trojans detection -->
    <check_trojans>yes</check_trojans>

    <check_dev>yes</check_dev>
    <check_sys>yes</check_sys>
    <check_pids>yes</check_pids>
    <check_ports>yes</check_ports>
    <check_if>yes</check_if>

    <!-- Frequency that rootcheck is executed - every 12 hours -->
    <frequency>43200</frequency>
    <rootkit_files>/var/ossec/etc/shared/rootkit_files.txt</rootkit_files>
    <rootkit_trojans>/var/ossec/etc/shared/rootkit_trojans.txt</rootkit_trojans>
    <skip_nfs>yes</skip_nfs>
</rootcheck>
Run the controlled test
Record the original binary checksum and create a protected recovery copy:
Replace the original system binary /usr/bin/w with the following shell script:
sudo tee /usr/bin/w > /dev/null <<'EOF'
#!/bin/bash
echo "$(date) controlled Wazuh lab test" > /tmp/trojan_created_file
echo 'test for /usr/bin/w trojaned file' >> /tmp/trojan_created_file
/root/w.wazuh-lab-backup "$@"
EOF
sudo chmod 0755 /usr/bin/w
The rootcheck scan runs every 12 hours by default. Force a scan by restarting the Wazuh agent to see the relevant alert:
Visualise alerts
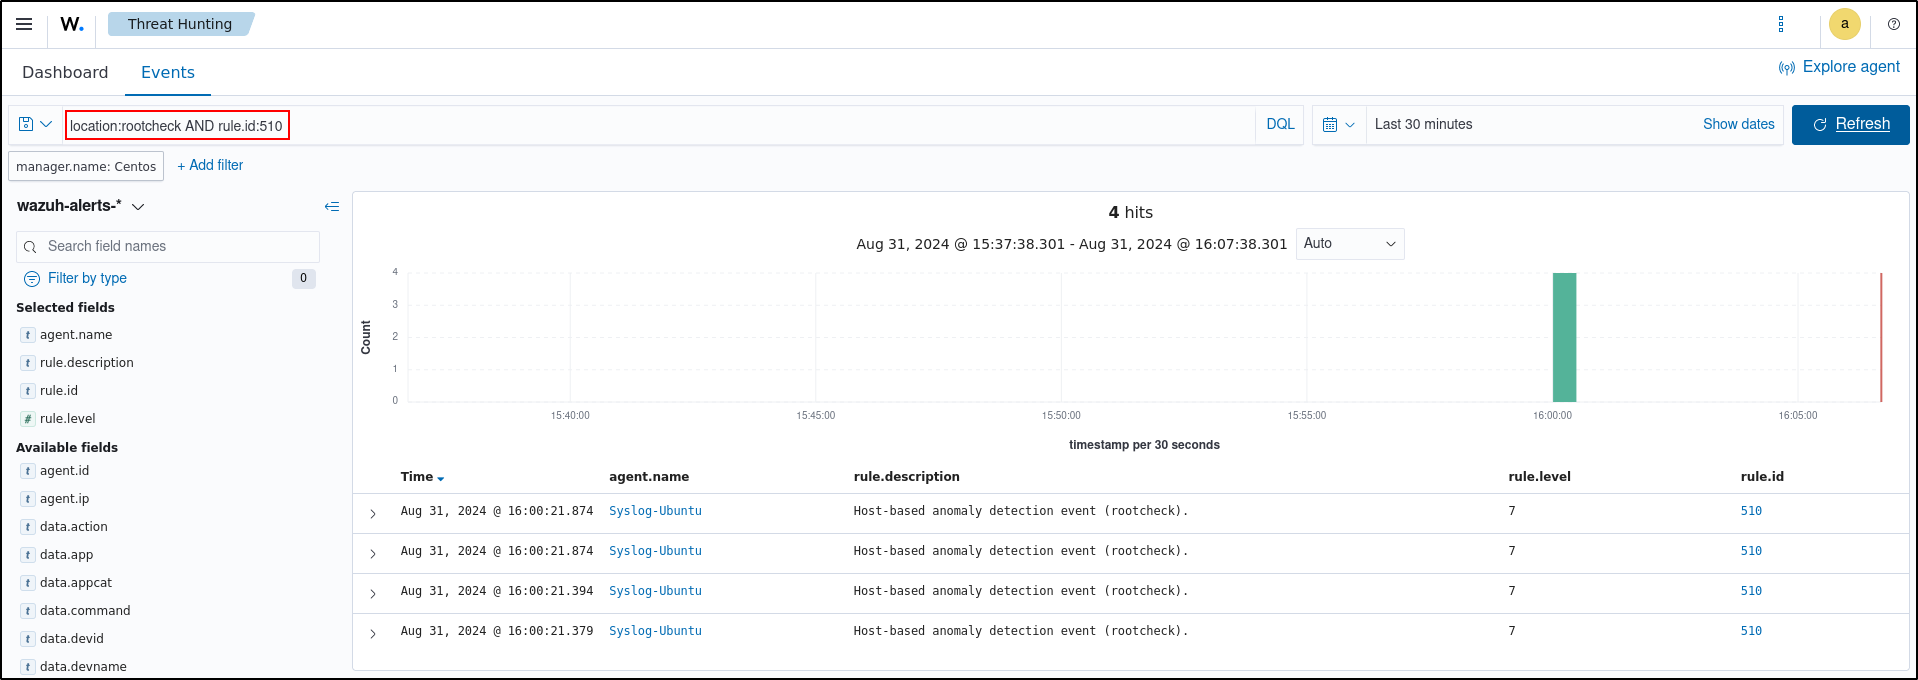
You can visualise the alert data in the Wazuh dashboard. To do this, go to the Threat Hunting module and add the filters in the search bar to query the alerts.
location:rootcheck AND rule.id:510
Restore and verify the original binary immediately after collecting evidence:
sudo install -m 0755 -o root -g root /root/w.wazuh-lab-backup /usr/bin/w
sudo rm -f /root/w.wazuh-lab-backup /tmp/trojan_created_file
command -v w
w
sha256sum /usr/bin/w
Compare the final checksum with the value recorded before the test.
Test file integrity monitoring
File Integrity Monitoring (FIM) helps in auditing sensitive files and meeting regulatory compliance requirements. Wazuh has an inbuilt FIM module that monitors file system changes to detect the creation, modification, and deletion of files.
Configure the Ubuntu endpoint
Edit the Wazuh agent /var/ossec/etc/ossec.conf configuration file. Add the directories for monitoring within the <syscheck> block. For this use case, you configure Wazuh to monitor the /root directory.
Restart the Wazuh agent to apply the configuration changes:
Test the configuration
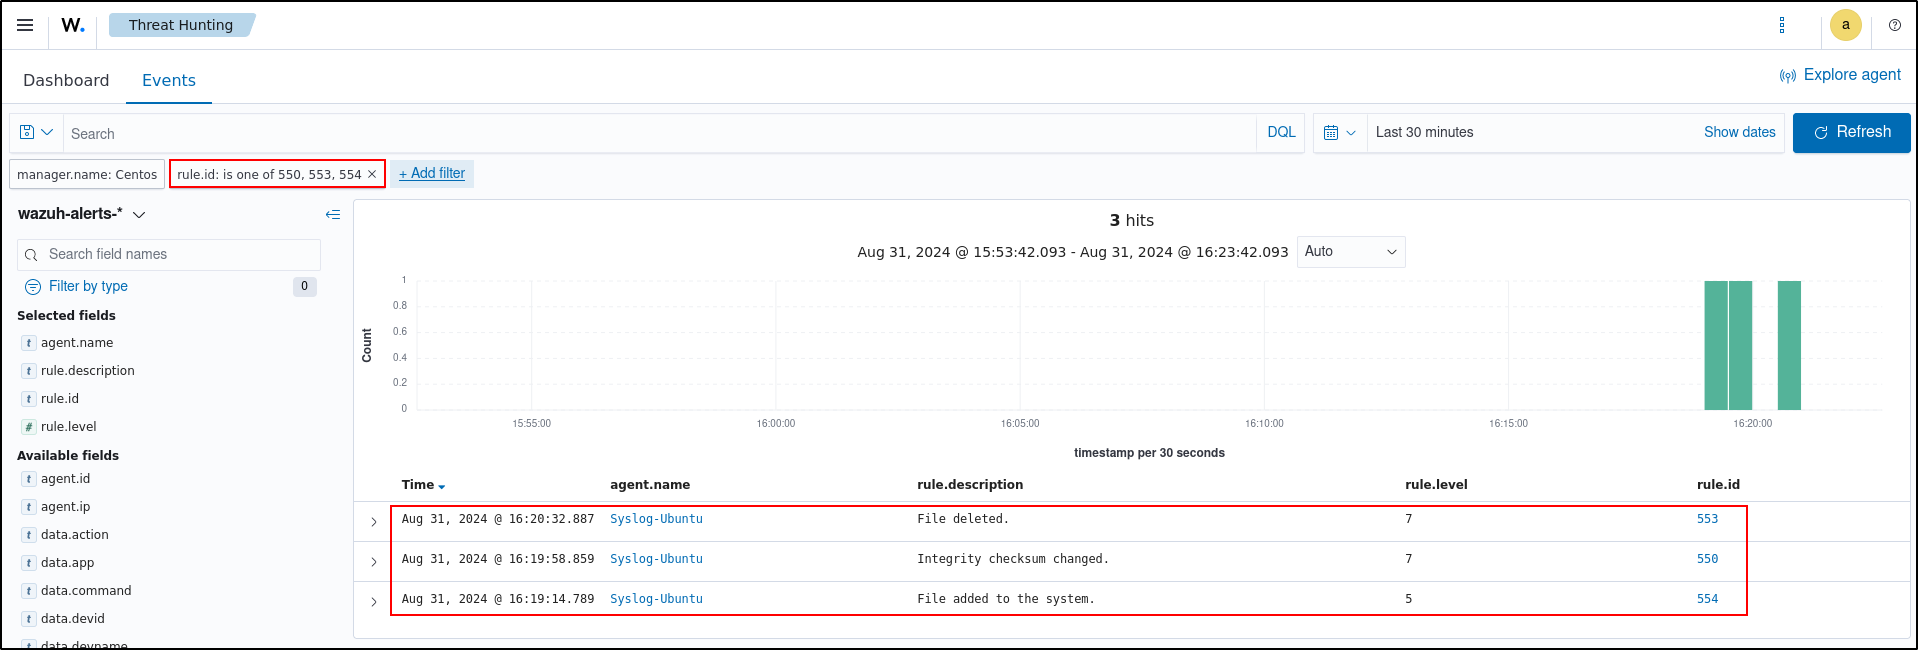
- Create a text file in the monitored directory then wait for 5 seconds.
- Add content to the text file and save it. Wait for 5 seconds.
- Delete the text file from the monitored directory.
Visualise alerts
You can visualise the alert data in the Wazuh dashboard. To do this, go to the File Integrity Monitoring module and add the filters in the search bar to query the alerts:rule.id: is one of 550,553,554
Test vulnerability detection
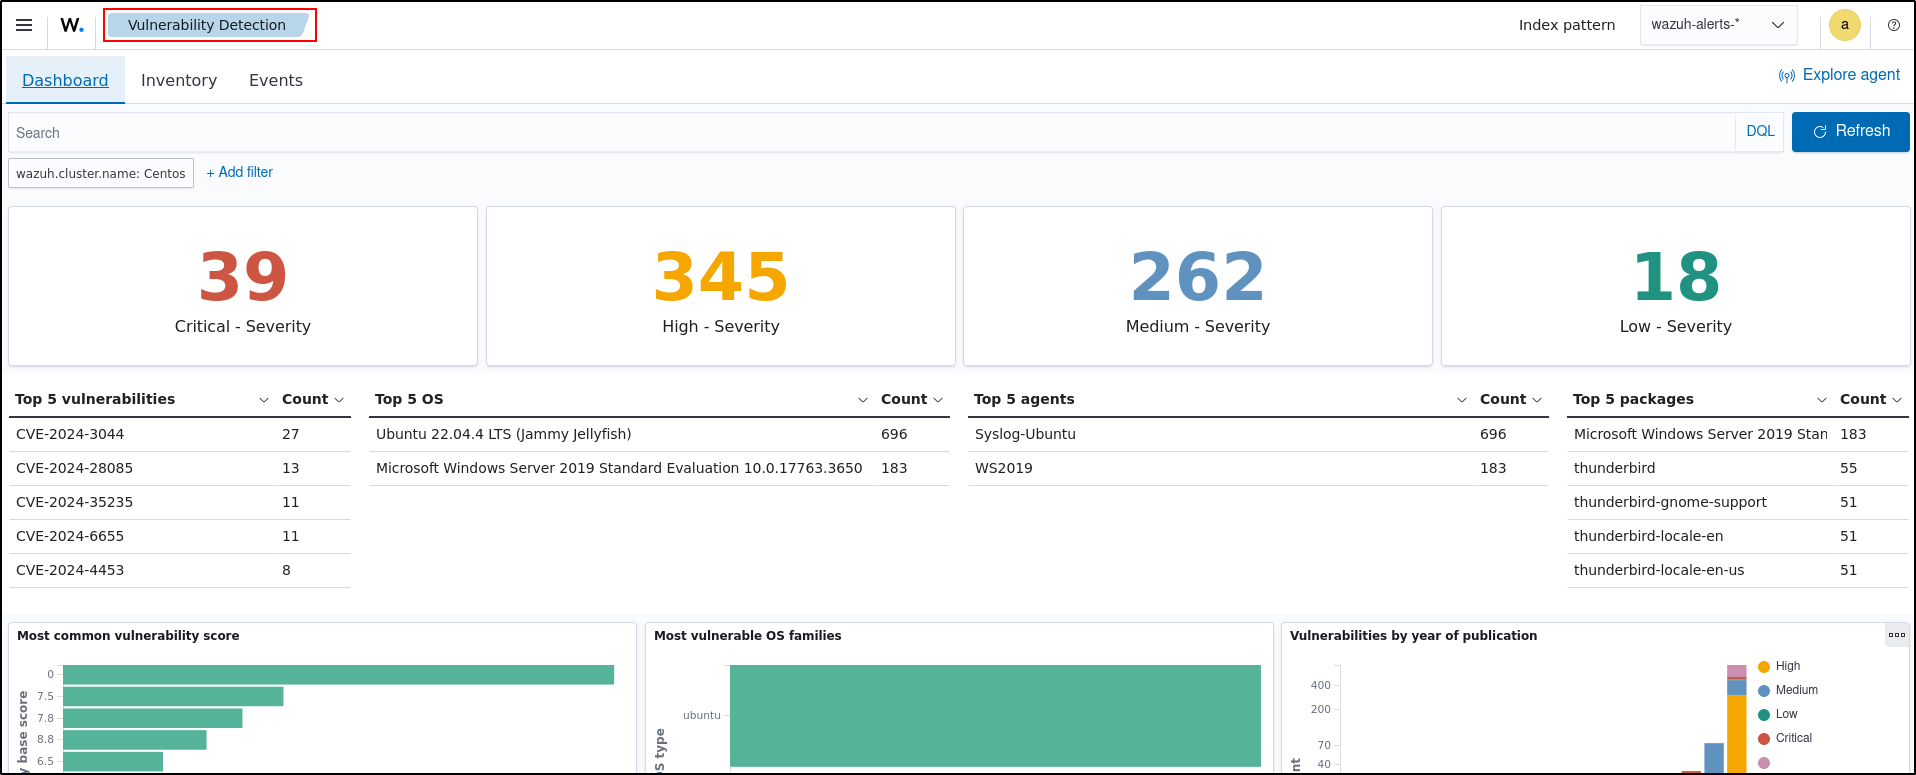
Wazuh uses the Vulnerability Detection module to identify vulnerabilities in applications and operating systems running on endpoints.
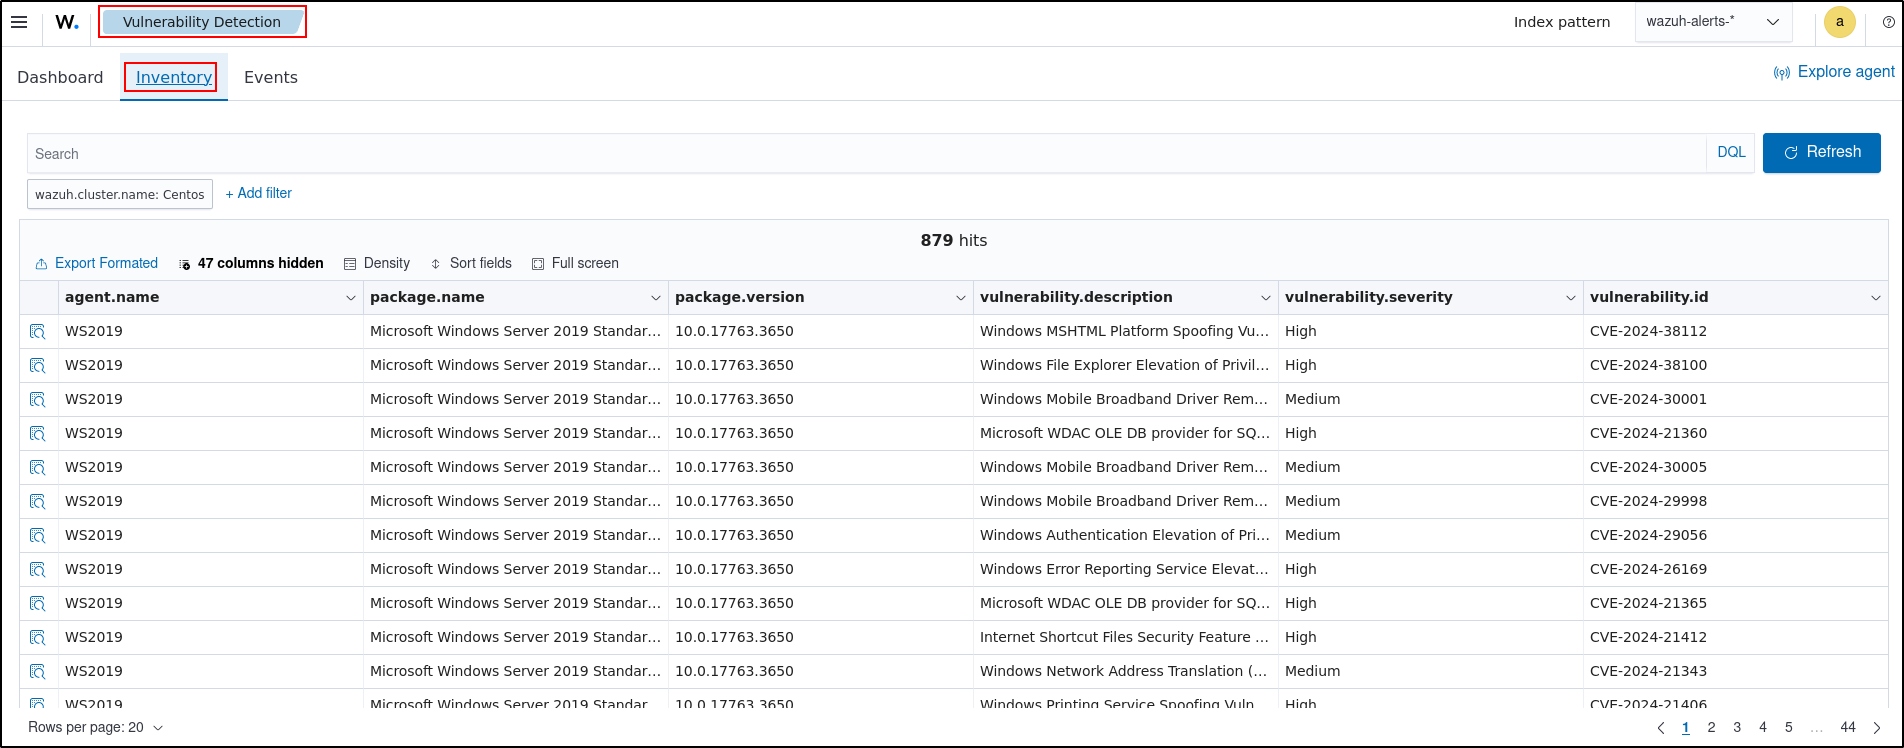
This use case shows how Wazuh detects unpatched Common Vulnerabilities and Exposures (CVEs) in the monitored endpoint.
Configure vulnerability detection
The Vulnerability Detection module is enabled by default. You can perform the following steps on the Wazuh server to ensure that the Wazuh Vulnerability Detection module is enabled and properly configured.
Open the /var/ossec/etc/ossec.conf file on the Wazuh server. Check the following settings.
Vulnerability Detection is enabled:
<vulnerability-detection>
   <enabled>yes</enabled>
   <index-status>yes</index-status>
   <feed-update-interval>60m</feed-update-interval>
</vulnerability-detection>
The indexer connection is properly configured. By default, the indexer settings have one host configured. It's set to 0.0.0.0 as highlighted below.
<indexer>
  <enabled>yes</enabled>
  <hosts>
    <host>https://0.0.0.0:9200</host>
  </hosts>
  <ssl>
    <certificate_authorities>
      <ca>/etc/filebeat/certs/root-ca.pem</ca>
    </certificate_authorities>
    <certificate>/etc/filebeat/certs/filebeat.pem</certificate>
    <key>/etc/filebeat/certs/filebeat-key.pem</key>
  </ssl>
</indexer>
Replace 0.0.0.0 with your Wazuh indexer node IP address or hostname. You can find this value in the Filebeat config file /etc/filebeat/filebeat.yml. Ensure the Filebeat certificate and key name match the certificate files in /etc/filebeat/certs. If you made changes to the configuration, restart the Wazuh manager.
Visualise vulnerabilities
You can visualise the detected vulnerabilities in the Wazuh dashboard. To see a list of active vulnerabilities, go to Vulnerability Detection and select Inventory.
Investigate the evidence
- Record the exact test time, host, account, and expected system change.
- Find the raw or archived source evidence first.
- Locate any resulting alert and compare its timestamp and fields.
- Identify the decoder, rule ID, level, groups, and ATT&CK mapping.
- Decide whether the evidence supports a malicious, suspicious, or benign conclusion in this context.
- Run the documented cleanup and confirm the endpoint returns to baseline.
Checkpoint: explain the detection
Another analyst should be able to reproduce your dashboard filters and connect the alert to its raw evidence. If no alert fired, state whether collection, decoding, or rule logic is the limiting stage.