Collect Network Logs
Send FortiGate events through the demonstrated rsyslog relay, then trace a source event into Wazuh.
FortiGate event path
Troubleshoot from left to right: prove that FortiGate emitted the event, the relay wrote it to the expected file, the agent collected it, the manager parsed and evaluated it, and the dashboard can retrieve the resulting record.
Detailed network-log procedure
- Configure FortiGate to send the selected log categories to
<SYSLOG_RELAY_IP>. - Configure rsyslog to accept only the intended source and write to a dedicated file.
- Configure rotation for that file before increasing event volume.
- Configure the Wazuh agent to monitor the file.
- Restart only the services whose configuration changed.
The complete FortiGate, rotation, direct-server, recommended rsyslog relay, Linux agent, decoder, rule, and verification material is retained below.
Configure syslog logging on FortiGate
On FortiGate Command-Line Interface (CLI), run the following commands to configure Syslog Server Settings:
config log syslogd setting
    set status enable
    set server <syslog-ng IP>
    set source-ip <FortiGate IP>
    # set port <port number>  (Default port is 514)
    # Verify settings by running "show"
end
Configure Log Memory Filter:
config log memory filter
    set forward-traffic enable
    set local-traffic enable
    set sniffer-traffic disable
    set anomaly enable
    set voip disable
    set multicast-traffic enable
    # Verify settings by running "show full-configuration"
end
Configure Global System Settings:
config system global
    set cli-audit-log enable
    # Verify settings by running "show"
    # Ensure the timezone is correct, e.g., "Pacific/Auckland"
end
Enable Logging for Neighbour Events:
Configure log rotation
By default, the logrotate service is configured to rotate logs in directories like /var/log/
For rsyslog, the rotation of its default log files (e.g., /var/log/syslog) is managed by the configuration file located at /etc/logrotate.d/rsyslog.
Open the /etc/logrotate.d/rsyslog file in a text editor:
Add the path to your fortigate.log file under the existing log files.
/var/log/syslog
/var/log/fortigate.log
...
{
    rotate 4
    weekly
    missingok
    notifempty
    compress
    delaycompress
    sharedscripts
    postrotate
        /usr/lib/rsyslog/rsyslog-rotate
    endscript
}
Key Settings:
- rotate 4: Keeps 4 log files before deleting the oldest one.
- weekly: Rotates logs once per week.
- missingok: If the log file is missing, no error will be raised.
- notifempty: Only rotates logs if they are not empty.
- compress: Compresses old log files (e.g., to
.gz). - delaycompress: Compresses the logs on the second rotation cycle, meaning the most recent rotated file is not compressed immediately.
- sharedscripts: Runs the
postrotatescript only once, even if multiple logs are rotated. - postrotate: After log rotation, it runs
/usr/lib/rsyslog/rsyslog-rotateto ensure thatrsyslogreopens its log files (so it doesn't keep writing to the old rotated file).
Configure syslog on the Wazuh server
The Wazuh server can collect logs via syslog from endpoints such as firewalls, switches, routers, and other devices that don’t support the installation of Wazuh agents. More details can be found here.
If you have a central logging server like Syslog or Logstash in place, you can install the Wazuh agent on that server to streamline log collection. This setup enables seamless forwarding of logs from multiple sources to the Wazuh server, facilitating comprehensive analysis.
Configure rsyslog on the Ubuntu endpoint
Rsyslog is a preinstalled utility in Ubuntu 22.04 for receiving syslog events. The following section shows the steps for enabling Rsyslog on the Ubuntu endpoint and configuring the Wazuh agent to send the syslog log data to the Wazuh server.
Edit /etc/rsyslog.conf.
Uncomment udp/514. Add allowed sender and configure log file format. Save changes.
# Provides UDP syslog reception
module(load="imudp")
input(type="imudp" port="514")

# Replace this with the exact FortiGate source address
$AllowedSender UDP, <FORTIGATE_IP>
$template remote-incoming-logs, "/var/log/%HOSTNAME%.log"
*.* ?remote-incoming-logs
Permit udp/514 through the firewall (if firewall is configured and enabled).
Do not make /var/log group-writable to work around a receiver error. Validate
the rsyslog configuration and inspect its service log; rsyslog should create the
destination file with its configured ownership and mode.
Add any hosts you are receiving logs from to /etc/hosts
Restart and check status of rsyslog.
Configure the syslog clients (network devices) to send logs to our syslog server. Check /var/log to see that new log files are updating.
#Example output
2024-09-13T08:13:46.806479+12:00 fortigate date=2024-09-12 time=15:44:50 devname="Fortigate" devid="FGVMEVUEOETC5XC8" eventtime=1726112689938988753 tz="+1200" logid="0001000014" type="traffic" subtype="local" level="notice" vd="root" srcip=192.168.1.64 srcport=14712 srcintf="root" srcintfrole="undefined" dstip=38.21.192.5 dstport=443 dstintf="port1" dstintfrole="wan" srccountry="Reserved" dstcountry="United States" sessionid=44992 proto=6 action="close" policyid=0 service="HTTPS" trandisp="noop" app="HTTPS" duration=1 sentbyte=441 rcvdbyte=223 sentpkt=5 rcvdpkt=4
Install the Wazuh agent on Ubuntu
The Linux agent initiates outbound connections to the manager. Most default UFW
policies already allow outbound traffic, so do not add inbound rules for
1514, 1515, or 55000 on the endpoint. If outbound traffic is restricted,
allow TCP 1514 and 1515 only to <WAZUH_SERVER_IP>; allow 55000 only when
an administrative enrollment workflow explicitly uses the API.
Download Wazuh agent from the packages list.
Download the exact wazuh-agent package recorded in the tested-version table,
verify its published SHA-512 checksum, and transfer it to the endpoint. Do not
install a wazuh-indexer package on an endpoint.
After installing, set the Wazuh manager's IP address by editing the configuration file. Look for the <server> section and update it with the Wazuh manager's IP address.
<ossec_config>
  <client>
    <server>
      <address>WAZUH_SERVER_IP</address>
      <port>1514</port>
      <protocol>tcp</protocol>
    </server>
    <config-profile>ubuntu, ubuntu22, ubuntu22.04</config-profile>
    <notify_time>10</notify_time>
    <time-reconnect>60</time-reconnect>
    <auto_restart>yes</auto_restart>
    <crypto_method>aes</crypto_method>
  </client>
Start and enable the Wazuh agent. Verify Wazuh agent is active and running.
On Wazuh server UI, verify Ubuntu agent is active
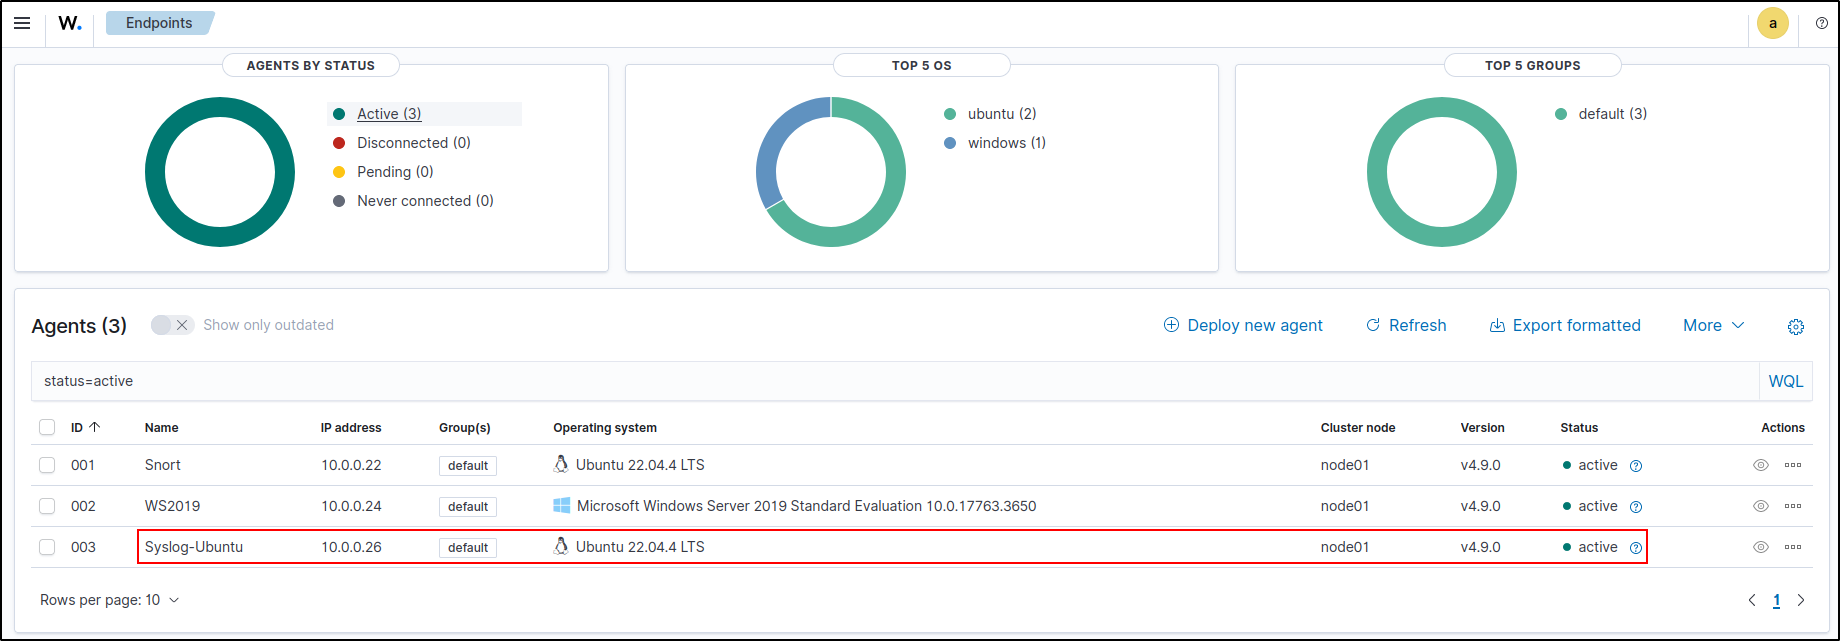
Configure Wazuh to monitor the FortiGate log
Add the following to /var/ossec/etc/ossec.conf file on Wazuh manager and agent.
#On both Wazuh manager and agent
<localfile>
  <log_format>syslog</log_format>
  <location>/var/log/fortigate.log</location>
</localfile>
Restart the manager and agent after adding this setting:
Verify fortigate logs are being ingested. Follow the steps below to enable archiving and set up wazuh-archives-* index. Search wazuh-alerts- and wazuh-archives- index. Add filter for location is /var/log/fortigate.log.
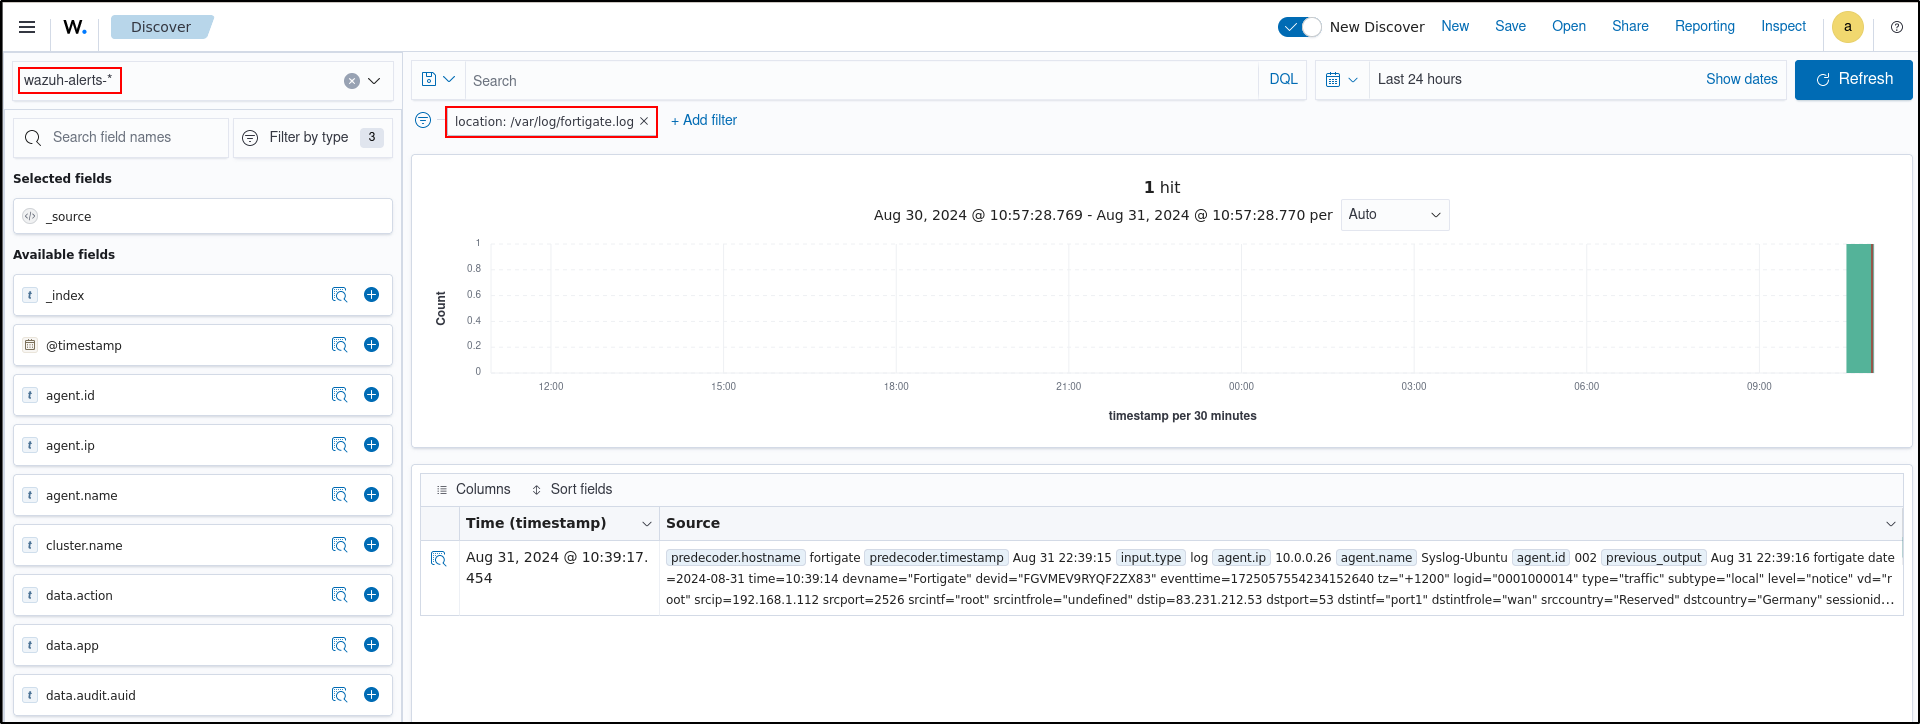
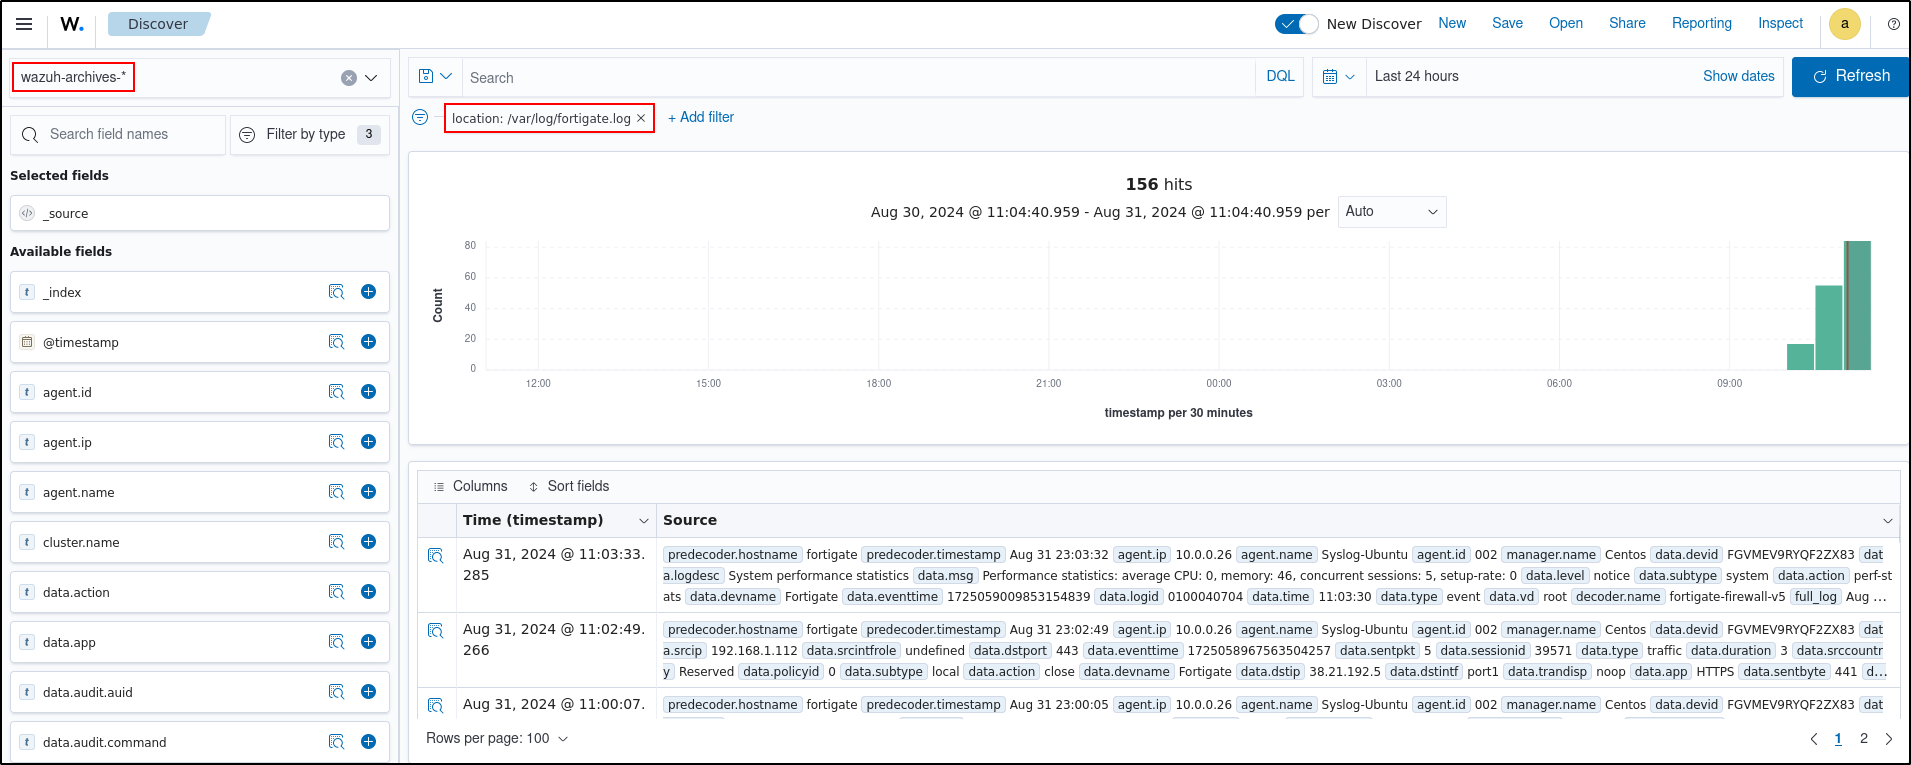
Review default decoders and rules for FortiGate
By default, Wazuh has pre-installed decoders and rules for FortiGate. This can be checked in Wazuh server UI under Rules and Decoders
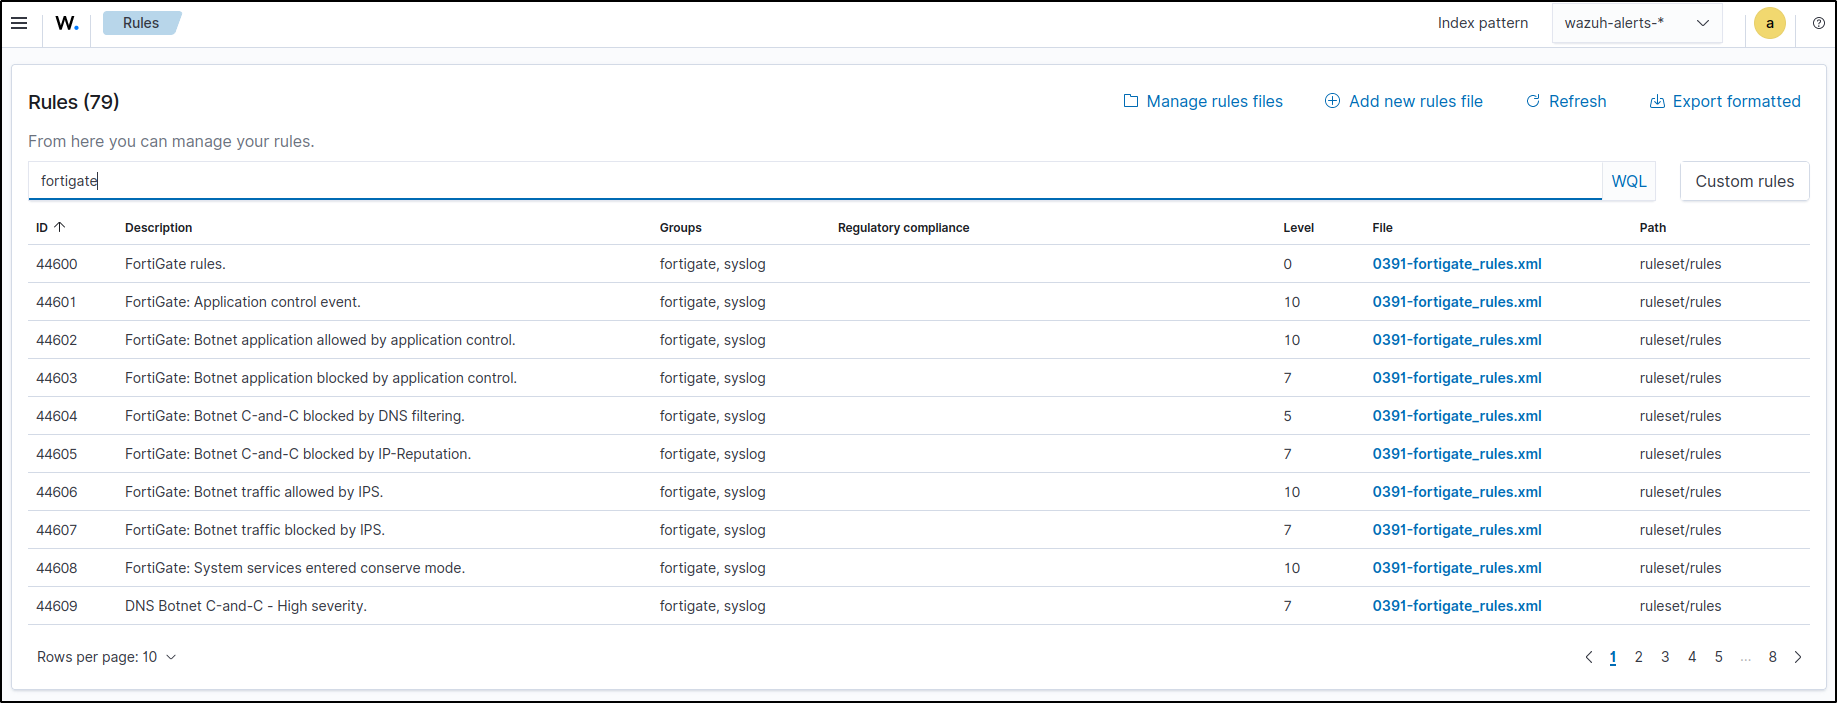
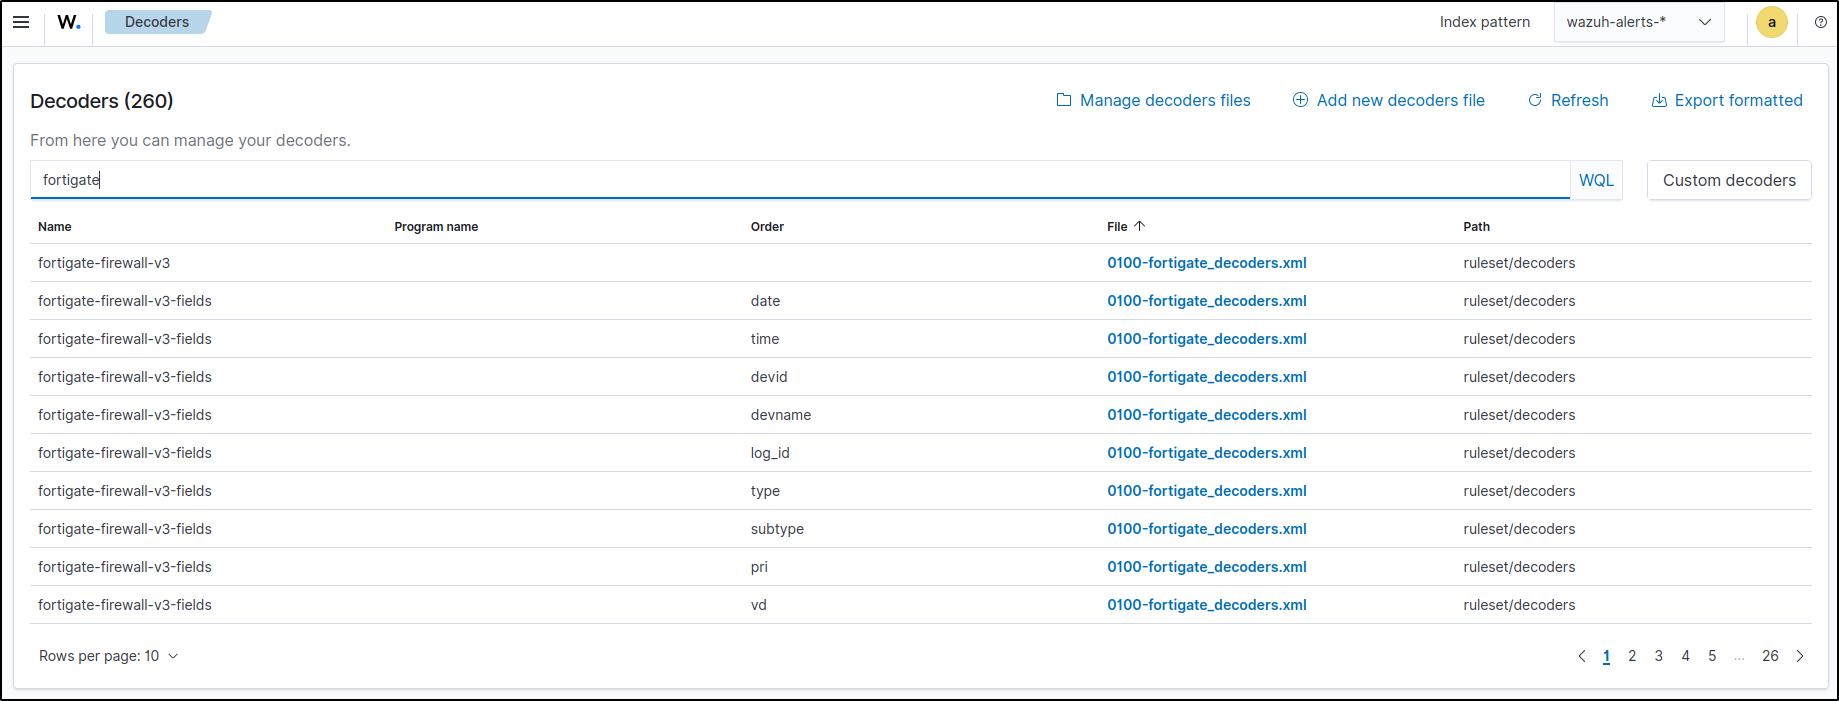
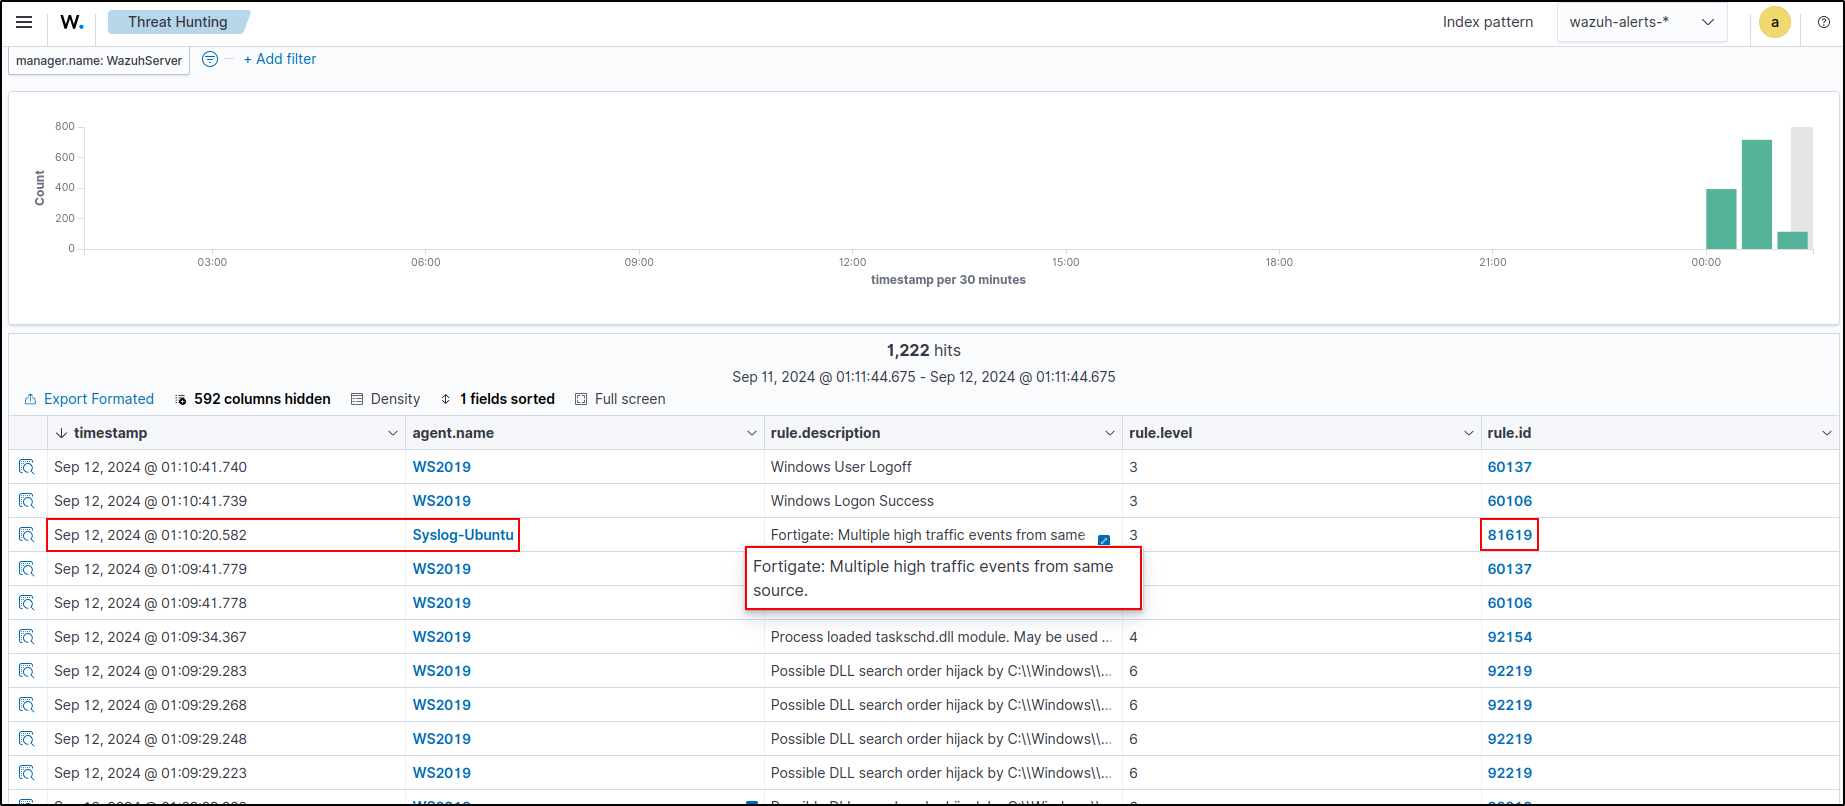
To test the default rule for FortiGate, SSH brute force attack was executed from Kali machine.
The alert from the rule “Fortigate: Multiple high traffic events from same source” was generated.
This can be verified in Threat Intelligent, Events section on the web UI.
Checkpoint: trace one FortiGate event
Record a FortiGate event time and source address. Confirm the same event appears in the relay file, then in Wazuh with the expected location and parsed device fields. An alert is not required for this checkpoint; proving transport and parsing is the goal.